Moise et al. develop a finite element model of the intercalated disk (ID) that takes into account the nanoscale structure. Incorporating these details in a cardiac tissue model predicts that alterations in ID structure can affect electrical conduction in the heart.
Abstract
The intercalated disk (ID) is a specialized subcellular region that provides electrical and mechanical connections between myocytes in the heart. The ID has a clearly defined passive role in cardiac tissue, transmitting mechanical forces and electrical currents between cells. Recent studies have shown that Na+ channels, the primary current responsible for cardiac excitation, are preferentially localized at the ID, particularly within nanodomains such as the gap junction–adjacent perinexus and mechanical junction–associated adhesion-excitability nodes, and that perturbations of ID structure alter cardiac conduction. This suggests that the ID may play an important, active role in regulating conduction. However, the structures of the ID and intercellular cleft are not well characterized and, to date, no models have incorporated the influence of ID structure on conduction in cardiac tissue. In this study, we developed an approach to generate realistic finite element model (FEM) meshes replicating nanoscale of the ID structure, based on experimental measurements from transmission electron microscopy images. We then integrated measurements of the intercellular cleft electrical conductivity, derived from the FEM meshes, into a novel cardiac tissue model formulation. FEM-based calculations predict that the distribution of cleft conductances is sensitive to regional changes in ID structure, specifically the intermembrane separation and gap junction distribution. Tissue-scale simulations predict that ID structural heterogeneity leads to significant spatial variation in electrical polarization within the intercellular cleft. Importantly, we found that this heterogeneous cleft polarization regulates conduction by desynchronizing the activation of postjunctional Na+ currents. Additionally, these heterogeneities lead to a weaker dependence of conduction velocity on gap junctional coupling, compared with prior modeling formulations that neglect or simplify ID structure. Further, we found that disruption of local ID nanodomains can either slow or enhance conduction, depending on gap junctional coupling strength. Our study therefore suggests that ID nanoscale structure can play a significant role in regulating cardiac conduction.
Introduction
The intercalated disk (ID) is the specialized structure at the site of the cell–cell interface connecting myocytes in the heart, facilitating electrical coupling via gap junctions (GJs) and mechanical coupling via mechanical junctions (MJs; Leo-Macías et al., 2015). Recent evidence has highlighted the structural heterogeneity of the ID (Zhang et al., 1996; Miyamoto et al., 2002; Shimada et al., 2004; Leo-Macías et al., 2015; Pinali et al., 2015; Leo-Macias et al., 2016; Vanslembrouck et al., 2018; Vanslembrouck and Kremer, 2020): the ID consists of highly tortuous plicate regions (which are oriented perpendicular to the myocyte’s axis, comprise membrane “folds,” and contain the majority of MJs [adherens junctions, desmosomes, and composite junctions]) and interplicate regions (which run parallel to the myocyte’s axis and contain most GJs). MJs and GJs have clearly defined roles in the passive conduction of mechanical forces and electrical currents, respectively. However, recent studies show that multiple electrogenic proteins regulating conduction, in particular the voltage-gated Na+ channel, NaV1.5, are localized at the ID (Maier et al., 2004; Lin et al., 2011; Petitprez et al., 2011; Rhett et al., 2012; Agullo-Pascual et al., 2014; Veeraraghavan et al., 2015, 2018; Veeraraghavan and Gourdie, 2016; Vermij et al., 2017), in close proximity to the junctions, specifically GJ-adjacent perinexi and MJ adhesion-excitability nodes, forming specialized nanodomains in the intercellular cleft spaces (Radwański et al., 2018). Further, structural perturbations of the ID have been shown to alter conduction and risk of arrhythmias (Veeraraghavan et al., 2012; Mezache et al., 2020; George et al., 2015; George and Poelzing, 2016; Veeraraghavan et al., 2018), and ID structure is disrupted in patients with atrial fibrillation (Raisch et al., 2018). Collectively, these findings suggest that ID structure plays an important active role in regulating cardiac conduction.
Standard cardiac tissue modeling approaches, e.g., the monodomain model, typically neglect ID structure and nonuniform ion channel distributions. However, prior in silico studies, including our work, that do account for these details predict that NaV1.5 localization at the ID facilitates cell–cell coupling via a mechanism known as ephaptic coupling (Lin and Keener, 2010; Mori et al., 2008; Tsumoto et al., 2020; Kucera et al. 2002; Wei et al., 2016; Wei and Tolkacheva, 2020; Sperelakis and Mann, 1977; Sperelakis and Mann, 2002; Weinberg, 2017; Greer-Short et al., 2017; Nowak et al., 2020; Nowak et al., 2021; Veeraraghavan et al., 2015; Tveito et al., 2017). Ephaptic coupling is mediated by interactions between Na+ currents, INa, on adjacent ID membranes sharing a restricted intercellular cleft space and the associated electrochemical gradients that form in this space. Specifically, during the cardiac action potential, INa at the ID in a depolarizing cell (i.e., prejunctional INa) reduces the electrical potential of the intercellular cleft. This reduction in intercellular cleft potential depolarizes the apposing cell from the extracellular, rather than the intracellular, side of the cell membrane. Additionally, ID-localized INa reduces the local Na+ concentration of the intercellular cleft, and collectively these electrochemical gradients alter both the apposing ID membrane transmembrane potential and postjunctional INa driving force. Prior work has predicted that a narrow intercellular cleft width, which enhances the effects of ephaptic coupling, can either enhance or slow conduction, depending on the timing and magnitude of postjunctional INa (Kucera et al., 2002; Mori et al., 2008; Weinberg, 2017).
While providing important insights into how nonuniform Na+ distribution regulates conduction, most of these modeling studies simply represent the intercellular cleft as a single, uniform compartment. Two recent studies have considered spatial variation within the ID and the cleft: Mori et al. (2008) investigated ephaptic coupling in a radially symmetric strand of cells, and Hichri et al. (2018) modeled the ID Na+ channel distribution as either uniform or in two apposing clusters. However, all of these prior studies make a key simplifying assumption about the ID and intercellular cleft space, specifically that the cleft is a uniform, cylindrical space and the intermembrane separation between apposing ID membranes is uniform throughout the ID. Thus, all prior modeling studies have neglected the structural heterogeneity of the ID and intercellular cleft space (e.g., variations between plicate and interplicate regions). Thus, the mechanisms underlying conduction changes due to ID structural perturbations (Veeraraghavan et al., 2012; Mezache et al., 2020; George et al., 2015; George and Poelzing, 2016; Veeraraghavan et al., 2018) are not well understood.
The goal of this work is to develop an approach to integrate ID structural heterogeneity into a model of cardiac tissue and investigate the impact of this heterogeneity on conduction. For this approach, we first generate realistic 3-D finite element model (FEM) meshes of the ID and intercellular cleft, based on measurements from transmission electron microscopy (TEM) images of mouse ventricles. We then calculate a reduced electrical network, based on the FEM meshes, to represent the cleft, crucially bypassing the computationally costly step of simulating electrostatics on the full 3-D FEM mesh, and incorporate this reduced network into a novel cardiac tissue model formulation that accounts for the heterogeneity at the ID. In our study, simulations predict that ID structural heterogeneity has a significant impact on electrical conduction. Notably, we find that both the monodomain and single-cleft tissue models either over- or underestimate predictions of conduction velocity (CV), depending on the relative strength of GJ coupling. Importantly, the ID structure results in heterogeneous, asynchronous behavior of the electrical potential and Na+ concentration in the intercellular cleft and INa at the ID, and these changes collectively regulate cardiac conduction. These findings improve our understanding of arrhythmia mechanisms associated with pathological ID structural remodeling and suggest the ID structure as a potential new therapeutic target.
Materials and methods
The overall goal of incorporating ID structure into a cardiac tissue model is accomplished in three stages. First, we develop an algorithm to construct a 3-D FEM mesh of the ID and intercellular cleft, reproducing the structure of key ID measurements from TEM images. Importantly, this mesh generation incorporates several orders of magnitude of structural details, from the nanoscale structure of intermembrane separation, up to the microscale structure of the interplicate and plicate regions. Second, we calculate an equivalent electrical network for the conductivity within and out of the intercellular cleft space. We calculate this reduced cleft network by partitioning the full finite element mesh into a tractable number (25–200) of compartments and determining the equivalent electrical conductance between all pairs of adjacent compartments. Finally, we incorporate this cleft network into a cardiac tissue model, in which neighboring myocytes are coupled via GJs and their shared intercellular cleft space. Importantly, by representing ID-localized ion channels that induce heterogeneous electrical polarization and ionic concentration gradients within the intercellular cleft spaces, the tissue model links nanoscale ID structure with macroscale cardiac tissue function.
Tissue collection
All animal procedures were approved by Institutional Animal Care and Use Committee at the Ohio State University and were performed in accordance with the Guide for the Care and Use of Laboratory Animals published by the U.S. National Institutes of Health (publication no. 85–23, revised 2011). Male C57/BL6 mice (30 g, 6–18 wk) were anesthetized with 5% isoflurane mixed with 100% oxygen (1 liter/min). After loss of consciousness, anesthesia was maintained with 3–5% isoflurane mixed with 100% oxygen (1 liter/min). Once the animal was stably in a surgical plane of anesthesia, the heart was excised, leading to euthanasia by exsanguination. The isolated hearts were prepared for fixation for TEM. Ventricles were dissected and fixed overnight in 2% glutaraldehyde at 4°C for resin embedding and ultramicrotomy as previously described (Mezache et al., 2020; Veeraraghavan et al., 2018).
TEM and quantification
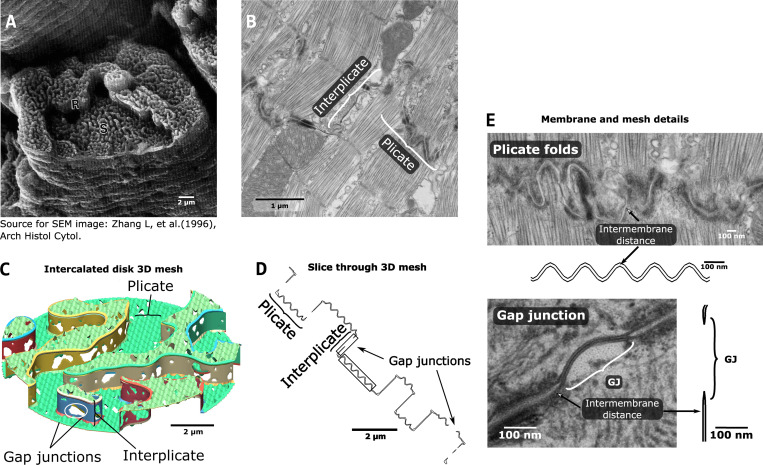
TEM images of the ID, particularly GJs and MJs, were obtained at 6,000×, 10,000×, and 20,000× magnification on an FEI Technai G2 Spirit transmission electron microscope (Thermo Fisher Scientific). Morphometric quantification was performed using ImageJ (National Institutes of Health) by manually identifying and quantifying the following 11 specific ID measurements. Images at 6,000× magnification were used to quantify total ID cross-sectional length (1). Images at 10,000× magnification were used to quantify the length of plicate and interplicate regions (2 and 3; Fig. 1 B); the amplitude and frequency of plicate folds (4 and 5; Fig. 1 E), and the lengths of GJs and the fraction of membrane comprised of GJs, in both plicate and interplicate regions (6–9; Fig. 1 E). Images at 20,000× magnification were used to quantify the intermembrane distance in the plicate and interplicate regions, identified by regions outside MJs and GJs, respectively (10 and 11; Fig. 1 E). The Wilcoxon rank sum test was used for single comparisons between plicate and interplicate region measurements. A P value of <0.01 was considered statistically significant. Measurements are reported by the mean ± SEM and the first and third quartile range.
Figure 1.
ID structure and FEM representation.(A) Scanning electron microscopy (SEM) image of the ID from monkey ventricular myocyte. S and R indicate “steps” and “risers,” denoting the plicate and interplicate regions, respectively. Reproduced from Zhang et al. (1996) with permission. (B) TEM image of mouse ventricular myocyte ID, illustrating the plicate and the interplicate regions. (C) View of the 3-D FEM model, with plicate and interplicate regions and GJs highlighted. (D) Slice through the FEM mesh, illustrating a corresponding view to the 2-D TEM image. The sections in the gray boxes are enlarged in E. (E) Magnified view of TEM images and FEM mesh slices, showing structural details for the plicate folds (top) and the GJs (bottom).
FEM mesh generation
Based on measurements from TEM images, we developed an approach to replicate the nanoscale structure of the ID, generating realistic 3-D FEM meshes of the two cell membranes at the ID and the enclosed intercellular cleft space (Fig. 1). The resulting structures are randomly generated but parametrically defined based on the TEM measurements described above (Fig. S1, left). Specifically, these mesh parameters define the key features of the ID structure and fit them to experimental data: ID diameter, plicate and interplicate region length, plicate and interplicate region intermembrane distance, GJ size and distribution in both regions, and plicate fold amplitude and frequency (Table S1).
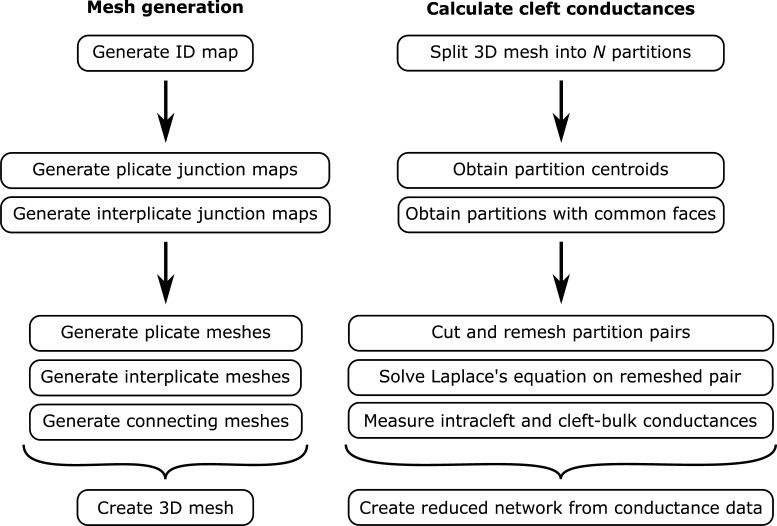
Figure S1.
Illustration of the mesh generation (left) and cleft conductance (right) calculation algorithms.
ID and GJ map generation
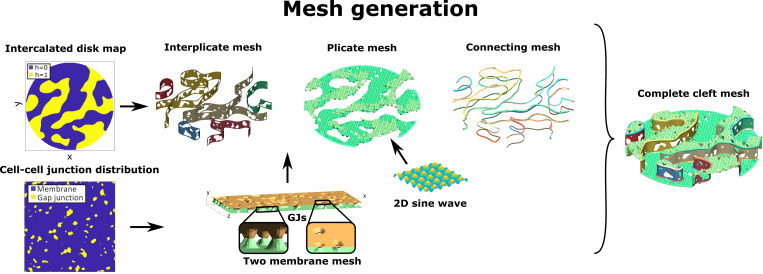
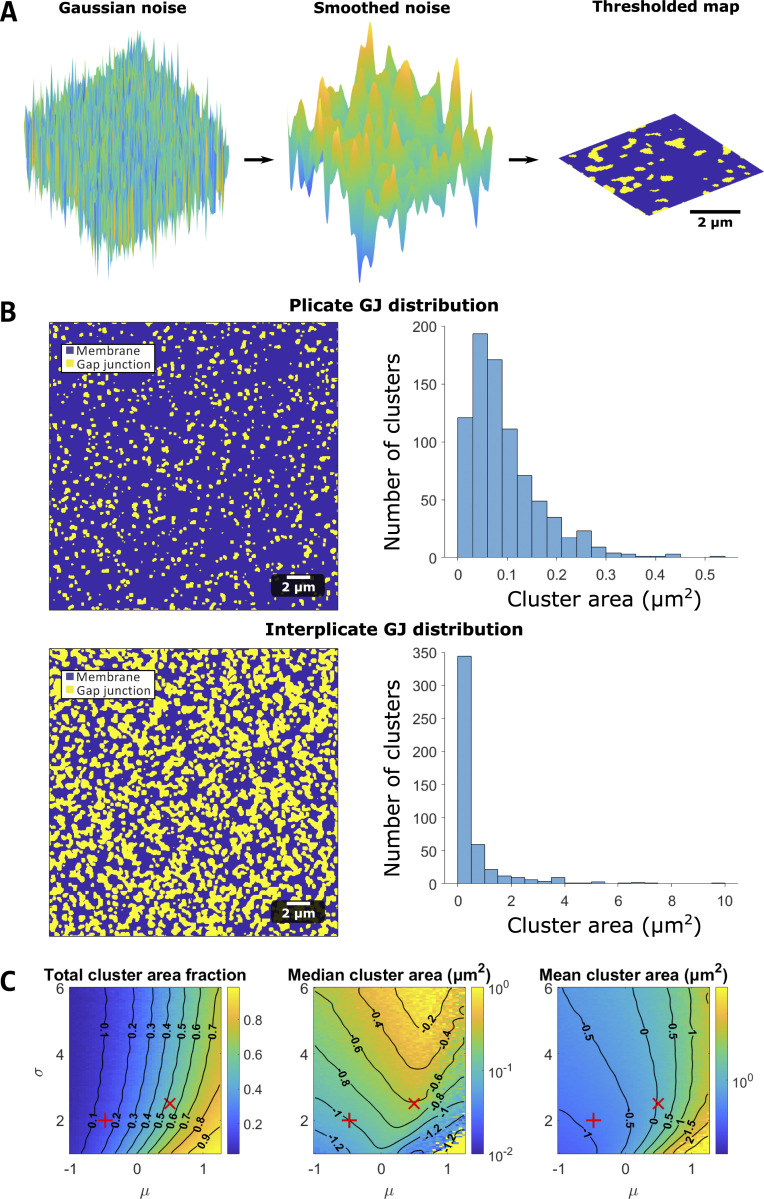
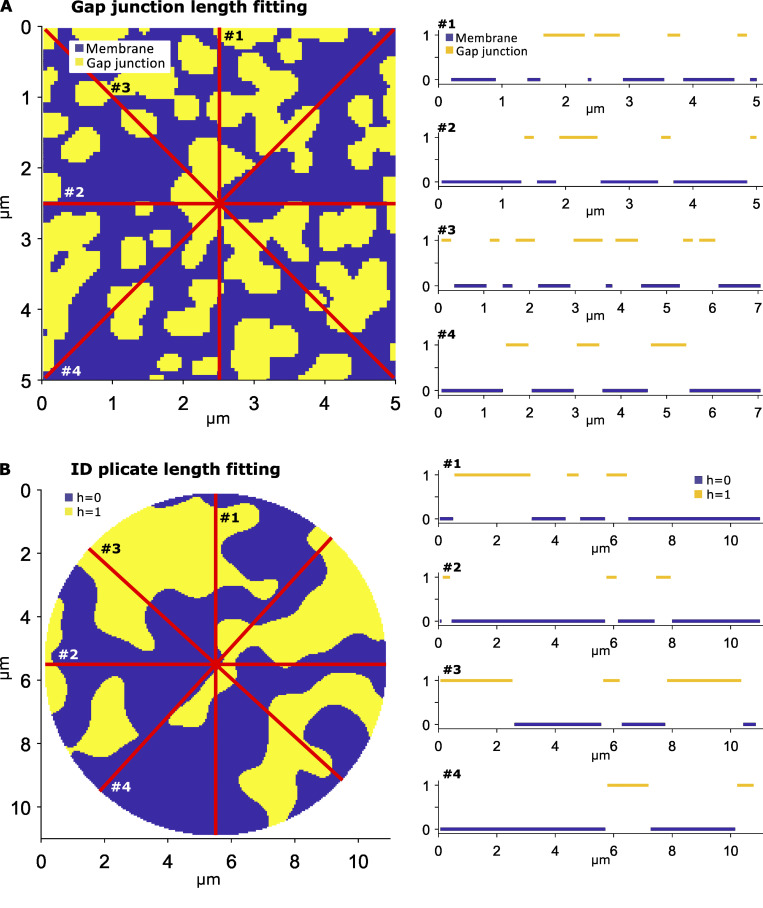
The first step in the mesh generation involves developing “maps” that represent the patterns for two key structures, specifically the plicate regions within the ID and location of GJ clusters (Fig. 2). Full details of this map generation approach are described in the Supplemental text at the bottom of the PDF. The ID map represents a cross section of the entire ID, such that the map defines different levels or tiers of plicate regions (defined as representing the (x,y) plane), which are separated by interplicate regions (in the z-direction; see Fig. 1 C). The GJ map represents the locations of individual GJ clusters. The same methodology is used to generate maps of both structures, with different algorithm parameters. In brief, a 2-D map is generated by filtering and thresholding Gaussian random noise (Fig. S2 A), for which the threshold defines two sets of clusters (plicate levels for the ID map, GJ versus membrane for the GJ map). By varying the properties of the Gaussian noise and filter, we vary the properties of the resulting maps (Fig. S2, B and C). Importantly, we adjust mesh generation parameters (Table S1) such that the map properties match the corresponding TEM measurements, specifically measurements of plicate region length, and GJ lengths and distributions in the plicate and interplicate regions. In particular, estimating the map generation parameters required comparing the 2-D map properties with the 1-D measurements obtained from TEM images; we made “slices” of the 2-D maps to obtain a series of 1-D length measurements along each slice to directly compare model and experimental measurements (illustrated in Fig. S3). Additionally, the random nature of the algorithm is a key feature of the mesh generation and overall study, as this enables the generation of multiple IDs with comparable and statistically similar overall properties and allows us to account for experimental variability in ID structure.
Figure 2.
Outline of FEM mesh generation algorithm. The ID map defines two levels of plicate regions, such that the interplicate region mesh is defined by the region separating the two levels. The cell–cell junction distribution determines a GJ map for both plicate and interplicate regions, which defines the locations of the two membranes connecting. A 2-D sine wave function replicates the folds in the plicate membranes. A series of connecting meshes join the plicate and the interplicate region membranes, ensuring that the full mesh encloses a continuous volume (i.e., the mesh is “waterproof”). Combining all of these mesh components generates the cleft mesh.
Figure S2.
Map generation algorithm and GJ distribution calculations.(A) Maps are generated by drawing a 2-D array of Gaussian random noise (left). The noise is then smoothed (center) and thresholded (right) to generate a map (for either the ID or GJ distribution). (B) Plicate and interplicate GJ distributions. Left: GJ cluster examples, illustrating GJs (yellow) and membrane (blue). Right: Cluster size distributions for the plicate and interplicate regions. (C) Parameter study for GJ map algorithm parameters (μ and σ, see supplemental text at the bottom of the PDF for details), illustrating the parameter dependence of cluster membrane area fractions, median cluster area, and mean cluster area. The red + and X denote the plicate and interplicate distribution parameters, respectively.
Figure S3.
Fitting cluster length measurements to 2-D maps. In both left panels, each of the red lines represent a slice, or a 1-D sample, of the 2-D map, with the associated 1-D slices plotted on the right. (A) GJ length measurements are obtained by averaging the length of all continuous GJ segments over all slices (yellow, value of 1). (B) Plicate length measurements are obtained by averaging the length of all continuous plicate segments over all slices, from both levels (blue or yellow, h = 0 or 1).
Finite element mesh construction
After generating maps of the individual ID structures fit to TEM measurements, we next generate the finite element mesh, which is comprised of plicate regions, interplicate regions, and small connections between these regions (Fig. 2). Each plicate and interplicate mesh is initially defined by two rectangular surfaces, which represent the two apposing cell membranes, and then is populated by GJs, with distribution specific to that ID region and determined independently. As GJs mediate direct electrical communication between cells, at the location of GJs, the two apposing cell membranes connect, which appear as “holes” in the mesh (Fig. 1, C–E). Additionally, the distance between the two membranes is defined, based on TEM measurements, denoted as dP for the plicate region and dIp for the interplicate region. Importantly, we note that these two distances can be independently varied.
We next transform the individual mesh components into the shape of the ID. The plicate meshes are cropped into the shapes of the individual levels, determined by the ID map, and further are also folded using the shape of a 2-D sine wave, to match the amplitude and frequency of the plicate folds (Fig. 1, C–E). The interplicate region meshes are rectangles, with lengths that match the contours of the plicate region levels and heights determined by the TEM measurements of interplicate region length. The interplicate meshes are then curved and rotated to be positioned between the corresponding plicate region meshes. Small mesh pieces then join all adjacent plicate and interplicate regions. This complete mesh represents the two apposing cell membranes. The mesh is then checked and repaired using the meshfix algorithm (Attene, 2010), ensuring that the surfaces completely enclose a volume, representing the intercellular cleft. Finally, we use Gmsh, finite element mesh generation software (Geuzaine and Remacle, 2009), to generate a 3-D tetrahedral mesh of the intercellular cleft space.
Intercellular cleft conductance measurement
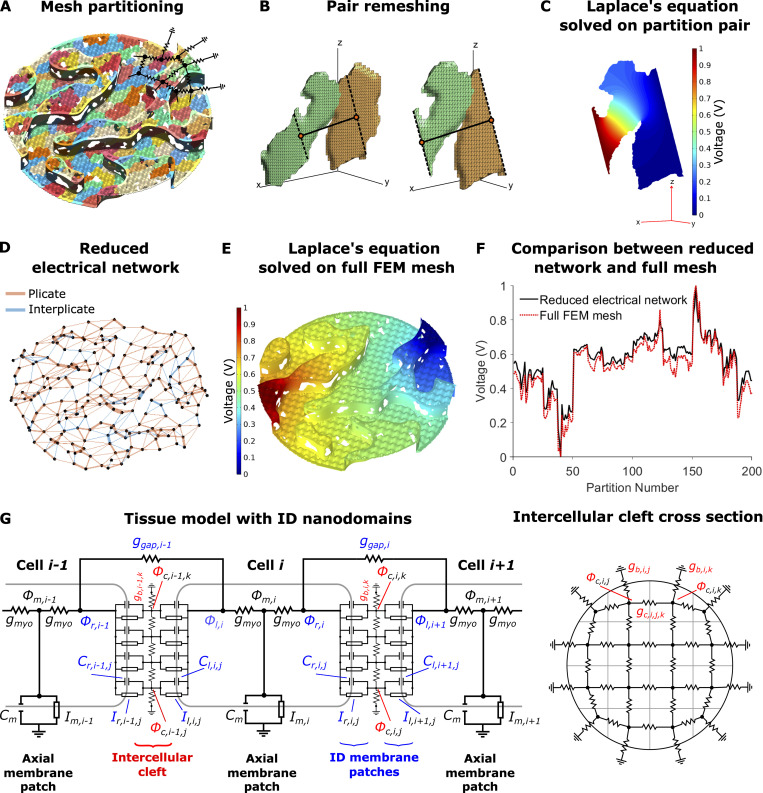
We next developed an approach to reduce the full 3-D finite element mesh of the intercellular cleft space to an equivalent electrical network (Fig. S1, right). Network connections represent the electrical conductivity between adjacent regions in the intercellular cleft and are calculated by solving the full electrostatics problem on each pair of adjacent cleft compartments. This simplification facilitates incorporating the reduced cleft network into a cardiac tissue model, thus integrating the nanoscale detail of the ID into a tissue-scale model (Fig. 3). The finite element mesh is first divided into M compartments, where M is a tractable number between 25–200, using the Metis partitioning algorithm (Karypis and Kumar, 1998) in Gmsh, which generates partitions of approximately equal volume and well-behaved boundaries (Fig. 3 A). We next calculate the centroid of each compartment, which represent the location of the cleft network nodes (Fig. 3, D and G, right). For each pair of adjacent compartments (j and k), we cut (dashed lines) and generate a new finite element mesh of the shared volume between the two centroids (Fig. 3 B). To calculate an equivalent conductance between the adjacent nodes, we solve the full 3-D electrostatics problem on this new mesh using the finite element solver in Matlab (Mathworks); specifically we solve Laplace’s equation for electrical potential (Fig. 3 C), given by the following partial differential equation:
| (1) |
where V(x,y,z) is the electrical potential on the shared volume mesh, and Ω is the domain of the shared volume. The boundary conditions are defined such that V = Vfem on one of the cut surfaces running through a centroid (dashed line in Fig. 3 B), and V = 0 on the other cut surface. Using the numerically calculated potential V, we next calculate the total current between the two boundaries through the mesh, Ifem, given by the following surface integral over one of the cut boundaries,
| (2) |
where is the electrical field, ρext is the resistivity of the extracellular cleft space, and S is one of the cut surfaces on the boundary. Numerically, we calculate this integral by summing over all N triangular finite element faces on the boundary S,
| (3) |
where is the electrical potential gradient, averaged over the 3 vertices of the lth element face, is the unit vector normal or perpendicular to lth element face, and Al is the lth element face area. We note that since Laplace’s equation is linear, the conductance value calculations do not depend on which boundary surface is used for the current calculation or the value of Vfem. Thus, for simplicity, we set Vfem = 1 V.
Figure 3.
Intercellular cleft conductivity and tissue model with ID nanodomains.(A) Partitioning of the FEM mesh into 200 partitions or compartments, with different colors denoting different compartments. Overlaid on the mesh is a partial sketch of the reduced electrical network. (B) Example of adjacent partitions remeshing for equivalent conductance calculation. Partition centroids (orange circles), connecting line (solid black line), and cut lines (dashed black lines) are shown. (C) Solution to Laplace’s equation (Eq. 1) on the shared volume. (D) Resulting reduced electrical network for 200 nodes and the corresponding connections between adjacent partitions. Connection thickness is proportional to the conductance value, and edges in plicate or interplicate regions are shown as orange and blue, respectively. (E) Solution to Laplace’s equation on the full-cleft FEM mesh. (F) Comparison between voltages on the full-cleft FEM mesh and reduced network results. (G) Schematic of the electrical circuit (Eq. S2) and illustration of the corresponding electrical network at the ID, equivalent to the network shown in D.
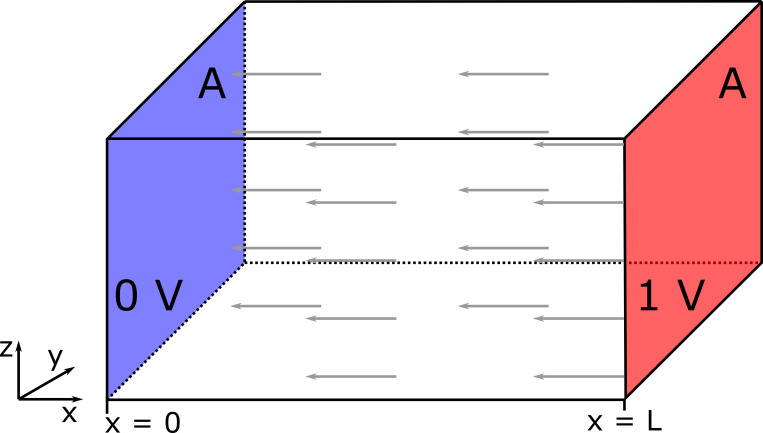
Finally, the equivalent conductance between cleft compartments j and k (gc,i,j,k), for the cleft between cells i and i + 1, is calculated by dividing the total current through the mesh, by the voltage difference across the mesh, i.e., gc,i,j,k = Ifem/Vfem. Supplemental text at the bottom of the PDF illustrates this equivalent conductance calculation in a regular rectangular geometry, resulting in the established relationship between electrical conductance, geometry, and electrical resistivity (Fig. S4). We repeat this calculation over all pairs of adjacent compartments in the intracellular cleft to obtain the intracleft conductances gc,i,j,k for all combinations of j, k = 1,…, M and j ≠ k. By definition, gc,i,j,k = 0 for nonadjacent compartments and gc,i,j,j = 0. Additionally, for all compartments on the ID periphery, we calculate the effective conductance between cleft compartment and the bulk extracellular space (gb,i,j) using a similar procedure, replacing the second compartment centroid with the center of the compartment-ID boundary; for all compartments not adjacent to the bulk, gb,i,j = 0.
Figure S4.
Illustration of Laplace’s equation on a regular geometry and uniform material. The problem has two Dirichlet (fixed) boundary conditions on apposing faces, with area A and separated by distance L: 0 V on the left face (highlighted in blue) and 1 V on the right face (red). All other boundaries have no-flux conditions. The gray arrows represent the direction of the electric field or current flux.
We investigate the dependence of the cleft conductance measurements on intermembrane separation by repeating the mesh generation and cleft conductance measurements for different values of dP and dIp. Additionally, we perform this process five times to replicate the experimental variability in ID and cleft properties. We also investigate the influence of ID structures by measuring cleft conductances in the absence of either GJs or plicate folds.
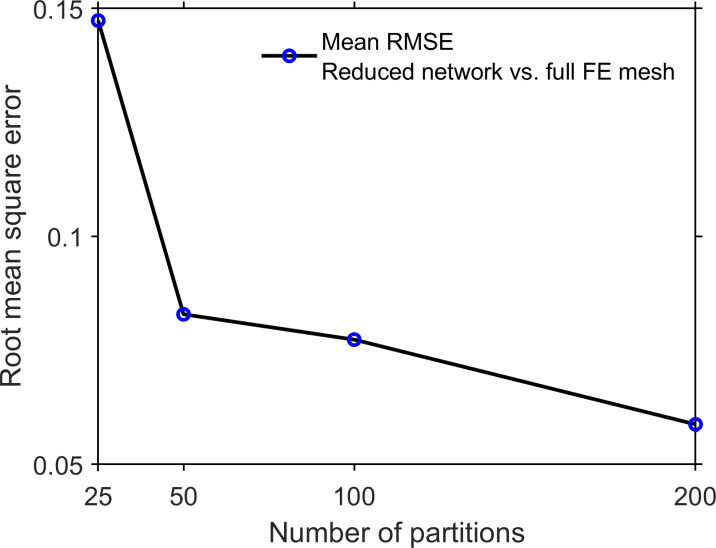
The resulting electrical network is formed by nodes representing the average electrical potential of the compartment and edges representing intracleft electrical conductance (Fig. 3 D). We validate this approach by comparing the electrical potential on the reduced cleft electrical network and the corresponding full 3-D cleft finite element mesh (calculated in finite element solver COMSOL). We note that the reduced cleft network represents a significant computational reduction: solving for the 3-D cleft potential requires solving Laplace’s equation on the entire cleft finite element mesh, comprising ∼300,000 finite element tetrahedra (Fig. 3 E), ∼1 min of computational time, while solving for the cleft potential on the reduced cleft network requires solving an M-dimensional linear system, obtained from applying Kirchoff’s current law to the network circuit, requiring <1 s of computational time. Fig. 3 F illustrates the close comparison of the voltage of the cleft network nodes and the corresponding average partition voltage, for all partitions. In the supplemental text, Iteration we quantify the RMSD between the cleft network and cleft finite element solution, and we found that increasing the number of partitions M reduced the error (Fig. S5). Importantly, for ≥50 partitions, we found that the error for the reduced cleft network potential is <10%.
Figure S5.
Error of the cleft network approximation of the Laplace’s equation solution on the full 3-D cleft FEM mesh. The RMSD between the voltage from the cleft network and 3-D FEM mesh is shown as a function of the number of partitions (see also Fig. 3, D–F). Each data point is the mean ± SEM of five different reduced cleft network/FEM mesh comparisons.
Cleft network tissue model with ID nanodomains
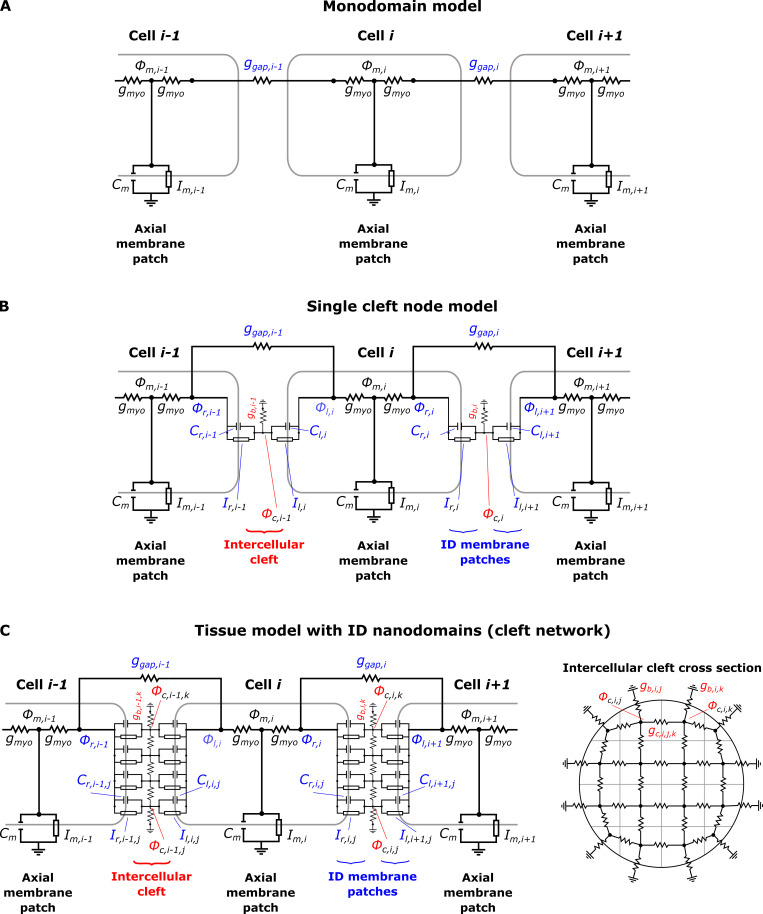
We next developed a novel cardiac tissue model formulation that incorporates the reduced cleft network, thus integrating the effects of ID nanoscale structure into a tissue-scale model. Full details of the cardiac tissue model are provided in the supplemental text, including equations, parameters, and numerical methods. In brief, we simulate a 50-cell cable of ventricular myocytes, with membrane patch dynamics governed by the Luo-Rudy 1 model (Luo and Rudy, 1991). As in our prior work (Weinberg, 2017; Greer-Short et al., 2017; Nowak et al., 2020; Nowak et al., 2021) and work by others (Tsumoto et al., 2020; Kucera et al., 2002; Lin and Keener, 2010; Veeraraghavan et al., 2015; Wei et al., 2016; Wei and Tolkacheva, 2020), we account for nonuniform Na+ subcellular localization by spatially discretizing each cell into axial membrane patches along the lateral membrane and ID membrane patches at site of the cell–cell junctions. In contrast with prior work in which each ID membrane was represented by a single membrane patch, in this study, each ID is discretized into M membrane patches (Fig. 3 G). The extracellular side of each ID membrane patch, representing the intercellular cleft space, is coupled via the reduced cleft electrical network (Fig. 3, D and G, right), as described above. That is, the jth and kth cleft potentials between the ith and i+1th cell (ϕc,i,j and ϕc,i,k, respectively) are coupled with conductance gc,i,j,k. This critical modification incorporates the ID nanoscale structure into the macroscale tissue model.
The intracellular electrical potential (ϕm,i) in each cell is coupled to the pre- and postjunctional intracellular potentials (ϕr,i and ϕl,i, referring to right and left potentials, respectively) with conductance gmyo. In addition to ephaptic coupling via the shared intercellular cleft, pre- and postjunctional intracellular potentials (ϕr,i and ϕl,i+1, respectively) are coupled by a GJ conductance ggap,i. Note that the finite element mesh generates the spatial location of individual GJ clusters, such that the tissue model can represent these distinct electrical connections between the pre- and postjunctional intracellular spaces. However, all of the GJ resistors are connected in parallel, such that the overall GJ conductance between neighboring cells can be represented by a single resistor, with conductance equal to the sum of the individual GJ cluster conductances (i.e., the macroscopic GJ conductance). We also note that while in general the cleft conductances (gc,i,j,k) could differ between different clefts, we assume these values are the same throughout the tissue, i.e., Similarly we assume the same GJ conductance between all adjacent cells, i.e., ggap,i = ggap.
We account for the dynamic [Na+] in each of the intercellular cleft compartments ([Na+]c,j), where [Na+]c,j in the jth cleft compartment is governed by the Na+ current in the jth pre- and postjunctional ID membrane patch, and ionic flux between adjacent compartments (and the bulk, for periphery compartments). The ionic flux between cleft compartments is governed by the electrochemical gradient, i.e., the cleft potential and ionic concentration differences between the adjacent compartments.
We perform simulations with the cleft network tissue model using the cleft conductances obtained from the finite element meshes for different intermembrane separation values. We also vary GJ coupling levels, i.e., values of ggap. For comparison with the cleft network model, we also perform simulations with a single-cleft tissue model, the typical approach of prior studies of ephaptic coupling that neglects ID structural heterogeneity (Kucera et al., 2002; Weinberg, 2017; Lin and Keener, 2010), and also with the standard monodomain tissue model formulation, which does not account for the ID, intercellular cleft space, or nonuniform Na+ channel distribution (Fig. S6). For all the tissue simulations, we pace the leftmost cell (cell 1) at a cycle length of 500 ms. CV was computed by linear regression of the activation times of the intracellular potential of cells 15–35, where the activation time is defined as the time when ϕm crosses above −60 mV.
Figure S6.
Schematic of the electrical circuits for the tissue models compared in the study.(A) Standard monodomain model; the cells are directly connected through the GJ resistor ggap. (B) Single-cleft model: In addition to GJ coupling, a single intercellular cleft node mediated ephaptic coupling between adjacent cells at the ID. (C) The extracellular/intercellular cleft space is modeled as a network of nodes, coupled via electrical resistors with conductance values derived from a FEM mesh (Fig. 3).
Online supplemental material
Fig. S1 illustrates mesh generation and cleft conductance calculation algorithms. Fig. S2 shows map generation algorithm and GJ distribution calculations. Fig. S3 shows the fitting of cluster length measurements to 2-D maps. Fig. S4 illustrates Laplace’s equation on a regular geometry and uniform material. Fig. S5 shows the error of the cleft network approximation of the Laplace’s equation solution on the full 3-D cleft FEM mesh. Fig. S6 is a schematic of the electrical circuits for the tissue models compared in the study. Fig. S7 shows interplicate and plicate region conductances for different FEM mesh variants. Fig. S8 shows examples of FEM mesh variants used in the calculations in Fig. 4. Fig. S9 shows mesh incorporating larger GJs at the ID edge. Table S1 lists parameters for cleft FEM mesh generation. Table S2 lists key parameters and values in the cleft network tissue model. Supplemental text at the bottom of the PDF provides full details of the mesh map generation.
Figure S7.
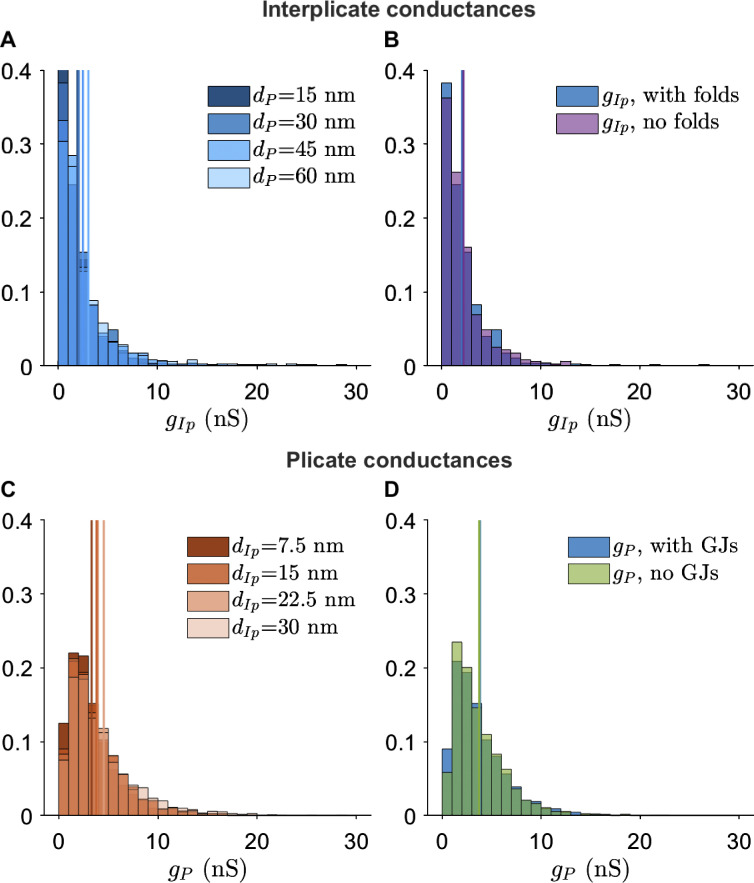
Interplicate and plicate region conductances for different FEM mesh variants.(A) Interplicate conductance gIp distribution for varying plicate distances dP. (B) g _ Ip distribution for the presence or absence of plicate folds. (C) Plicate conductance gP distribution for varying interplicate distances dIp. (D) gP distribution for the presence or absence of GJs.
Figure S8.
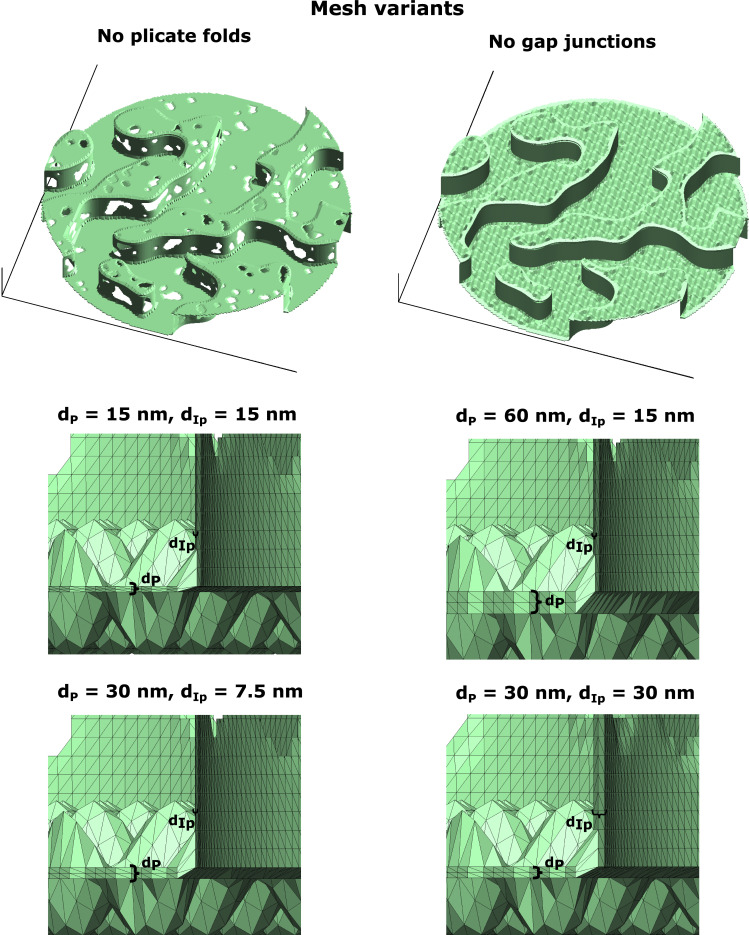
Examples of FEM mesh variants used in the calculations in Fig. 4. Top: FEM meshes with either no plicate folds or GJs. Bottom: Magnified view of FEM meshes with varying plicate and interplicate intermembrane separation distances (dP and dIp, respectively).
Figure 4.
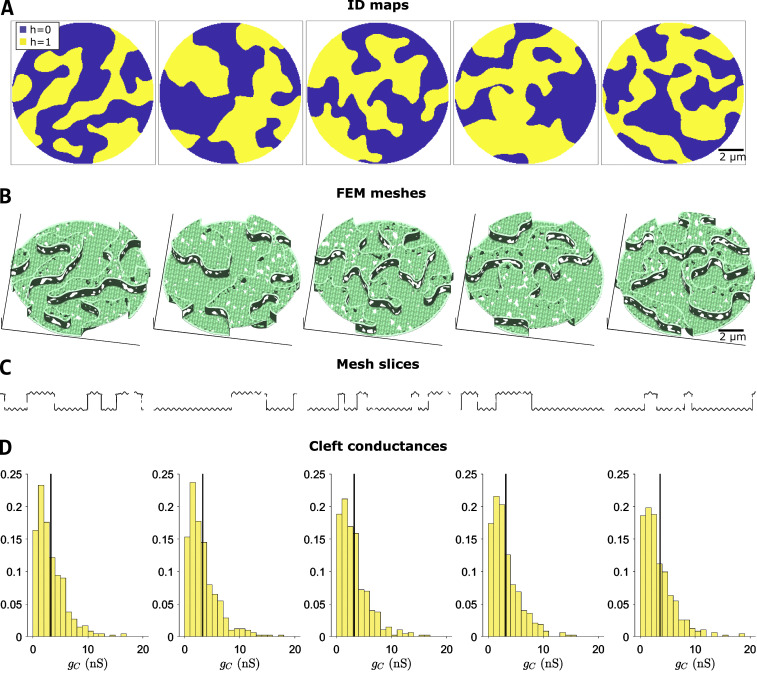
Illustration of multiple-cleft FEM meshes and cleft conductance calculations.(A) Five example ID maps, illustrating variable but similar overall geometries. (B and C) Corresponding FEM meshes (B) and slices through the meshes above (C), illustrating variation in the lengths of plicate and interplicate regions, and GJs. (D) Distribution of cleft conductances (gC) in each mesh, for M = 200 partitions. The black line represents the mean conductance for each mesh. Parameters: plicate membrane distance dP = 30 nm, interplicate membrane distance dIP = 15 nm.
Figure S9.
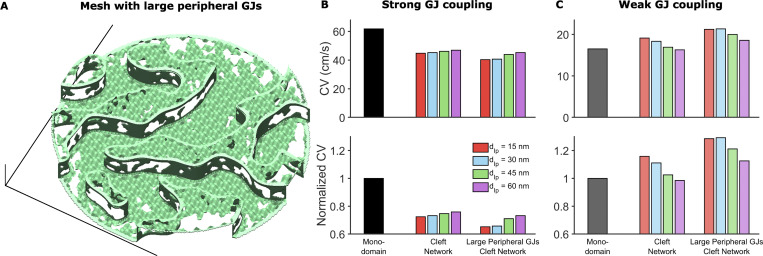
Heterogeneous GJ size distribution can impact cardiac conduction.(A) Example of mesh incorporating larger GJs at the ID edge. The distribution of these larger GJs was defined as occupying the peripheral 10% of the ID and having an average GJ length and fraction of membrane occupied as 50% greater than baseline values in the interplicate region. (B) CV in the tissue model incorporating meshes with larger GJs at ID edges, compared with the monodomain and baseline cleft network model, in the case of strong GJ coupling. The large GJs at the edge slow conduction compared with the regular mesh. (C) In contrast, in the case of weak GJ coupling, CV is increased in tissue with IDs incorporating larger peripheral GJs. Both effects arise because the larger GJs at ID edges reduce conductance to the extracellular bulk space, thus amplifying ephaptic coupling effects, which slow conduction for strong GJ coupling and enhance conduction for weak GJ coupling.
Results
ID structural properties
Representative TEM images illustrate the interplicate and plicate regions of the ID (Fig. 1 B) and plicate folds, GJs, and intermembrane distance in the plicate and interplicate regions (Fig. 1 E). Summary measurements of the key ID structures used to generate the finite element meshes are shown in Table 1. In particular, we find several key differences between the plicate and interplicate regions. GJ length is longer and GJs comprise a larger percentage of the cell membrane in the interplicate, compared with the plicate. Intermembrane separation is narrower in the interplicate regions, compared with the plicate, consistent with our recent measurements in atria (Mezache et al., 2020). Our measurements of plicate fold amplitude are comparable with recent studies as well (Vanslembrouck et al., 2018; Vanslembrouck and Kremer, 2020). Additionally, we find that plicate regions tend to be longer than interplicate, although not significantly.
Table 1. Summary of TEM measurements of ID structures.
| Mean Standard Error (N) (Quartile range, Q1–Q3) | Baseline value for model fit (Range investigated) | |||||
|---|---|---|---|---|---|---|
| TEM measurement | Plicate | Interplicate | ID | |||
| Diameter (μm) | 9.83 ± 0.49 (53) (7.84–11.50) | 11.0 | ||||
| Region length (μm) | 1.76 ± 0.09 (207) (0.77–2.39) | 2.0 | 1.54 ± 0.08 (131) (0.90–2.01) | 1.0 | ||
| GJ length (μm)a | 0.21 ± 0.022 (48) (0.13–0.24) | 0.27 | 0.51 ± 0.034 (135) (0.26–0.63) | 0.52 | ||
| Intermembrane distance (nm)a | 17.25 ± 0.52 (154) (12.30–20.72) | 30b (15–60) | 14.16 ± 0.55 (91) (10.14–17.53) | 15 (7.5–60) | ||
| GJ membrane fraction (%)a | 11.05 ± 1.74 (16) (5.34–16.87) | 12 | 46.15 ± 2.55 (64) (29.82–62.61) | 45 | ||
| Fold frequency (folds/µm) | 2.51 ± 0.08 (92) (1.92–3.02) | 2.50 | ||||
| Fold amplitude (μm) | 0.17 ± 0.0070 (109) (0.12–0.22) | 0.18 | ||||
Data are pooled from images of 3 mouse hearts, 51 IDs (for intermembrane distance), and 76 IDs (for all other measurements).
Statistically significant differences (P < 0.01) between plicate and interplicate measurements.
Baseline model value for the plicate intermembrane separation parameter was based on our earlier work in atria (Veeraraghavan et al., 2018; Mezache et al., 2020).
Intercellular cleft conductances
Using the baseline mesh generation parameters obtained from TEM measurements (Table S1), we first demonstrate the generality of the mesh generation process and created five different ID maps and meshes (Fig. 4, A and B). Importantly, each finite element mesh is generated from the same parameters but differs due to randomness inherent in the mesh generation process. Slices through the meshes are visually quite comparable to TEM images but also differ from each other due to differences in the mesh and orientation of the slices, exhibiting differences in plicate and GJ lengths (Fig. 4 C). As described above, we calculate the intracleft conductances between all adjacent cleft compartments for each mesh. We divided each mesh into 200 compartments or partitions, resulting in ∼450 cleft network edges, split between the plicate and interplicate regions. Histograms of the cleft conductances show some small differences between the different meshes (Fig. 4 D); however, overall the cleft conductance distributions are similar, with nearly identical means (black lines).
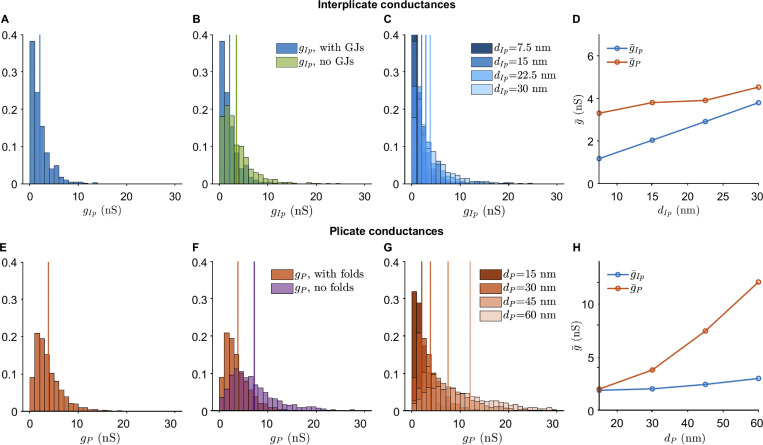
We next investigated the differences between cleft conductances specifically within the interplicate (gIp) and plicate (gP) regions, and then further to what extent different ID properties altered these conductances. Histograms illustrate that conductances in the plicate are typically larger than in the interplicate, with the mean plicate conductance (gP, orange vertical line) almost twice as large as the mean interplicate conductance (gIp, blue vertical line; Fig. 5, A and E). Note that these conductances represent all of the values from the five meshes in Fig. 4. This overall trend is consistent with higher conductance associated with the wider intermembrane separation in the plicate, compared with the interplicate.
Figure 5.
Interplicate and plicate region conductances.(A) Distribution of conductances in the interplicate region (gIp), with values from the five meshes in Fig. 4. (B) Interplicate conductances in the presence and absence of GJs. (C) Interplicate conductance distributions for increasing interplicate intermembrane distance dIP. (D) Mean interplicate conductance (gIp) and mean plicate conductance (gP) are shown as a function of dIp. Note that the blue line values correspond to the vertical lines in C. (E) Distribution of conductances in the plicate region (gP), with values from the five meshes in Fig. 4. (F) Plicate conductances in the presence and absence of plicate folds. (G) Plicate conductance distributions for increasing plicate intermembrane distance dP. (H) gIp and gP are shown as a function of dP. Note that the orange line values correspond to the vertical lines in G. In A–C and E–G, vertical lines denote distribution means. Parameters: A–D, dP = 30 nm; E–H, dIp = 15 nm.
We next investigate to what extent nanoscale ID structures influence cleft conductance, specifically the presence of GJs and plicate folds. We find that GJs decrease conductance in the interplicate (Fig. 5 B), due their high density in this region. Thus, in addition to providing a direct electrical connection between coupled myocytes, GJs also reduce the electrical conductance of the intercellular cleft. In contrast, as GJs are both smaller and rarer in the plicate, the presence of GJs in the plicate minimally influences cleft conductances (Fig. S7 D). We also find that plicate folds greatly decrease plicate conductance (Fig. 5 F), as the folds increase the effective cleft length and thus decrease conductance. As expected, plicate folds do not influence interplicate conductances (Fig. S7 B).
We additionally investigate how changes in intermembrane separation influence the interplicate and plicate conductances. As expected, increasing interplicate intermembrane separation dIp shifts the interplicate conductance histogram to the right (Fig. 5 C), consistent with an overall increase in mean interplicate conductance gIp (Fig. 5 D, blue line). Interestingly, we also observe a small increase in mean plicate conductance gP as dIp increases, due to a few cleft compartments at the interface between interplicate and plicate (Fig. 5 D, orange line). Similarly, we find that increasing plicate intermembrane separation dP shifts the plicate conductance histogram to the right (Fig. 5 G), consistent with an overall increase in mean plicate conductance gP (Fig. 5 H, orange line), with minimal increase in gIp as dP increases (Fig. 5 H, blue line).
Overall, the results show that both intermembrane distance and ID structural features alter local intracleft conductance. Interestingly, calculations also predict that the plicate region is more sensitive to changes in intermembrane separation, compared with the interplicate. In the absence of irregular structure, conductance would be directly proportional to intermembrane separation. However, simulations predict that a 2-fold increase in dP (from 30 to 60 nm) leads to a 3.1-fold increase in gP, while a similar 2-fold increase in dIp (from 15 to 30 nm) leads to a 1.8-fold increase in gIp. Thus, these changes in sensitivity specifically arise due to structural heterogeneities introduced by GJs and plicate folds. Illustrations of the presence/absence of these ID structures and different intermembrane separation are shown in Fig. S8.
ID structure regulation of electrical conduction
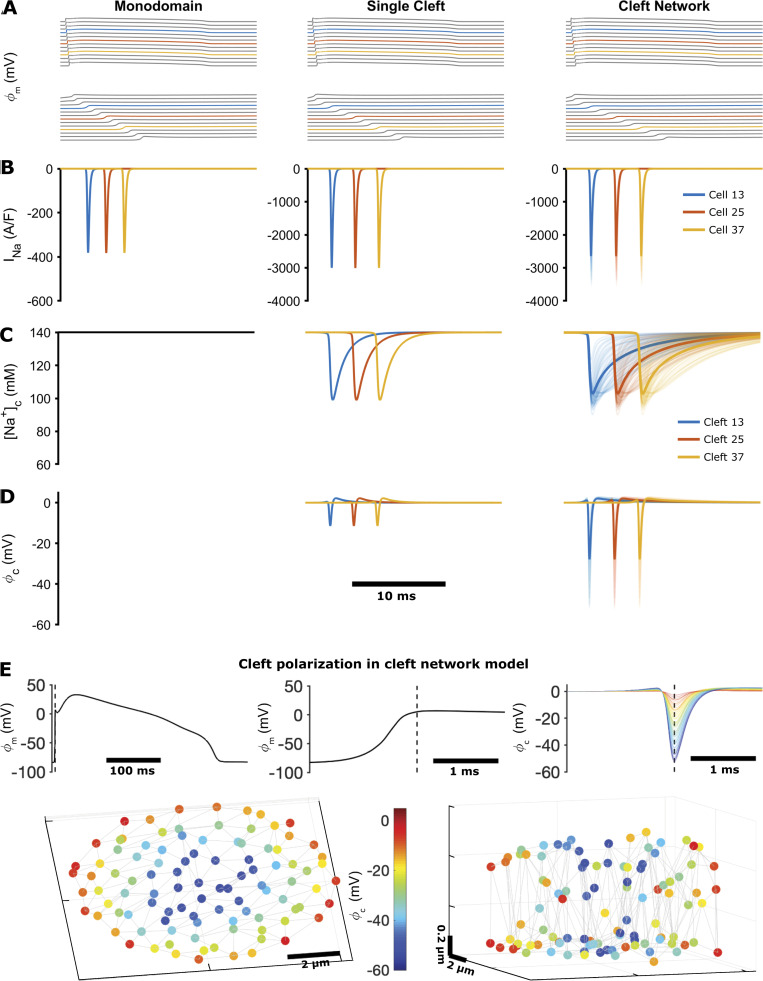
We next investigate how nanoscale ID structure and changes in this structure influence tissue level conduction. We first compared our cleft network model with the standard monodomain model and a single-cleft tissue model (Fig. 6). As expected, the monodomain model illustrates the activation of Na+ current during conduction but does not account for changes in cleft potential and [Na+], as these are not accounted for in the formulation (Fig. 6, left column). Consistent with prior work (Lin and Keener, 2010; Weinberg, 2017; Greer-Short et al., 2017; Veeraraghavan et al., 2015), the single-cleft model illustrates cleft hyperpolarization and a transient depletion of cleft [Na+]; additionally, the Na+ current magnitude at the ID is increased, relative to the monodomain model, due to the preferential localization of Na+ current on the ID membrane (Fig. 6, middle column). In contrast with the single-cleft model, the cleft network model illustrates the heterogeneous ID Na+ currents, cleft [Na+], and cleft potentials during conduction (Fig. 6, right column).
Figure 6.
Simulation of conduction in cardiac tissue models, comparing the monodomain model, the single-cleft model, and the FEM-derived cleft network model.(A) Axial membrane transmembrane potential (ϕm), illustrating a propagating electrical wave (top) and a magnified view of the action potential upstroke (bottom). (B) Na+ current (INa) on the axial membrane (monodomain model) or at the ID (single- and network-cleft models). (C) [Na+] in the intercellular cleft. The monodomain model does not account for dynamic [Na+] or voltage in the cleft. [Na+] values in all cleft compartments are shown for the cleft network model, with the average shown by the thicker line. (D) Cleft potential (ϕc) in the single-cleft and network-cleft models, with all compartment potentials and average (thick lines) shown for the cleft network model. In A–D, colored lines represent cell or cleft 13 (blue), 25 (orange), and 37 (yellow) in the 50-cell tissue. (E) Cleft voltage hyperpolarization in the cleft network model. Top: Axial transmembrane potential ϕm and cleft potential ϕc for cell or cleft 25 are shown, with the dashed line indicating the time of maximum cleft hyperpolarization. Bottom: Color indicates the cleft hyperpolarization at each node in the cleft, with node position indicating the location in the 3-D cleft space (shown from two views). Parameters: single cleft, d = 15 nm; cleft network, M = 100, dP = 30 nm, dIp = 15 nm.
Importantly, we note that the cleft network average (thick lines) differs from the single-cleft model, demonstrating that the single-cleft model does not capture the overall dynamics of ID currents, cleft concentrations, and cleft potentials. Specifically, we find that cleft potentials are hyperpolarized to a greater extent and cleft [Na+] refills slower, compared with the single-cleft model, due to the complicated ID geometry and weaker coupling to the bulk. Both of these changes ultimately reduce Na+ current driving force, such that Na+ current at the ID is also reduced, compared with the single-cleft model. In Fig. 6 E, we illustrate the heterogeneity of cleft polarization during conduction. We find that cleft nodes closer to the ID center are more hyperpolarized than those toward the periphery, due to the low conductance path from the center to the bulk. Further, nodes in the interplicate also tend to be more hyperpolarized than in the plicate, due to lower interplicate conductance (compare Fig. 5, A and E).
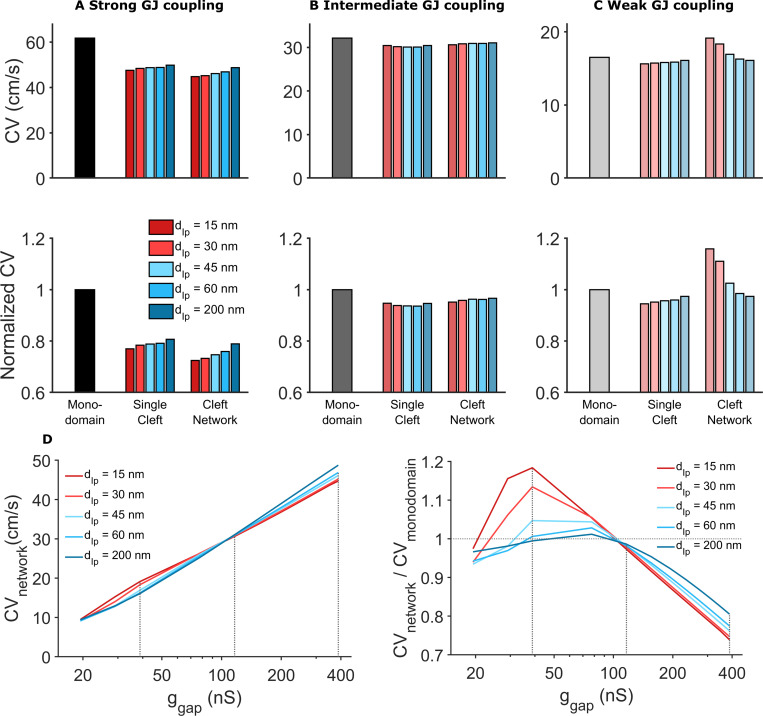
We next investigate to what extent ID structural differences alter CV (Fig. 7). We measured CV in the cleft network models and compared measurements with the standard monodomain tissue model and a tissue model with a single-cleft compartment. Additionally, in the two cleft models, we varied the intermembrane separation for the single-cleft or specifically in the interplicate regions for the cleft network (i.e., varying dIp), for values within a physiological regimen (15–60 nm) and also considered a pathologically disrupted interplicate (200 nm). We varied interplicate intermembrane separation, as opposed to varying intermembrane separation throughout the ID, to investigate the influence of perturbations that target specific regions of the ID. We note that the same ID and GJ maps were used to generate finite element meshes with varying interplicate intermembrane separation. Experimental measurements of macroscopic GJ conductance vary considerably, typically on the order of 10s to 100s of nanosiemens (Desplantez et al., 2007; Kwak and Jongsma, 1996; McCain et al., 2012; Moreno et al., 1994; Valiunas et al., 2002; Verheule et al., 1997; White et al., 1990; Nielsen et al., 2012; Rüdisüli and Weingart, 1989; Weingart, 1986; Wittenberg et al., 1986). Thus, our simulations consider a range of GJ conductances.
Figure 7.
Comparison of CV for different tissue models, intermembrane separation, and GJ coupling strength.(A) Strong GJ coupling: CV in the single-cleft and network models is slower compared with the monodomain model. In the cleft models, CV slightly increased for increased intermembrane separation (in the single-cleft model) and interplicate distance dIp (in the cleft network model). (B) Intermediate GJ coupling: CV is slightly reduced in the cleft models, with minimal dependence on intermembrane separation. (C) Weak GJ coupling: CV is reduced in the single-cleft model but increased in the cleft network model, with different dependence on intermembrane separation. (D) Left: For all dIp values, CV decreases as gap junctional conductance ggap decreases. CV is more sensitive to dIp for either high or low ggap, and CV is less sensitive to ggap for low dIp. Right: Cleft network model CV, normalized to the monodomain CV, is typically >1 for low ggap and <1 for high ggap. This ratio is highly sensitive to dIp for low ggap. Dotted gray lines corresponding to ggap values in A–C. Note the logarithmic scale for the x axis. Parameters: ggap (nS): A, 388; B, 116; C, 38.8; cleft network plicate distance, dP = 30 nm; single cleft intermembrane separation, d = dIp.
We find that for strong GJ coupling, CV was highest in the monodomain model and lowest in the cleft network model (Fig. 7 A). By neglecting the ID and nonuniform channel distribution, the monodomain model overestimates CV by ∼20–30%. The single-cleft model also overestimates CV by ∼10% by neglecting ID structural heterogeneity. For both cleft models, increased intermembrane separation increases CV, to a slightly greater extent in the cleft network model.
For moderate GJ coupling, CV is similar for all three models, although the monodomain model also predicts a slightly faster CV compared with the cleft models (Fig. 7 B). Interestingly, the cleft models predict different trends for increasing intermembrane separation: CV decreases in the single-cleft model and increases in the cleft network model, although these differences are small. Finally, for weak GJ coupling, we find both quantitative and qualitative differences between model predictions (Fig. 7 C). The single-cleft model predicts CV slower than the monodomain model and CV increasing as intermembrane separation increases. In contrast, CV in the cleft network model is ∼20% faster compared with the monodomain model, and CV decreases as interplicate membrane separation increases. Further, the cleft network model is much more sensitive to changes in intermembrane separation, compared with the single-cleft model, as dIp increasing from 15 to 60 nm results in an ∼20% decrease in CV.
In Fig. 7 D, we plot CV as a function of GJ conductance (ggap) for different values of interplicate intermembrane separation (dIp). This plot in particular highlights that CV is most sensitive to GJ conductance for wide interplicate intermembrane separation, while in contrast, CV is least sensitive to GJ conductance for narrow interplicate intermembrane separation. Additionally, we observe that CV is most sensitive to interplicate intermembrane separation for either low or high GJ conductance, with opposite trends as noted above. Further, the cleft network model CV, normalized relative to the CV in the monodomain model, is most sensitive to interplicate intermembrane separation for low GJ conductance, demonstrating the regimen of the greatest ID structural sensitivity and discrepancy with the monodomain model. Additionally, we note that as dIp increases, for all gap junctional coupling strengths, the cleft network model CV tends to be closer to the monodomain model, i.e., the normalized value approaches 1 (dashed horizontal line), demonstrating that weaker ephaptic coupling in the cleft network model (and specifically in the interplicate region) results in conduction closer to the standard monodomain model.
Collectively, these findings show that CV in the cleft network model exhibits a weaker dependence on GJ coupling, in particular for narrow interplicate membrane separation, compared with standard modeling approaches that neglect the ID or assume a homogeneous ID. Further, we find that ID structural heterogeneity can result in enhanced sensitivity to intermembrane separation, compared with the single-cleft modeling approach assuming a homogeneous ID and intercellular cleft.
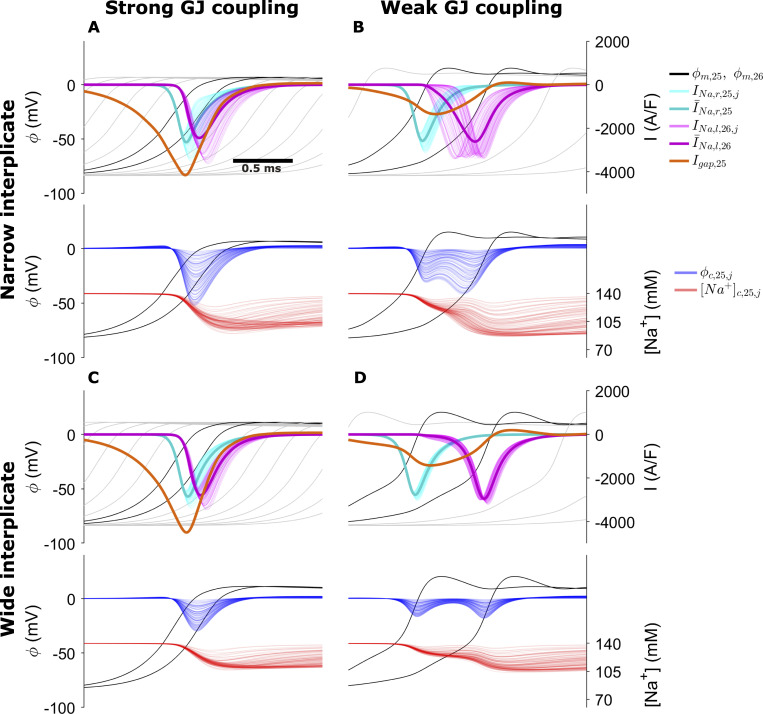
We next investigate the mechanism underlying intermembrane separation sensitivity due to ID structural heterogeneity in the cleft network model. To investigate this sensitivity and the differing responses to interplicate expansion, we consider cleft and membrane dynamics during conduction for four cases (Fig. 8): (1) strong GJ coupling and narrow interplicate, (2) weak GJ coupling and narrow interplicate, (3) strong GJ coupling and expanded interplicate, and (4) weak GJ coupling and expanded interplicate. In all cases, we illustrate the intracellular (black) and cleft potentials (blue), cleft [Na+] (red), GJ current (orange), and the Na+ currents at the prejunctional (cyan) and postjunctional (magenta) membranes, in the middle of the tissue (between cells 25 and 26).
Figure 8.
Membrane and cleft dynamics during electrical conduction in the cleft network model for the following cases.(A) High GJ coupling, narrow interplicate. (B) Weak GJ coupling, narrow interplicate. (C) Strong GJ coupling, wide interplicate. (D) Weak GJ coupling, wide interplicate. Top in each panel: Transmembrane potential ϕm (black, for cells 25 and 26; gray for upstream and downstream cells), cell 25 prejunctional (right, INa, cyan) and cell 26 postjunctional (left, INa, magenta) Na+ current, GJ current (orange). Bottom in each panel: Cleft potential ϕc, and cleft [Na+] for all cleft compartments are shown as a function of time. Dark cyan and magenta curves represent the mean pre- and postjunctional INa, respectively. Parameters: M = 100; plicate distance dP = 30 nm; gap junctional conductance ggap (nS): A and C, 388; B and D, 38.8; interplicate distance dIp (nm): A and B, 15; C and D, 60.
For strong GJ coupling and narrow interplicate (Fig. 8 A), the cleft is hyperpolarized in a highly heterogeneous manner (blue; see also Fig. 6 E), and cleft [Na+] (red) is locally depleted, reducing Na+ current driving force heterogeneously. Collectively, these effects result in desynchronized activation of the postjunctional Na+ currents, with variable current magnitude (magenta), which reduces the overall ID Na+ current density (thick magenta). In contrast, for wider interplicate (Fig. 8 C), cleft hyperpolarization is reduced and cleft depletion is attenuated, such that postjunctional Na+ current is more synchronized and less variable, resulting in a larger ID Na+ current density. Additionally, GJ current magnitude (orange) is greater for the wider interplicate. Collectively, the larger Na+ and GJ current result in a faster upstroke and thus faster CV for the wider interplicate.
For weak GJ coupling (Fig. 8, B and D), in both cases, GJ current is greatly reduced and conduction is slower, compared with strong GJ coupling, as expected. Interestingly, expansion of the interplicate exhibits a behavior similar to the previous case, but with opposite effect on conduction: For narrow interplicate (Fig. 8 B), heterogeneous cleft hyperpolarization and cleft [Na+] depletion similarly result in desynchronized postjunctional Na+ current. However, the larger magnitude of cleft polarization results in both an overall earlier activation and longer duration of postjunctional Na+ current, compared with a wider interplicate (Fig. 8 D), which results in an earlier upstroke and faster conduction for the narrower interplicate. Thus, we find that ID structural heterogeneity plays a significant role in regulating conduction: narrow intermembrane separation promotes desynchronized and varying magnitude postjunctional Na+ current, which slows conduction for strong GJ coupling yet enhances conduction for weak GJ coupling.
Discussion
In this study, we developed an approach to generate realistic FEM meshes of the ID, based on TEM-derived measurements of nano- to microscale structure, which are incorporated into a 1-D tissue model of cardiac conduction. To our knowledge, this is the first study to integrate FEM-based nanoscale structural modeling with a tissue-scale cardiac electrophysiology model. We investigated the effects of ID structure on intracleft conductance on multiple FEM mesh samples. We found that conductance increases with intermembrane distance, with differences between distinct regions (i.e., plicate versus interplicate), and that conductance in interplicate regions is decreased by the nanoscale structure of GJs and associated perinexi (Rhett et al., 2012; Rhett and Gourdie, 2012; Veeraraghavan et al., 2015), while membrane folds have a similar effect in plicate regions.
By incorporating FEM mesh structural data into a tissue model, we demonstrate that changes in regional ID intermembrane distance (i.e., in the interplicate regions) regulate cardiac conduction. In particular, we found that for tissue with strong GJ coupling, interplicate region intermembrane expansion increased CV, while for tissue with weak GJ coupling, the opposite relationship was observed. Importantly, we found that both effects depend on the ID and cleft structural heterogeneity: specifically, heterogeneous cleft hyperpolarization leads to desynchronized activation of the postjunctional Na+ currents. This heterogeneous behavior, for strong GJ coupling, leads to a lower average Na+ current and slower CV. However, in the case of weak GJ coupling, this behavior activates the downstream cell earlier and thus increases CV. More broadly, we find that previous model formulations that neglect ID structural heterogeneity (i.e., the single-cleft model) or the ID entirely (i.e., the monodomain model) can either under- or overestimate predictions of CV. Overall, the cleft network model exhibits a weaker dependence of CV on GJ coupling compared with other modeling approaches. In particular, across a wide range of GJ coupling strengths, we find that CV is less sensitive to GJ coupling for narrower interplicate intermembrane separation, while in contrast, CV sensitivity to GJ coupling is enhanced for wider interplicate intermembrane separation.
Our model predictions demonstrate two critical points with implications for predicting arrhythmia risk in physiological and pathological settings, specifically (a) that incorporating ID structural details into cardiac tissue models can impact conduction predictions (compared with prior approaches), and (b) that perturbations in ID structure (e.g., interplicate intermembrane expansion) can significantly alter conduction. This second point is consistent with prior experimental studies demonstrating that ID disruption can alter conduction and arrhythmia risk. For example, recent work has shown that perinexal structure (interplicate ID) is perturbed in atrial tissue from patients’ atrial fibrillation (Raisch et al., 2018). We also recently showed that vascular leak, induced by inflammatory cytokine vascular endothelial growth factor, disrupts ID nanodomains in both GJ- and MJ-adjacent regions, and ultimately slows conduction and increases susceptibility to arrhythmias (Mezache et al., 2020). We previously showed that disruption of GJ-adjacent perinexi via edema (Veeraraghavan et al., 2012, 2015, 2016; George et al., 2015), inflammation (George et al., 2015), or adhesion-disrupting peptides targeting the Na+ channel subunit (Veeraraghavan et al., 2018) can also slow conduction. In agreement with the majority of GJs residing in the interplicate regions, these conduction-slowing trends are consistent with our findings in the setting of weaker GJ coupling and interplicate expansion (Fig. 7 C). We speculate that differences between experiments and simulations for cases of stronger GJ coupling may arise due to the lack of accounting for intracleft clustering of Na+ channels at GJ-adjacent perinexi (Veeraraghavan et al., 2018; Veeraraghavan et al., 2015; Veeraraghavan and Gourdie, 2016) and MJ-associated nanodomains (Leo-Macias et al., 2016; Mezache et al., 2020) within the different ID regions (Rhett et al., 2012; Veeraraghavan et al., 2015). Incorporating these details is a focus of future work.
We note that the differences between our modeling approach incorporating ID structure and the standard monodomain model over a wide range of GJ coupling strengths counters the argument that gap junctional coupling is solely governing conduction in one regimen, while ephaptic coupling is solely governing conduction in another regimen. Our results suggest that the relationship between these forms of coupling is more nuanced, in the sense that neither is a “switch” that is turned on or off for certain conditions, but rather both mechanisms operate in tandem to maintain robust conduction under different conditions. Specifically, for strong GJ coupling, ephaptic coupling tends to slow conduction, however with relatively weak sensitivity. In contrast, for weaker GJ coupling, ephaptic coupling tends to enhance conduction with greater sensitivity. Similarly, for strong ephaptic coupling, conduction is less sensitive to GJ coupling, while for weak ephaptic coupling, conduction is more sensitive to GJ coupling. Importantly, the relative roles of these forms of coupling are interconnected and dependent.
As noted above, experimental measurements of macroscopic GJ conductance under physiological conditions vary considerably, typically on the order of 10s to 100s of nanosiemens (Desplantez et al., 2007; Kwak and Jongsma, 1996; McCain et al., 2012; Moreno et al., 1994; Valiunas et al., 2002; Verheule et al., 1997; White et al., 1990; Nielsen et al., 2012; Rüdisüli and Weingart, 1989; Weingart, 1986; Wittenberg et al., 1986), such that our simulations for weak GJ coupling correspond with the lower end of this range and those for strong GJ coupling correspond with the upper end of this range. While this variability in measurements may be partially due to differences in species, cell type, and experimental conditions, the individual studies also typically found a wide range in GJ conductance measurements. Additionally, GJ protein expression has been shown to be reduced in the diseased myocardium, in cases of heart failure (Akar et al., 2004, 2007) or myocardial ischemia (Cascio et al., 2005). Collectively, these data suggests that the range of GJ conductance investigated in this study is within a physiologically relevant regimen, with reduced GJ coupling tending to represent more pathological conditions. Our simulation results, particularly for the weak GJ coupling case, may help resolve apparent discrepancies between the time course of GJ remodeling and conduction slowing in the failing heart (Akar et al., 2004, 2007), where edema is known to play a role (Boyle et al., 2007). We therefore expect that CV sensitivity to interplicate intermembrane separation (shown in Fig. 7) is important in modeling these pathologies, especially in a heterogeneously affected tissue. One important direct extension of our current work is to investigate mechanisms of electrical dysfunction in failing hearts. Since we find that interplicate membrane separation has a greater impact on conduction for weaker GJ coupling, our modeling approach should be particularly well suited for modeling pathological cases (such as heart failure or ischemia), for which both GJ coupling and overall ID structure are expected to be perturbed. Importantly, our approach is sufficiently flexible to incorporate ID structural data from failing hearts into FEM and tissue models, and such mechanistic studies are a key focus of future work. The present study is a critical step toward such work, enabling us to develop the necessary imaging, image analysis, and modeling workflows and pipelines.
A number of prior studies quantify ID structure. Our measurements of overall ID size (Bennett et al., 2006; Wilson et al., 2014), intermembrane spacing and GJ cluster size (Severs, 1990), and plicate folds and amplitude (Vanslembrouck and Kremer, 2020) are quite similar to previously published data. In contrast with our approach, other studies have characterized the entire 3-D structure of the ID using 3-D stacking and image segmentation (Leo-Macías et al., 2015; Vanslembrouck et al., 2018; Vanslembrouck and Kremer, 2020). We note that our approach of mesh partitioning and calculating equivalent cleft conductances, which could be then incorporated into the cleft network tissue model, can be applied to a 3-D FEM model based on a 3-D ID reconstruction. However, our approach is more flexible and has a number of specific advantages over a direct 3-D reconstruction. First, we are able to directly modify specific features of the ID mesh geometry, to investigate the role of such features on conduction. A comparable 3-D reconstruction would be required for each experimental case, and as 3-D stacking and segmenting images is quite time-consuming and challenging, this would greatly limit the conditions investigated. Second, our approach can determine ID geometry based on hundreds of images from multiple hearts and IDs, thus accounting for physiological variability, while a 3-D reconstruction provides information only on the specific ID being imaged. Finally, our approach is not limited to TEM images, as we could derive FEM parameters from any imaging modality, provided that there is sufficient resolution to characterize the relevant ID structures.
In a prior modeling study, Hichri et al. (2018) simulated two equally spaced apposing cell membranes, separated by an intercellular cleft space modeled using a uniform FEM mesh. They similarly predicted that cleft potential (ϕc) is variable within the cleft, specifically with larger-magnitude hyperpolarization toward the center (a result also described by Mori et al. [2008] in a 3-D radially symmetric model). This variability in turn drives heterogeneous activation of the postjunctional membrane, similar to our results in Fig. 8, and the authors show that these effects are amplified by both decreased intermembrane distance and Na+ channel clustering. We similarly find that the cleft is more polarized toward the center (Fig. 6). We further predict that the potential distribution is in fact even more variable and heterogeneous due to the irregular structure of the ID meshes and variations in structure that arise due to differences in intermembrane separation in the plicate and interplicate and the presence of GJs and plicate folds. Additionally, our approach to derive an equivalent reduced electrical circuit to represent the cleft conductances eliminates the computationally costly step of simulating electrochemical dynamics on the full 3-D FEM mesh, facilitating simulation of cardiac tissue and predictions of CV.
Interestingly, the mechanism of conduction slowing/enhancing shown in Fig. 8 is similar to the single-cleft model previously predicted by Kucera et al. (2002): for strong GJ coupling, narrow intercellular clefts enhance cleft polarization and thereby reduce Na+ current driving force, which slows conduction, a mechanism described as “self-attenuation.” In contrast, for weak GJ coupling, narrow clefts activate the postjunctional membrane earlier and enhance conduction. Our study builds on this prior work and predicts that cleft heterogeneity also contributes to these mechanisms. Specifically, for strong GJ coupling, self-attenuation and reduced Na+ current also arise due to desynchronized activation of the postjunctional membrane. For weak GJ coupling, narrow clefts enhance cleft polarization heterogeneity that facilitates an overall earlier activation of postjunctional Na+ channels. Additionally, this earlier activation in one region of the postjunctional ID membrane in turn contributes to the activation of additional Na+ channels in other regions, similar to the mechanism of “self-activation” described by Hichri et al. (2018). In addition to illustrating regulation by ID structural heterogeneity, our study illustrates that these mechanisms of conduction regulation can be mediated by intermembrane separation changes in a specific region of the ID, specifically the interplicate. Our ongoing work is investigating how additional ID structural changes impact conduction.
We conclude by acknowledging limitations of our study. Although our model formulation incorporates significant subcellular details in the representation of cardiac tissue, this representation is still a simplification of the complex cardiac tissue structure. Specifically, our tissue model represents a 1-D strand of coupled cells and thus does not account for the 3-D tissue structure of the heart. Importantly, however, our model formulation does represent key subcellular and structural details, specifically nonuniform Na+ channel distribution and ID structure. Further, our approach can modified to account for specific ID structural heterogeneity that is not specifically represented in TEM images. One such example is large GJs that have been identified toward the periphery of the ID (Gourdie et al., 1990, 1991). Although we did not measure these directly in our TEM images, we can investigate their potential role in modulating conduction. To illustrate this approach, we created a FEM mesh with a distribution of larger GJs on the ID periphery (Fig. S9), and interestingly found that these larger GJs reduced connection to the extracellular bulk, and thus amplify the CV sensitivity to changes in intermembrane distance. More broadly, our work can be further extended to incorporate structural details from other imaging modalities, e.g., ion channel clustering within GJ- and MJ-associated nanodomains, as noted above.
Further studies are also needed to investigate the role of additional electrogenic proteins that have been identified to be preferentially localized at the ID, in particular K+ channels (Hong et al., 2012; Veeraraghavan et al., 2015; Vermij et al., 2017); here we focused on the role of Na+ channels and their role in regulating conduction at the ID. Finally, while accounting for the irregular structure of the ID membrane, we assume that the lateral membrane follows an overall cylindrical shape, and prior work has shown that microscale heterogeneity, in particular in cell shape/geometry and GJ protein distribution, can impact conduction delays and lead to heterogeneous conduction (Spach et al., 2000, 2007; Hubbard and Henriquez, 2012). We are interested in how these nano- and microscale heterogeneities can influence each other and impact conduction, in particular in pathological settings and associated structural remodeling. Overall, while these limitations may account for quantitative differences in model predictions, importantly our study demonstrates a novel mechanism in which ID nanoscale structural heterogeneity modulates ID-localized Na+ channels and regulates cardiac conduction.
Supplementary Material
lists parameters for cleft FEM mesh generation.
lists key parameters and values in the cleft network tissue model.
Acknowledgments
David A. Eisner served as editor.
This study was supported by funding from National Institutes of Health grant numbers R01HL138003 (to S.H. Weinberg) and R01HL148736 (to R. Veeraraghavan).
The authors declare no competing financial interests.
Author contributions: N. Moise, H.L. Struckman, R. Veeraraghavan, and S.H. Weinberg designed the research studies. N. Moise and S.H. Weinberg performed the numerical simulations. H.L. Struckman conducted the microscopy experiments. H.L. Struckman and C. Dagher performed image analysis. N. Moise, H.L. Struckman, R. Veeraraghavan, and S.H. Weinberg wrote the manuscript. All authors revised, reviewed, and approved of the final version of the manuscript.
References
- Agullo-Pascual, E., Lin X., Leo-Macias A., Zhang M., Liang F.-X., Li Z., Pfenniger A., Lübkemeier I., Keegan S., Fenyö D., et al. 2014. Super-resolution imaging reveals that loss of the C-terminus of connexin43 limits microtubule plus-end capture and NaV1.5 localization at the intercalated disc. Cardiovasc. Res. 104:371–381. 10.1093/cvr/cvu195 [DOI] [PMC free article] [PubMed] [Google Scholar]
- Akar, F.G., Nass R.D., Hahn S., Cingolani E., Shah M., Hesketh G.G., DiSilvestre D., Tunin R.S., Kass D.A., and Tomaselli G.F.. 2007. Dynamic changes in conduction velocity and gap junction properties during development of pacing-induced heart failure. Am. J. Physiol. Heart Circ. Physiol. 293:H1223–H1230. 10.1152/ajpheart.00079.2007 [DOI] [PubMed] [Google Scholar]
- Akar, F.G., Spragg D.D., Tunin R.S., Kass D.A., and Tomaselli G.F.. 2004. Mechanisms underlying conduction slowing and arrhythmogenesis in nonischemic dilated cardiomyopathy. Circ. Res. 95:717–725. 10.1161/01.RES.0000144125.61927.1c [DOI] [PubMed] [Google Scholar]
- Attene, M.2010. A Lightweight Approach to Repairing Digitized Polygon Meshes. Vis. Comput. 26:1393–1406. 10.1007/s00371-010-0416-3 [DOI] [Google Scholar]
- Bennett, P.M., Maggs A.M., Baines A.J., and Pinder J.C.. 2006. The transitional junction: a new functional subcellular domain at the intercalated disc. Mol. Biol. Cell. 17:2091–2100. 10.1091/mbc.e05-12-1109 [DOI] [PMC free article] [PubMed] [Google Scholar]
- Boyle, A., Maurer M.S., and Sobotka P.A.. 2007. Myocellular and interstitial edema and circulating volume expansion as a cause of morbidity and mortality in heart failure. J. Card. Fail. 13:133–136. 10.1016/j.cardfail.2006.10.015 [DOI] [PubMed] [Google Scholar]
- Cascio, W.E., Yang H., Muller-Borer B.J., and Johnson T.A.. 2005. Ischemia-induced arrhythmia: the role of connexins, gap junctions, and attendant changes in impulse propagation. J. Electrocardiol. 38(4, Suppl):55–59. 10.1016/j.jelectrocard.2005.06.019 [DOI] [PubMed] [Google Scholar]
- Desplantez, T., Dupont E., Severs N.J., and Weingart R.. 2007. Gap junction channels and cardiac impulse propagation. J. Membr. Biol. 218:13–28. 10.1007/s00232-007-9046-8 [DOI] [PubMed] [Google Scholar]
- George, S.A., and Poelzing S.. 2016. Cardiac conduction in isolated hearts of genetically modified mice--Connexin43 and salts. Prog. Biophys. Mol. Biol. 120:189–198. 10.1016/j.pbiomolbio.2015.11.004 [DOI] [PMC free article] [PubMed] [Google Scholar]
- George, S.A., Sciuto K.J., Lin J., Salama M.E., Keener J.P., Gourdie R.G., and Poelzing S.. 2015. Extracellular sodium and potassium levels modulate cardiac conduction in mice heterozygous null for the Connexin43 gene. Pflugers Arch. 467:2287–2297. 10.1007/s00424-015-1698-0 [DOI] [PMC free article] [PubMed] [Google Scholar]
- Geuzaine, C., and Remacle J.-F.. 2009. Gmsh: A 3-d Finite Element Mesh Generator with Built-in Pre-and Post-Processing Facilities. Int. J. Numer. Methods Eng. 79:1309–1331. 10.1002/nme.2579 [DOI] [Google Scholar]
- Gourdie, R.G., Green C.R., and Severs N.J.. 1991. Gap junction distribution in adult mammalian myocardium revealed by an anti-peptide antibody and laser scanning confocal microscopy. J. Cell Sci. 99:41–55. 10.1242/jcs.99.1.41 [DOI] [PubMed] [Google Scholar]
- Gourdie, R.G., Harfst E., Severs N.J., and Green C.R.. 1990. Cardiac gap junctions in rat ventricle: localization using site-directed antibodies and laser scanning confocal microscopy. Cardioscience. 1:75–82. [PubMed] [Google Scholar]
- Greer-Short, A., George S.A., Poelzing S., and Weinberg S.H.. 2017. Revealing the Concealed Nature of Long-QT Type 3 Syndrome. Circ. Arrhythm. Electrophysiol. 10:e004400. 10.1161/CIRCEP.116.004400 [DOI] [PMC free article] [PubMed] [Google Scholar]
- Hichri, E., Abriel H., and Kucera J.P.. 2018. Distribution of cardiac sodium channels in clusters potentiates ephaptic interactions in the intercalated disc. J. Physiol. 596:563–589. 10.1113/JP275351 [DOI] [PMC free article] [PubMed] [Google Scholar]
- Hong, M., Bao L., Kefaloyianni E., Agullo-Pascual E., Chkourko H., Foster M., Taskin E., Zhandre M., Reid D.A., Rothenberg E., et al. 2012. Heterogeneity of ATP-sensitive K+ channels in cardiac myocytes: enrichment at the intercalated disk. J. Biol. Chem. 287:41258–41267. 10.1074/jbc.M112.412122 [DOI] [PMC free article] [PubMed] [Google Scholar]
- Hubbard, M.L., and Henriquez C.S.. 2012. Microscopic variations in interstitial and intracellular structure modulate the distribution of conduction delays and block in cardiac tissue with source-load mismatch. Europace. 14(Suppl 5):v3–v9. 10.1093/europace/eus267 [DOI] [PMC free article] [PubMed] [Google Scholar]
- Karypis, G., and Kumar V.. 1998. A Fast and High Quality Multilevel Scheme for Partitioning Irregular Graphs. SIAM J. Sci. Comput. 20:359–392. 10.1137/S1064827595287997 [DOI] [Google Scholar]
- Kucera, J.P., Rohr S., and Rudy Y.. 2002. Localization of sodium channels in intercalated disks modulates cardiac conduction. Circ. Res. 91:1176–1182. 10.1161/01.RES.0000046237.54156.0A [DOI] [PMC free article] [PubMed] [Google Scholar]
- Kwak, B.R., and Jongsma H.J.. 1996. Regulation of cardiac gap junction channel permeability and conductance by several phosphorylating conditions. Mol. Cell. Biochem. 157:93–99. 10.1007/BF00227885 [DOI] [PubMed] [Google Scholar]
- Leo-Macias, A., Agullo-Pascual E., Sanchez-Alonso J.L., Keegan S., Lin X., Arcos T., and Feng-Xia-Liang Y.E.. Korchev, J. Gorelik, D. Fenyö, et al. 2016. Nanoscale visualization of functional adhesion/excitability nodes at the intercalated disc. Nat. Commun. 7:10342. [DOI] [PMC free article] [PubMed]
- Leo-Macías, A., Liang F.-X., and Delmar M.. 2015. Ultrastructure of the intercellular space in adult murine ventricle revealed by quantitative tomographic electron microscopy. Cardiovasc. Res. 107:442–452. 10.1093/cvr/cvv182 [DOI] [PMC free article] [PubMed] [Google Scholar]
- Lin, J., and Keener J.P.. 2010. Modeling electrical activity of myocardial cells incorporating the effects of ephaptic coupling. Proc. Natl. Acad. Sci. USA. 107:20935–20940. 10.1073/pnas.1010154107 [DOI] [PMC free article] [PubMed] [Google Scholar]
- Lin, X., Liu N., Lu J., Zhang J., Anumonwo J.M.B., Isom L.L., Fishman G.I., and Delmar M.. 2011. Subcellular heterogeneity of sodium current properties in adult cardiac ventricular myocytes. Heart Rhythm. 8:1923–1930. 10.1016/j.hrthm.2011.07.016 [DOI] [PMC free article] [PubMed] [Google Scholar]
- Luo, C.H., and Rudy Y.. 1991. A model of the ventricular cardiac action potential. Depolarization, repolarization, and their interaction. Circ. Res. 68:1501–1526. 10.1161/01.RES.68.6.1501 [DOI] [PubMed] [Google Scholar]
- Maier, S.K.G., Westenbroek R.E., McCormick K.A., Curtis R., Scheuer T., and Catterall W.A.. 2004. Distinct subcellular localization of different sodium channel α and β subunits in single ventricular myocytes from mouse heart. Circulation. 109:1421–1427. 10.1161/01.CIR.0000121421.61896.24 [DOI] [PubMed] [Google Scholar]
- McCain, M.L., Desplantez T., Geisse N.A., Rothen-Rutishauser B., Oberer H., Parker K.K., and Kleber A.G.. 2012. Cell-to-cell coupling in engineered pairs of rat ventricular cardiomyocytes: relation between Cx43 immunofluorescence and intercellular electrical conductance. Am. J. Physiol. Heart Circ. Physiol. 302:H443–H450. 10.1152/ajpheart.01218.2010 [DOI] [PMC free article] [PubMed] [Google Scholar]
- Mezache, L., Struckman H.L., Greer-Short A., Baine S., Györke S., Radwański P.B., Hund T.J., and Veeraraghavan R.. 2020. Vascular endothelial growth factor promotes atrial arrhythmias by inducing acute intercalated disk remodeling. Sci. Rep. 10:20463. 10.1038/s41598-020-77562-5 [DOI] [PMC free article] [PubMed] [Google Scholar]
- Miyamoto, T., Zhang L., Sekiguchi A., Hadama T., and Shimada T.. 2002. Structural differences in the cytoarchitecture and intercalated discs between the working myocardium and conduction system in the human heart. Heart Vessels. 16:232–240. 10.1007/s003800200030 [DOI] [PubMed] [Google Scholar]
- Moreno, A.P., Rook M.B., Fishman G.I., and Spray D.C.. 1994. Gap junction channels: distinct voltage-sensitive and -insensitive conductance states. Biophys. J. 67:113–119. 10.1016/S0006-3495(94)80460-6 [DOI] [PMC free article] [PubMed] [Google Scholar]
- Mori, Y., Fishman G.I., and Peskin C.S.. 2008. Ephaptic conduction in a cardiac strand model with 3D electrodiffusion. Proc. Natl. Acad. Sci. USA. 105:6463–6468. 10.1073/pnas.0801089105 [DOI] [PMC free article] [PubMed] [Google Scholar]
- Nielsen, M.S., Axelsen L.N., Sorgen P.L., Verma V., Delmar M., and Holstein-Rathlou N.-H.. 2012. Gap junctions. Compr. Physiol. 2:1981–2035. 10.1002/cphy.c110051 [DOI] [PMC free article] [PubMed] [Google Scholar]
- Nowak, M.B., Greer-Short A., Wan X., Wu X., Deschênes I., Weinberg S.H., and Poelzing S.. 2020. Intercellular Sodium Regulates Repolarization in Cardiac Tissue with Sodium Channel Gain of Function. Biophys. J. 118:2829–2843. 10.1016/j.bpj.2020.04.014 [DOI] [PMC free article] [PubMed] [Google Scholar]
- Nowak, M.B., Poelzing S., and Weinberg S.H.. 2021. Mechanisms underlying age-associated manifestation of cardiac sodium channel gain-of-function. J. Mol. Cell. Cardiol. 153:60–71. 10.1016/j.yjmcc.2020.12.008 [DOI] [PMC free article] [PubMed] [Google Scholar]
- Petitprez, S., Zmoos A.-F., Ogrodnik J., Balse E., Raad N., El-Haou S., Albesa M., Bittihn P., Luther S., Lehnart S.E., et al. 2011. SAP97 and dystrophin macromolecular complexes determine two pools of cardiac sodium channels Nav1.5 in cardiomyocytes. Circ. Res. 108:294–304. 10.1161/CIRCRESAHA.110.228312 [DOI] [PubMed] [Google Scholar]
- Pinali, C., Bennett H.J., Davenport J.B., Caldwell J.L., Starborg T., Trafford A.W., and Kitmitto A.. 2015. Three-dimensional structure of the intercalated disc reveals plicate domain and gap junction remodeling in heart failure. Biophys. J. 108:498–507. 10.1016/j.bpj.2014.12.001 [DOI] [PMC free article] [PubMed] [Google Scholar]
- Radwański, P.B., Johnson C.N., Györke S., and Veeraraghavan R.. 2018. Cardiac Arrhythmias as Manifestations of Nanopathies: An Emerging View. Front. Physiol. 9:1228. 10.3389/fphys.2018.01228 [DOI] [PMC free article] [PubMed] [Google Scholar]
- Raisch, T.B., Yanoff M.S., Larsen T.R., Farooqui M.A., King D.R., Veeraraghavan R., Gourdie R.G., Baker J.W., Arnold W.S., AlMahameed S.T., and Poelzing S.. 2018. Intercalated Disk Extracellular Nanodomain Expansion in Patients With Atrial Fibrillation. Front. Physiol. 9:398. 10.3389/fphys.2018.00398 [DOI] [PMC free article] [PubMed] [Google Scholar]
- Rhett, J.M., and Gourdie R.G.. 2012. The perinexus: a new feature of Cx43 gap junction organization. Heart Rhythm. 9:619–623. 10.1016/j.hrthm.2011.10.003 [DOI] [PMC free article] [PubMed] [Google Scholar]
- Rhett, J.M., Ongstad E.L., Jourdan J., and Gourdie R.G.. 2012. Cx43 associates with Na(v)1.5 in the cardiomyocyte perinexus. J. Membr. Biol. 245:411–422. 10.1007/s00232-012-9465-z [DOI] [PMC free article] [PubMed] [Google Scholar]
- Rüdisüli, A., and Weingart R.. 1989. Electrical properties of gap junction channels in guinea-pig ventricular cell pairs revealed by exposure to heptanol. Pflugers Arch. 415:12–21. 10.1007/BF00373136 [DOI] [PubMed] [Google Scholar]
- Rush, S., and Larsen H.. 1978. A practical algorithm for solving dynamic membrane equations. IEEE Trans. Biomed. Eng. 25:389–392. 10.1109/TBME.1978.326270 [DOI] [PubMed] [Google Scholar]
- Severs, N.J.1990. The cardiac gap junction and intercalated disc. Int. J. Cardiol. 26:137–173. 10.1016/0167-5273(90)90030-9 [DOI] [PubMed] [Google Scholar]
- Shimada, T., Kawazato H., Yasuda A., Ono N., and Sueda K.. 2004. Cytoarchitecture and intercalated disks of the working myocardium and the conduction system in the mammalian heart. Anat. Rec. A Discov. Mol. Cell. Evol. Biol. 280:940–951. 10.1002/ar.a.20109 [DOI] [PubMed] [Google Scholar]
- Spach, M.S., Heidlage J.F., Dolber P.C., and Barr R.C.. 2000. Electrophysiological effects of remodeling cardiac gap junctions and cell size: experimental and model studies of normal cardiac growth. Circ. Res. 86:302–311. 10.1161/01.RES.86.3.302 [DOI] [PubMed] [Google Scholar]
- Spach, M.S., Heidlage J.F., Dolber P.C., and Barr R.C.. 2007. Mechanism of origin of conduction disturbances in aging human atrial bundles: experimental and model study. Heart Rhythm. 4:175–185. 10.1016/j.hrthm.2006.10.023 [DOI] [PMC free article] [PubMed] [Google Scholar]
- Sperelakis, N., and Mann J.E. Jr. 1977. Evaluation of electric field changes in the cleft between excitable cells. J. Theor. Biol. 64:71–96. 10.1016/0022-5193(77)90114-X [DOI] [PubMed] [Google Scholar]
- Sperelakis, N., and Mann J.E. Jr. 2002. An electric field mechanism for transmission of excitation between myocardial cells. Circ. Res. 91:985–987. 10.1161/01.RES.0000045656.34731.6D [DOI] [PubMed] [Google Scholar]
- Tsumoto, K., Ashihara T., Naito N., Shimamoto T., Amano A., Kurata Y., and Kurachi Y.. 2020. Specific decreasing of Na+ channel expression on the lateral membrane of cardiomyocytes causes fatal arrhythmias in Brugada syndrome. Sci. Rep. 10:19964. 10.1038/s41598-020-76681-3 [DOI] [PMC free article] [PubMed] [Google Scholar]
- Tveito, A., Jæger K.H., Kuchta M., Mardal K.-A., and Rognes M.E.. 2017. A Cell-Based Framework for Numerical Modeling of Electrical Conduction in Cardiac Tissue. Front. Phys. 5:48. 10.3389/fphy.2017.00048 [DOI] [Google Scholar]
- Valiunas, V., Beyer E.C., and Brink P.R.. 2002. Cardiac gap junction channels show quantitative differences in selectivity. Circ. Res. 91:104–111. 10.1161/01.RES.0000025638.24255.AA [DOI] [PubMed] [Google Scholar]
- Vanslembrouck, B., Kremer A., Pavie B., van Roy F., Lippens S., and van Hengel J.. 2018. Three-dimensional reconstruction of the intercalated disc including the intercellular junctions by applying volume scanning electron microscopy. Histochem. Cell Biol. 149:479–490. 10.1007/s00418-018-1657-x [DOI] [PubMed] [Google Scholar]
- Vanslembrouck, B., and Kremer A.. F. VAN Roy, S. Lippens, and J. VAN Hengel. 2020. Unravelling the ultrastructural details of αT-catenin-deficient cell-cell contacts between heart muscle cells by the use of FIB-SEM. J. Microsc. 279:189–196. 10.1111/jmi.12855 [DOI] [PubMed]
- Veeraraghavan, R., and Gourdie R.G.. 2016. Stochastic optical reconstruction microscopy-based relative localization analysis (STORM-RLA) for quantitative nanoscale assessment of spatial protein organization. Mol. Biol. Cell. 27:3583–3590. 10.1091/mbc.e16-02-0125 [DOI] [PMC free article] [PubMed] [Google Scholar]
- Veeraraghavan, R., Lin J., Keener J.P., Gourdie R., and Poelzing S.. 2016. Potassium channels in the Cx43 gap junction perinexus modulate ephaptic coupling: an experimental and modeling study. Pflugers Arch. 468:1651–1661. 10.1007/s00424-016-1861-2 [DOI] [PMC free article] [PubMed] [Google Scholar]
- Veeraraghavan, R., Hoeker G.S., Alvarez-Laviada A., Hoagland D., Wan X., King D.R., Sanchez-Alonso J., Chen C., Jourdan J., Isom L.L., et al. 2018. The adhesion function of the sodium channel beta subunit (β1) contributes to cardiac action potential propagation. eLife. 7:e37610. 10.7554/eLife.37610 [DOI] [PMC free article] [PubMed] [Google Scholar]
- Veeraraghavan, R., Lin J., Hoeker G.S., Keener J.P., Gourdie R.G., and Poelzing S.. 2015. Sodium channels in the Cx43 gap junction perinexus may constitute a cardiac ephapse: an experimental and modeling study. Pflugers Arch. 467:2093–2105. 10.1007/s00424-014-1675-z [DOI] [PMC free article] [PubMed] [Google Scholar]
- Veeraraghavan, R., Salama M.E., and Poelzing S.. 2012. Interstitial volume modulates the conduction velocity-gap junction relationship. Am. J. Physiol. Heart Circ. Physiol. 302:H278–H286. 10.1152/ajpheart.00868.2011 [DOI] [PMC free article] [PubMed] [Google Scholar]
- Verheule, S., van Kempen M.J.A., te Welscher P.H.J.A., Kwak B.R., and Jongsma H.J.. 1997. Characterization of gap junction channels in adult rabbit atrial and ventricular myocardium. Circ. Res. 80:673–681. 10.1161/01.RES.80.5.673 [DOI] [PubMed] [Google Scholar]
- Vermij, S.H., Abriel H., and van Veen T.A.B.. 2017. Refining the molecular organization of the cardiac intercalated disc. Cardiovasc. Res. 113:259–275. 10.1093/cvr/cvw259 [DOI] [PubMed] [Google Scholar]
- Wei, N., and Tolkacheva E.G.. 2020. Interplay between ephaptic coupling and complex geometry of border zone during acute myocardial ischemia: Effect on arrhythmogeneity. Chaos. 30:033111. 10.1063/1.5134447 [DOI] [PubMed] [Google Scholar]
- Wei, N., Mori Y., and Tolkacheva E.G.. 2016. The dual effect of ephaptic coupling on cardiac conduction with heterogeneous expression of connexin 43. J. Theor. Biol. 397:103–114. 10.1016/j.jtbi.2016.02.029 [DOI] [PubMed] [Google Scholar]
- Weinberg, S.H.2017. Ephaptic coupling rescues conduction failure in weakly coupled cardiac tissue with voltage-gated gap junctions. Chaos. 27:093908. 10.1063/1.4999602 [DOI] [PubMed] [Google Scholar]
- Weingart, R.1986. Electrical properties of the nexal membrane studied in rat ventricular cell pairs. J. Physiol. 370:267–284. 10.1113/jphysiol.1986.sp015934 [DOI] [PMC free article] [PubMed] [Google Scholar]
- White, R.L., Doeller J.E., Verselis V.K., and Wittenberg B.A.. 1990. Gap junctional conductance between pairs of ventricular myocytes is modulated synergistically by H+ and Ca++. J. Gen. Physiol. 95:1061–1075. 10.1085/jgp.95.6.1061 [DOI] [PMC free article] [PubMed] [Google Scholar]
- Wilson, A.J., Schoenauer R., Ehler E., Agarkova I., and Bennett P.M.. 2014. Cardiomyocyte growth and sarcomerogenesis at the intercalated disc. Cell. Mol. Life Sci. 71:165–181. 10.1007/s00018-013-1374-5 [DOI] [PMC free article] [PubMed] [Google Scholar]
- Wittenberg, B.A., White R.L., Ginzberg R.D., and Spray D.C.. 1986. Effect of calcium on the dissociation of the mature rat heart into individual and paired myocytes: electrical properties of cell pairs. Circ. Res. 59:143–150. 10.1161/01.RES.59.2.143 [DOI] [PubMed] [Google Scholar]
- Zhang, L., Ina K., Kitamura H., Campbell G.R., and Shimada T.. 1996. The intercalated disc of monkey myocardial cells and Purkinje fibers as revealed by scanning electron microscopy. Arch. Histol. Cytol. 59:453–465. 10.1679/aohc.59.453 [DOI] [PubMed] [Google Scholar]
Associated Data
This section collects any data citations, data availability statements, or supplementary materials included in this article.
Supplementary Materials
lists parameters for cleft FEM mesh generation.
lists key parameters and values in the cleft network tissue model.


