

Abstract
In embryonic growth cartilage, Indian hedgehog (Ihh) and parathyroid hormone-related protein (PTHrP) participate in a negative feedback loop that regulates chondrocyte differentiation. Postnatally, this region undergoes major structural and functional changes. To explore the organization of the Ihh–PTHrP system in postnatal growth plate, we microdissected growth plates of 7-day-old rats into their constituent zones and assessed expression of genes participating in the Ihh–PTHrP feedback loop. Ihh, Patched 1, Smoothened, Gli1, Gli2, Gli3, and Pthr1 were expressed in regions analogous to the expression domains in embryonic growth cartilage. However, PTHrP was expressed in resting zone cartilage, a site that differs from the embryonic source, the periarticular cells. We then used mice in which lacZ has replaced coding sequences of Gli1 and thus serves as a marker for active hedgehog signaling. At 1, 4, 8, and 12 weeks of age, lacZ expression was detected in a pattern analogous to that of embryonic cartilage. The findings support the hypothesis that the embryonic Ihh–PTHrP feedback loop is maintained in the postnatal growth plate except that the source of PTHrP has shifted to a more proximal location in the resting zone.
Introduction
Overall body dimensions of mammals are primarily determined by longitudinal bone growth, which occurs by endochondral ossification. In the embryo, mesenchymal cells proliferate, condense and differentiate into chondrocytes to form cartilage templates. In these templates, primary centers of ossification subsequently develop and expand to convert the central segment into bone tissue, leaving a region of cartilage at each end. The cartilage is organized such that the distal portion of the cartilage contains round, proliferating chondrocytes. More centrally, the proliferating chondrocytes take on a flattened morphology. The flat, proliferating chondrocytes closest to the primary center of ossification cease to proliferate and enlarge as they undergo hypertrophic differentiation. Hypertrophic chondrocytes produce matrix components that calcify as well as factors that attract blood vessels and bone cells to remodel cartilage into bone (Hunziker 1994, van der Eerden et al. 2003, Kronenberg 2003).
One of the key paracrine factors that orchestrate this process is Indian hedgehog (Ihh), a secreted protein that signals through the receptor Patched 1 (Ptch1; Kronenberg 2003). In the absence of ligand binding, Ptch1 represses the activity of Smoothened (Smo). Upon Ihh binding to Ptch1, repression of Smo is released, allowing Smo to inhibit phosphorylation and proteolytic cleavage of the Gli family of transcription factors Gli2 and Gli3. As a result, hedgehog signaling leads to transcriptional activation of multiple genes, including Gli1 (Koziel et al. 2005, Nieuwenhuis & Hui 2005, Gill & Rosenblum 2006).
In embryonic growth cartilage, Ihh is produced primarily by prehypertrophic and hypertrophic chondrocytes and stimulates parathyroid hormone-related protein (PTHrP) production by periarticular chondrocytes at the ends of long bones (Kronenberg 2003). PTHrP, in turn, diffuses into the underlying layer of flat, proliferating chondrocytes. In these cells, PTHrP signals through its receptor, Pthr1, to delay further differentiation along the differentiation program, keeping the cells in the proliferative state (Lee et al. 1996, Schipani et al. 1997, Hirai et al. 2010). When these cells become sufficiently distant from the source of PTHrP due to interstitial growth, they differentiate into prehypertrophic and early hypertrophic chondrocytes, postmitotic cells that express Ihh (Bitgood & McMahon 1995, Chung et al. 2001). Ihh and PTHrP thereby form a feedback loop that controls the site of hypertrophic differentiation and consequently also the length of the proliferative columns (Amizuka et al. 1994, Kronenberg 2006).
In postnatal life, the cartilage in long bones undergoes major structural and functional changes. At the central portion of the epiphysis, a secondary center of ossification forms, separating the epiphyseal cartilage into articular cartilage and the growth plate. The mature growth plate is well organized into three zones: the resting zone, which contains slowly replicating chondrocytes; the proliferative zone, which contains more rapidly replicating, flattened chondrocytes arranged in columns; and the hypertrophic zone, which contains non-proliferating, enlarging chondrocytes also arranged in columns (Hunziker 1994). With increasing age, the postnatal growth plate undergoes a progressive loss of function and structural involution, collective termed growth plate senescence (Baron et al. 1994, Weise et al. 2001, Marino et al. 2008).
The Ihh–PTHrP system has primarily been studied in the embryonic growth cartilage; less is known about its role in the mature, postnatal growth plate. Ihh itself continues to have an important regulatory function; postnatal ablation of Ihh causes loss of the columnar structure and leads to premature vascular invasion and ossification of the growth plate (Maeda et al. 2007). However, it is not clear how the Ihh/PTHrP system is organized postnatally; the sources and sites of action of Ihh and PTHrP have not been clearly established. Some prior findings are consistent with the hypothesis that the Ihh–PTHrP feedback loop is maintained in postnatal life except that, when the secondary center of ossification forms, the source of PTHrP for the growth plate migrates from the periarticular cartilage to the resting zone to remain sufficiently close to PTHrP-responsive cells in the proliferative zone (Vortkamp et al. 1998, Koziel et al. 2005, Chen et al. 2006, Maeda et al. 2007). However, other findings suggest a major reorganization of this system in postnatal life (van der Eerden et al. 2000).
Therefore, we sought to resolve this discrepancy and better define the organization of the Ihh–PTHrP system in the postnatal growth plate using approaches that have not previously been applied to this question. First, we performed a comprehensive expression analysis of the key genes involved in Ihh and PTHrP signaling by microdissecting the growth plate into its constituent zones and then applying two quantitative techniques, microarray analysis and real-time RT-PCR. Secondly, we identified cells showing active Ihh signaling in the postnatal growth plate using a mouse model in which the coding sequences of Gli1 were replaced with lacZ.
Materials and methods
Animal procedures and tissue processing
All animals were maintained and used in accordance with the Guide for the Care and Use of Laboratory Animals (National Research Council 2003) and given standard rodent chow and water ad libitum.
Seven-day-old male Sprague–Dawley rats (Harlan, Indianapolis, IN, USA; n=5 for microarray and a separate set of animals (n=5–7) for real-time RT-PCR) were killed by carbon dioxide inhalation. Proximal tibial epiphyses were rapidly excised, embedded in Tissue-Tek O.C.T. compound (Electron Microscopy Sciences, Hatfield, PA, USA), and stored at −80 °C until subsequent processing for microdissection.
We obtained Swiss Webster mice in which coding sequences of Gli1 were replaced with lacZ (Bai et al. 2002). Because hedgehog signaling stimulates Gli1 transcription, lacZ expression in this mouse indicates activity of the hedgehog pathway. Heterozygous mice were mated with wild-type females (Taconic, Rockville, MD, USA). The presence of the transgene in the offspring was determined by X-gal staining of tail snips at gestational day 16 (E16) or between days 1 and 3 of life. Mice were killed by decapitation at gestational day 16 or 1 week of age, or by carbon dioxide inhalation at 4, 8 or 12 weeks of age. Intact tibiae were collected from fetuses, whereas proximal tibial growth plates were excised from 1-, 4-, 8-, and 12-week-old mice. The samples were fixed in 4% paraformaldehyde at 4 °C (Electron Microscopy Sciences) for 1 h (E16 tibiae) or for 3–4 h (1-, 4-, 8-, and 12-week-old growth plates). Growth plate samples from 4-, 8-, and 12-week-old mice were decalcified in 0.5 M EDTA pH 7.4 (KD Medical, Columbia, MD, USA) for 1 day. Samples were then embedded in Tissue-Tek O.C.T. compound (Sakura Finetek USA, Inc., Torrance CA, USA), frozen in dry ice, and stored at −80 °C until sectioning.
Growth plate microdissection and RNA isolation
Growth plate microdissection was performed as previously described (Nilsson et al. 2007). Briefly, frozen longitudinal sections, 60 μm thick, of proximal tibiae were mounted on Superfrost Plus slides (Fisher Scientific, Chicago, IL, USA). Sections were thawed, fixed in methanol, stained in eosin, dehydrated in ethanol, and placed in xylene at room temperature. Using an inverted microscope, razor blades, and hypodermic needles, growth plate sections were separated into epiphyseal cartilage, resting zone, proliferative zone, proliferative–hypertrophic transition zone, hypertrophic zone, perichondrium, and metaphyseal bone according to cell morphology and orientation. The epiphyseal cartilage sample contained single cells that were round and randomly oriented and did not include the periarticular region. Resting zone cartilage contained predominantly single chondrocytes that were flat and oriented in the same direction as the chondrocytes in the proliferative columns of proliferative zone. To minimize cross contamination between resting zone and proliferative zone, the uppermost part of the proliferative columns and the lowest part of resting zone were discarded. Hypertrophic zone chondrocytes were distinguished from proliferative zone chondrocytes by their larger size. Metaphyseal bone was obtained from a region of trabecular bone beginning ~100 μm distal to the hypertrophic zone. For each zone, tissue dissected from both proximal tibias of one animal (21–33 slides) was pooled before RNA isolation. RNA isolation was performed as previously described, except that one-tenth of every volume was used (Heinrichs et al. 1994). For each animal, ~20–200 ng of total RNA was extracted from every zone. RNA quality was assessed using the Bioanalyzer 2100 with RNA Pico Chips and version A.02.12 of the Bio Sizing Software according to the manufacturer’s instructions (Agilent Biotechnologies, Inc., Palo Alto, CA, USA).
Microarray analysis
Microarray analysis was performed as previously described (Nilsson et al. 2007). Briefly, 30–50 ng total RNA extracted from epiphyseal cartilage (n=4) and resting zone, proliferative zone, proliferative–hypertrophic transition, and hypertrophic zone (n=5 each) was amplified and labeled using the Two-Cycle Target Labeling and Control Reagents (Affymetrix, Santa Clara, CA, USA, P/N 900494) according to the Expression Analysis Technical Manual, version 701021 Rev.5 (Affymetrix). Rat genome 230 2.0 GeneChip Arrays (Affymetrix) were hybridized with a hybridization cocktail containing 15 μg fragmented and labeled cRNA. After hybridization, arrays were washed and stained using the EukGE-WS2v5 protocol (Affymetrix) and scanned using a GeneChip Scanner 3000. Microarray signal values were background corrected and normalized according to the microarray suite 5 statistical algorithm using GeneChip Operating Software (Affymetrix). A global analysis of resting, proliferative, and hypertrophic zone microarray results has been previously reported (Lui et al. 2010).
Quantitative real-time RT-PCR
For quantitative real-time RT-PCR, total RNA (30–200 ng) extracted from epiphyseal cartilage, resting zone, proliferative zone, transition zone, hypertrophic zone, perichondrium, and metaphyseal bone (n=5–7) were reverse transcribed using Superscript II Reverse Transcriptase (Invitrogen) according to the manufacturer’s instructions. The resulting cDNA was diluted and stored at −20 °C until further analysis. Real-time RT-PCR was performed by primers and specific intron-spanning FAM-labeled Taqman probes provided by Applied Biosystems (Foster City, CA, USA): Ptch1 (Rn01527980_m1), Pthr1 (Rn00571596_m1), Gli1 (Rn01504237_m1), and Gli3 (Rn01538495_m1), or custom designed: PTHrP forward (GTTTGAGAGAGGCACAGTTGGA); PTHrP probe (TGATTCCTACAAAAGTCC); and PTHrP reverse (AGCCTCCGCAGCATCGT). For the remaining assays, intron-spanning primers with the following sequences were designed using Primer Express 2.0 (Applied Biosystems) and SYBR Green was used for the PCR reactions: Ihh forward (TCAGACCGCGACCGAAATAA), Ihh reverse (CCGAGTGCTCAGACTTGACAGA); Smo forward (CGGTCACCGGCCTCTGTA), Smo reverse (GATTGGAGTTCCGCCAGTCA); Gli2 forward (AGCACCAGAACCGCACTCA), Gli2 reverse (TCTTAGTGCAGCCTGGGATCTT); and Col10a1 forward (GCAGCAGCCAGAATCCATTT), Col10a1 reverse (AAGTGCGCTCTTCACACCTGT). These assays were confirmed to generate a single band of the expected size by gel electrophoresis and repeatedly validated by dissociation curve analysis with each PCR reaction. Reactions were run in triplicate with TaqMan Universal PCR Master Mix (Applied Biosystems) or SYBR Green Master Mix (Applied Biosystems) using the ABI prism 7000 Sequence Detection System (Applied Biosystems) according to the manufacturer’s instructions. The cDNA was amplified using the following thermal cycling setting: one cycle at 50 °C for 2 min and 95 °C for 10 min, followed by 41 cycles of 15 s at 95 °C and 1 min at 60 °C. To account for variability in starting material and efficiency in the conversion of RNA to cDNA, the relative amounts of transcripts were normalized to an endogenous control transcript, 18S ribosomal RNA (assay 4319413E, Applied Biosystems). The relative expression of each transcript was assessed taking into account respective efficiencies (E), using the formula:
where r represents 18S ribosomal RNA, i represents the gene of interest, and CT represents the threshold cycle. The relative expression was multiplied by 109 for convenience. Serial tenfold dilutions of bone, liver, or spleen cDNA were used to determine the efficiencies of the gene expression assays (Pfaffl 2001).
β-Galactosidase staining
Frozen sections (10 μm) of whole tibia and growth plate were stained for β-galactosidase activity as described previously (Liu et al. 1998), with minor modifications. Briefly, slides were thawed for 10 min, washed three times for 5 min each in PBS pH 7.4 (Invitrogen), and then incubated overnight at 37 °C in 1 mg/ml of X-gal (5-bromo-4-chloro-3-indolyl β-d-galactopyranoside, Invitrogen), 5 mM K3Fe(CN)6 (Sigma–Aldrich), 5 mM K4Fe(CN)6×3H2O (Sigma), and wash buffer containing PBS pH 7.4, 2 mM MgCl2 (Sigma), 0.02% Nonidet P40 (Sigma), and 0.05% sodium deoxycholate (Sigma). The reaction was stopped by washing the slides in PBS pH 7.4 (10 min). The slides were then fixed in 4% paraformaldehyde for 10 min, counterstained with 0.1% nuclear fast red solution (Sigma), dehydrated in serial ethanol solutions (70, 85, and 100%, 5 min each), immersed in xylene, and mounted using Permount solution (Fisher Scientific).
Statistical analysis
Real-time RT-PCR relative expression and microarray data are represented as mean±s.e.m. Statistical analysis was performed by the paired Student’s t-test to compare epiphyseal cartilage to resting zone, resting zone to proliferative zone, proliferative zone to hypertrophic, and resting zone to hypertrophic zone. P values were adjusted for multiple comparisons by the Holm–Sidak method. All real-time RT-PCR data were log transformed before statistical testing. If the test for normality failed, then the Wilcoxon signed rank test was used instead. Significance was recognized at P<0.05.
Results
Expression of genes involved in the Ihh–PTHrP system was assessed by microdissecting growth plate cartilage into its constituent zones, followed by microarray analysis (GEO accession number GSE23432) and real-time RT-PCR. The patterns of expression indicated by both methods were generally similar (Fig. 1). Because real-time RT-PCR is considered to have greater sequence specificity, we performed detailed statistical analysis of the data based on this technique.
Figure 1.
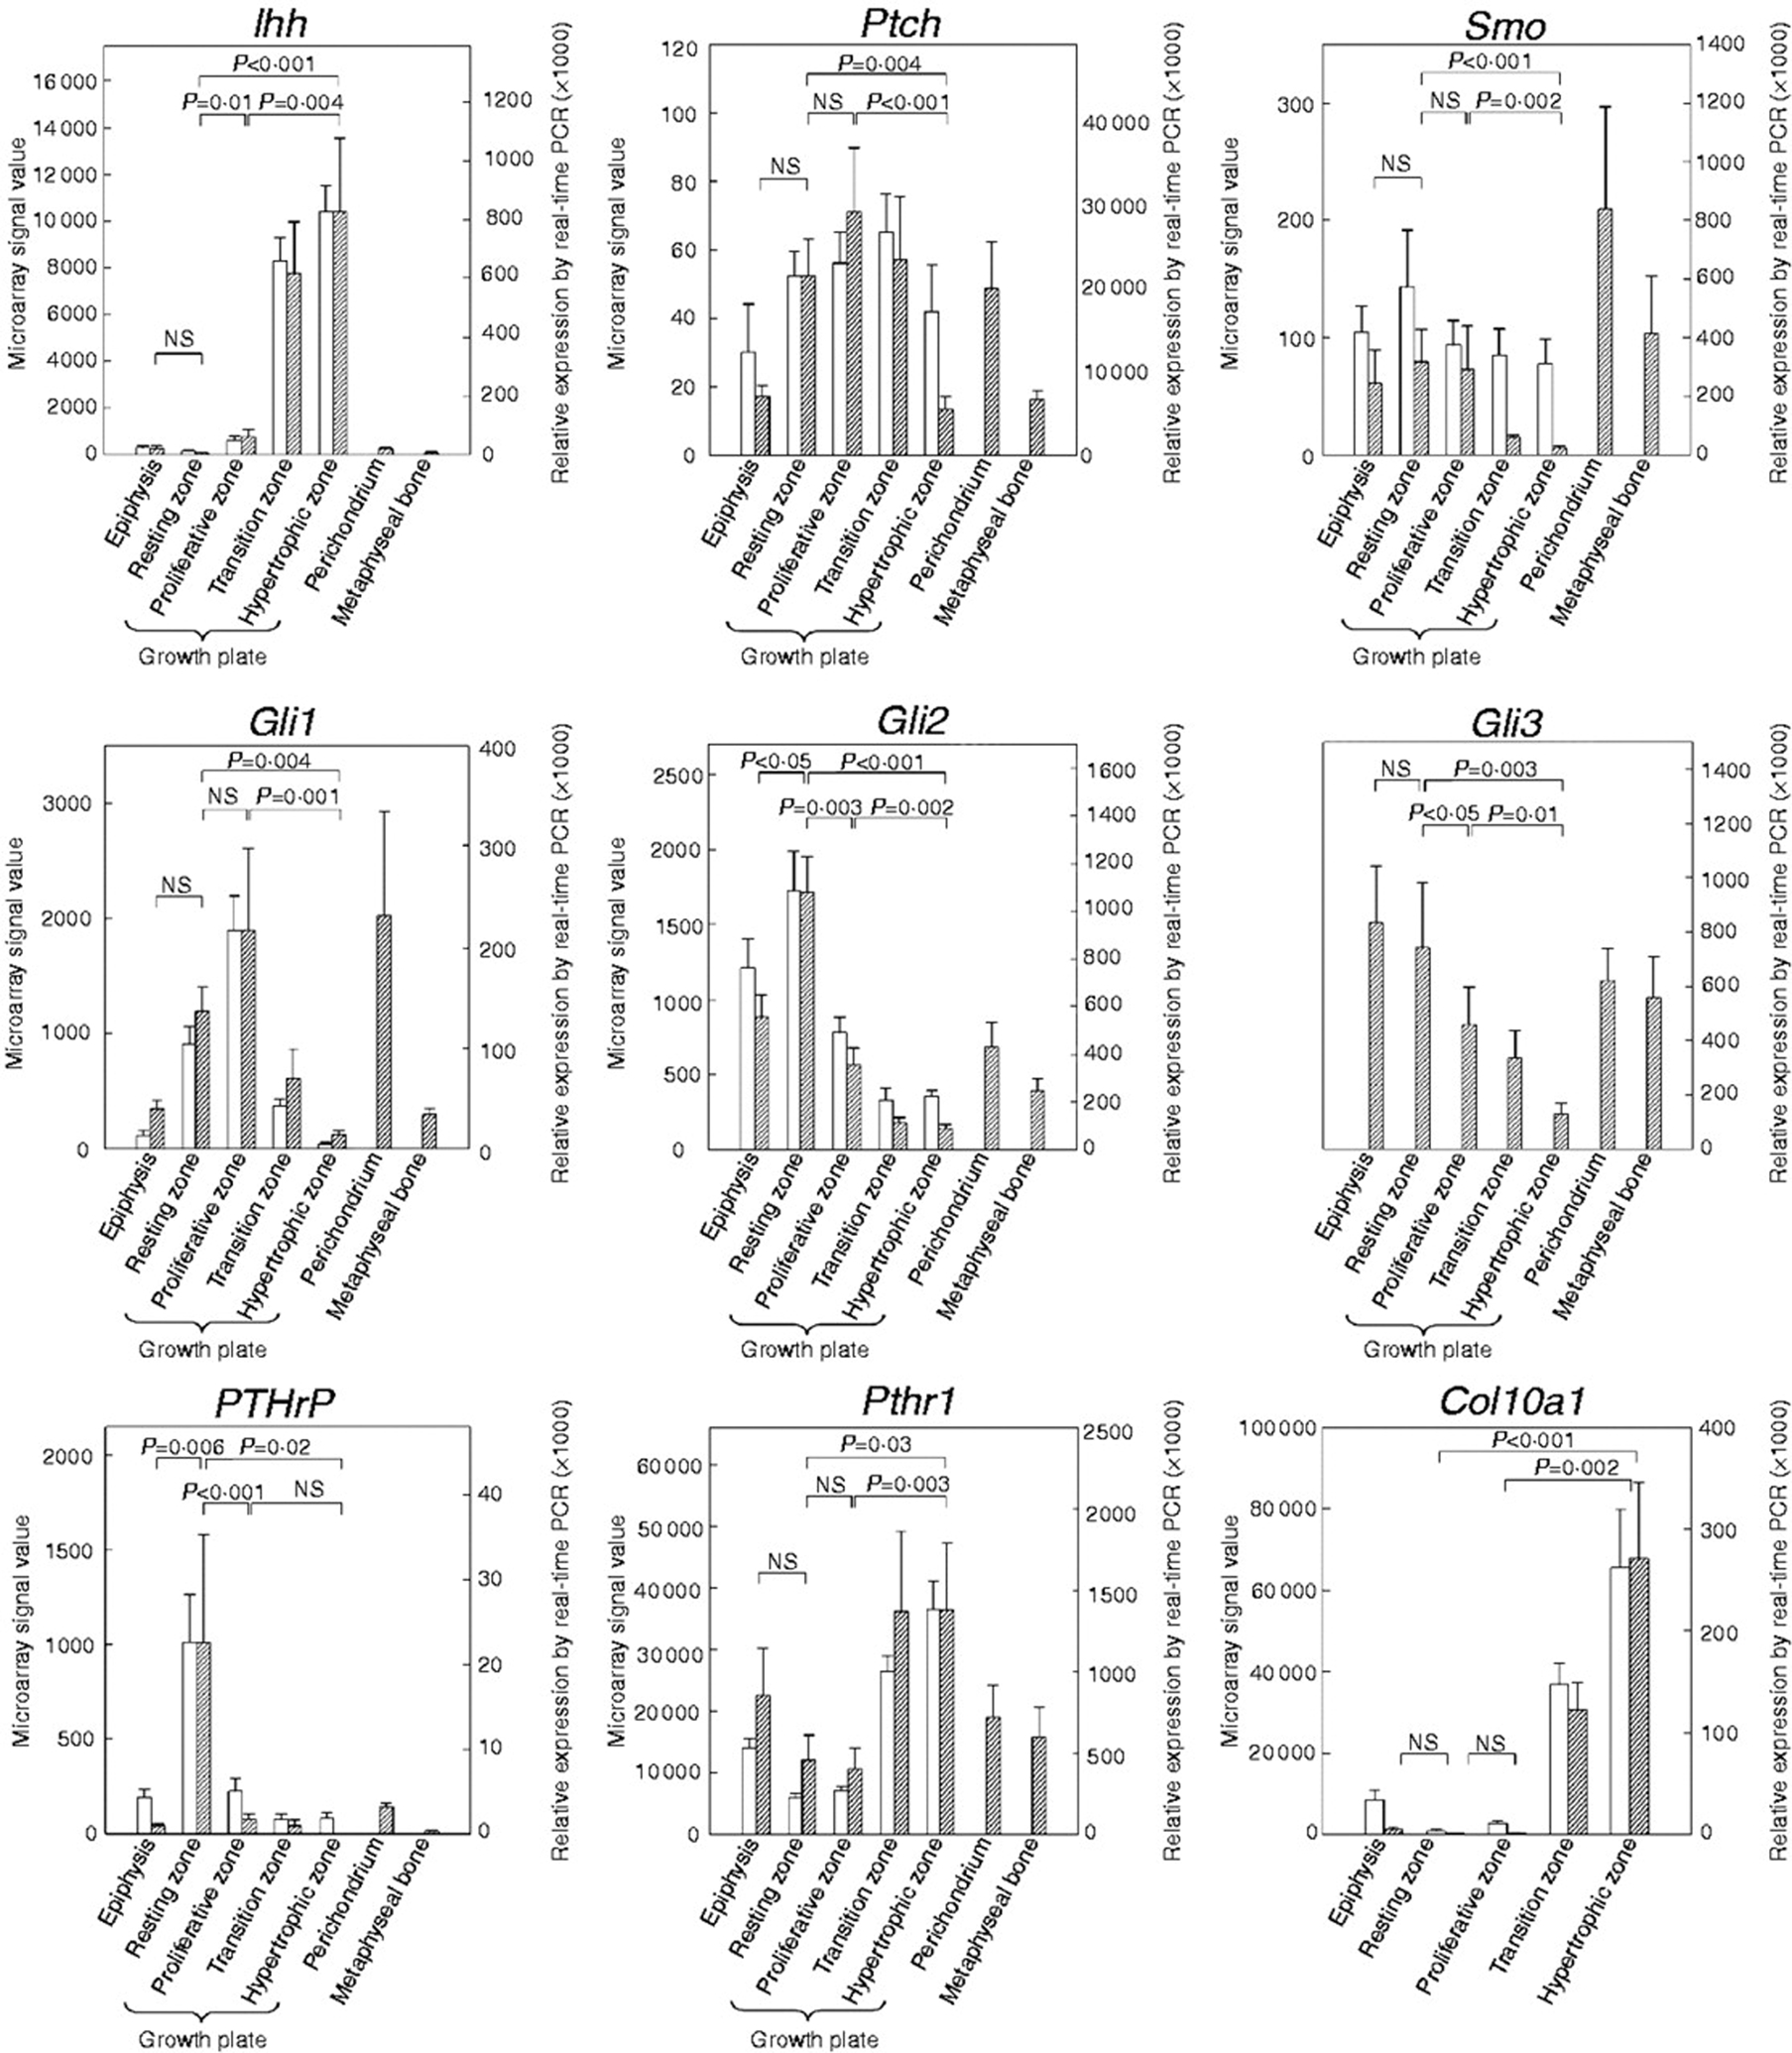
Expression of genes participating in the Ihh–PTHrP system in growth plate and surrounding tissues. Growth plate cartilage was microdissected into its constituent zones, and relative mRNA expression of Ihh, Ptch1, Smo, Gli1, Gli2, Gli3, PTHrP, Pthr1, and Col10a1 was determined using microarray analysis (n=4–5) and/or real-time RT-PCR (n=5–7). Microarray signal values (white bars, left y-axis) were background corrected and normalized. Relative expression values (hatched bars, right y-axis) generated by real-time RT-PCR were normalized to 18S rRNA. Values are mean±s.e.m. NS, not significant. The microarray did not include a probe set for Gli3.
Expression of genes involved in Ihh signaling in growth plate cartilage
Ihh mRNA expression was detected in the proliferative–hypertrophic transition region and hypertrophic zone at similar levels, which were ~150-fold higher than in resting zone (P=0.001; Fig. 1) and 12-fold higher than in proliferative zone (P=0.004; Fig. 1). Ptch1 and Smo mRNA showed similar expression patterns. Ptch1 was detected at levels approximately four- to fivefold higher in resting zone and proliferative zone, compared with hypertrophic zone (P=0.004 and P=0.001 respectively, Fig. 1). Similarly, Smo was detected at levels ~13-fold higher in resting zone and proliferative zone than in hypertrophic zone (P=0.001 and P=0.002, Fig. 1).
The Gli family of transcription factors mRNA tended to be expressed early in the chondrocyte differentiation pathway (Fig. 1). Gli1 was detected at higher levels both in resting zone and in proliferative zone than in hypertrophic zone (approximately tenfold, P=0.004 and 15-fold, P=0.001 respectively). Gli2 mRNA levels were also found to be higher both in resting zone and in proliferative zone than in hypertrophic zone (~12-fold, P=0.001 and fourfold, P=0.002 respectively. Similarly, Gli3 mRNA levels were higher both in resting zone and in proliferative zone than in hypertrophic zone (approximately sixfold, P=0.003 and fourfold, P=0.01 respectively). The microarray did not include a probe set for Gli3.
Expression of PTHrP and Pthr1 in growth plate cartilage
PTHrP mRNA expression was detected primarily in resting zone, at levels ~24-fold higher than in epiphyseal cartilage and 13-fold higher than in proliferative zone (P=0.006 and P=0.001 respectively; Fig. 1). Pthr1 mRNA expression was modestly higher in the proliferative–hypertrophic transition region and the hypertrophic zone, which were both approximately threefold higher compared with resting zone and proliferative zone (P=0.03, hypertrophic versus resting and P=0.003, hypertrophic versus proliferative; Fig. 1).
Developmental changes in Ihh signaling during pre- and postnatal growth
To localize cells that show active hedgehog signaling in the proximal tibiae during development, we used mice in which coding sequences of Gli1 were replaced with lacZ (Bai et al. 2002). Because hedgehog signaling stimulates Gli1 transcription, lacZ expression in this mouse indicates activity of the hedgehog pathway.
At gestational day 16, lacZ expression appeared greatest in the periarticular cartilage. There also appeared to be abundant expression in the remaining region of round proliferating chondrocytes, less expression in the zone of flat proliferating chondrocytes, and minimal expression in the hypertrophic chondrocytes. The perichondrium showed high expression levels (Fig. 2).
Figure 2.
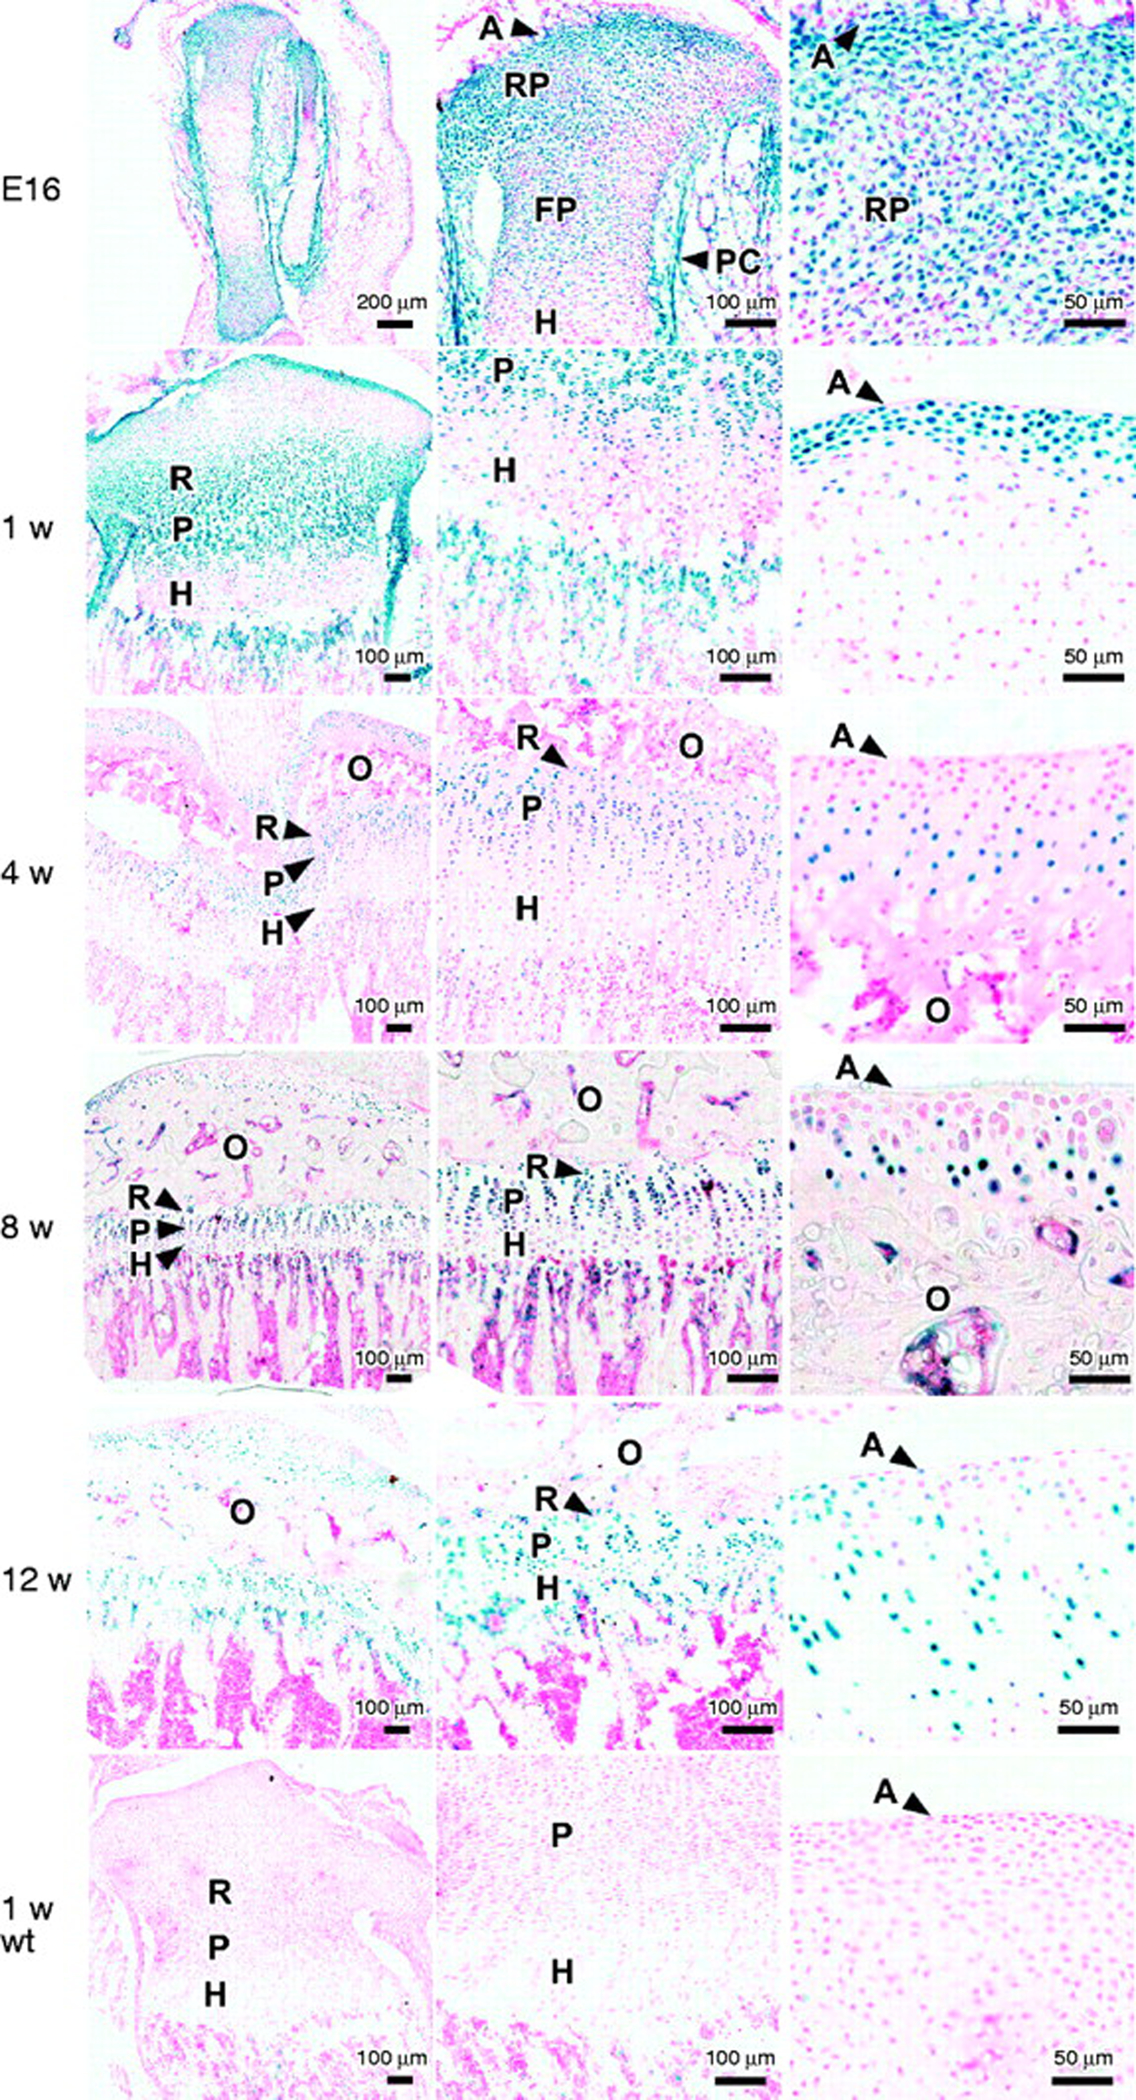
LacZ expression in proximal tibiae of Gli1–lacZ mice at E16, 1, 4, 8, and 12 weeks of age. These mice have one allele in which coding sequences of Gli1 were replaced with lacZ, which encodes a β-galactosidase enzyme. Because hedgehog signaling stimulates Gli1 transcription, lacZ expression in this mouse indicates activity of the hedgehog pathway. Frozen sections (10 μm) of whole tibia and growth plate were stained for β-galactosidase activity using X-gal, a chromogenic substrate that yields a blue product. Representative photomicrographs are shown. The left-, middle-, and right-hand columns show progressively increasing magnification, with the right-hand column images centered on the periarticular cartilage. The lowest row shows a 1-week old wild-type animal that served as a negative control. In general, lacZ expression was detected throughout the growth plate but at lower levels in hypertrophic cartilage. A, articular surface; RP, round proliferating chondrocytes; FP, flat proliferating chondrocytes; R, resting zone; P, proliferative zone; H, hypertrophic zone; PC, perichondrium; O, secondary center of ossification; wt, wild type.
In sections from 1-week-old mice, there appeared to be high levels of lacZ expression in the periarticular cartilage, the resting zone, and the proliferative zone. There appeared to be lower levels of lacZ expression in the hypertrophic zone and minimal expression in the hypertrophic cells located in the central epiphysis where the secondary center of ossification will form. There also appeared to be substantial expression in the perichondrium (Fig. 2). At 4, 8, and 12 weeks of age, the expression pattern established at 1 week of age was maintained, with high expression in periarticular, resting zone and proliferative zone chondrocytes and lower levels of expression in hypertrophic chondrocytes (Fig. 2). Thus, in general, the distribution pattern of hedgehog signaling activity in embryonic growth cartilage appeared to be preserved during postnatal life, with low levels of activity in hypertrophic chondrocytes and higher levels throughout the remaining cartilage and in perichondrium. No cells stained positive for β-galactosidase activity in sections from wild-type mice at any of the investigated ages (Fig. 2).
With increasing age, beginning at 4 weeks, the most distal articular chondrocytes, that is, those located closest to the articular surface, lost detectable lacZ expression. This loss occurred over much, but not all, of the proximal tibial articular surface.
Discussion
In embryonic growth cartilage, the Ihh–PTHrP feedback loop plays a critical role in the regulation of proliferation and hypertrophic differentiation. However, less is known about this system in the mature postnatal growth plate. In this study, we explored the organization of this paracrine regulatory system in postnatal life by two methods. First, we used microdissection to separate the growth plate into its constituent zones and then used microarray and real-time RT-PCR to analyze expression of genes involved in the Ihh–PTHrP system The accuracy of this approach is supported by previous studies showing good concordance between microdissection followed by microarray and real-time RT-PCR and in situ hybridization (Nilsson et al. 2007, Lui et al. 2010). Second, we used a mouse model in which the coding sequences of Gli1 were replaced with lacZ. Gli1 is not only a transcription factor that participates in hedgehog signaling but also a target gene in the hedgehog pathway such that its expression depends on Ihh signaling. Therefore, hedgehog signaling leads to increased Gli1 transcription. Consequently in this mouse model, lacZ expression serves as a marker for cells with active hedgehog signaling (Bai et al. 2002).
Microdissection followed by expression microarray and real-time RT-PCR both indicated that Ihh is expressed primarily in the hypertrophic zone and the proliferative–hypertrophic transition region. This result indicates that the source of Ihh in the postnatal growth plate is similar to the source in the embryonic growth cartilage, that is, the prehypertrophic and hypertrophic chondrocytes (Bitgood & McMahon 1995, Kronenberg 2003).
Our findings also provide evidence that, in the postnatal growth plate, Ihh acts on the proliferative and resting zone chondrocytes and on perichondrium. Real-time RT-PCR showed higher expression levels in the resting and proliferative zones compared with the hypertrophic zone for multiple genes involved in hedgehog signaling, including Ptch1, the receptor for hedgehog ligands, Smo, a co-receptor, and Gli1, Gli2, and Gli3, transcription factors activated by hedgehog signaling. Expression of these hedgehog signaling genes was also observed in the perichondrium at levels comparable to those in the resting and proliferative zones. This expression patterns suggests that Ihh has the potential to act on proliferative and resting zone chondrocytes and on perichondrium. Furthermore, in the Gli1–lacZ mouse model, lacZ expression, which reflects active hedgehog signaling, was found in the resting zone, proliferative zone, and perichondrium and also in the periarticular cartilage, a region that we did not analyze by microdissection. The presence of lacZ expression provides strong confirmation that cells in these regions express the genes necessary for hedgehog signal transduction, are exposed to a hedgehog ligand, and that the entire hedgehog signaling pathway is functional, resulting in altered gene expression. Our findings in the postnatal growth plate parallel those in the embryonic growth cartilage, where Ihh is thought to act on analogous regions, including round proliferating chondrocytes, flat proliferating chondrocytes, and perichondrium (Long et al. 2001, Kronenberg 2003, Mak et al. 2008). Thus, these findings support the hypothesis that Ihh is capable to act as a long-range morphogen directly promoting PTHrP production in target cells (Koziel et al. 2004) without the need of a secondary signal from the perichondrium as previously suggested (Vortkamp et al. 1996, Alvarez et al. 2002).
Expression of PTHrP in the 1-week postnatal rats was predominantly confined to the resting zone, a location that does not correspond to the PTHrP expression domain in the mouse embryo. In the postnatal rats, microarray and real-time RT-PCR showed much higher PTHrP mRNA expression in resting zone than in proliferative zone, hypertrophic zone or in the more distal epiphyseal cartilage. In the mouse embryo, PTHrP is expressed more distally, in the periarticular cartilage (Lee et al. 1995). Postnatally, the secondary ossification center forms in the center of the epiphyseal cartilage. This structure that contains bone and blood vessels would likely block diffusion of PTHrP coming from the periarticular area and thus prevent it from acting on the growth plate. The observed shift of PTHrP expression to the resting zone therefore may serve to provide a more proximal source of this critical factor and thus preserve the Ihh–PTHrP feedback loop in postnatal life. Microsurgical manipulations of the growth plate have shown that the resting zone secretes a hypertrophy-inhibiting factor (Abad et al. 2002). We speculate that PTHrP may be this putative factor, since it is primarily produced by resting zone chondrocytes and is an important negative regulator of hypertrophic differentiation. Although we did not study PTHrP expression in the postnatal periarticular cartilage, prior studies suggest that expression persists in this region as well postnatally and thus the original embryonic source of PTHrP expands and is divided by the secondary center of ossification to form two sources (Koziel et al. 2005, Chen et al. 2006, 2008). The persistent articular source may participate in another Ihh–PTHrP regulatory system in the postnatal articular cartilage (Chen et al. 2008).
Pthr1, the receptor for PTHrP, appeared to be expressed at fairly uniform levels throughout the growth plate, although the levels were modestly higher in the proliferative–hypertrophic region and in the hypertrophic zone than in proliferative or resting zone. This pattern closely matches the pattern previously observed in the mouse embryo (Vortkamp et al. 1996) where there is evidence that PTHrP acts on Pthr1 to keep chondrocytes proliferating and prevent hypertrophic differentiation (Lee et al. 1996, Schipani et al. 1997).
The postnatal resting zone expressed PTHrP and also showed active hedgehog signaling as evidence by expression studies and the Gli1–lacZ mouse model. These findings suggest that the PTHrP expression by the resting zone chondrocytes could be positively regulated by Ihh action. Similar positive regulation has been demonstrated in the mouse embryo, although in the embryo, it is not clear whether this effect of Ihh is direct or mediated by an intermediate cell, perhaps in the perichondrium (Kronenberg 2006). In the postnatal growth plate, the distance between the source of Ihh in the hypertrophic zone and the source of PTHrP in the resting zone is shorter than in the embryonic growth cartilage, suggesting that a direct action of Ihh is plausible. It is not clear whether these findings in rodents apply to large mammals, which tend to have wider growth plates. Therefore, if the model suggested by this study applies to large mammals, Ihh and PTHrP would have to diffuse greater distances than in small mammals. For example in the distal femur growth plate, the height of the proliferative zone is ~0.7 mm (Kember & Sissons 1976) in a juvenile human, compared with ~0.25 mm in the rat (Forcinito et al. 2011).
Taken together, our findings indicate that, in the postnatal growth plate, the organization of the Ihh–PTHrP system is quite similar to that in the embryonic growth cartilage. Postnatally, Ihh appears to be expressed by cells in the proliferative–hypertrophic region and the hypertrophic zone. Ihh appears to act through Ptch1, Smo, and Gli transcription factors in the proliferative zone, resting zone, and perichondrium. PTHrP is produced in the resting zone, and its receptor is expressed throughout the growth plate. Thus, the embryonic system and the postnatal system appear to be organized quite similarly except for the source of PTHrP.
Prior evidence suggests that the Ihh–PTHrP feedback loop controls the position at which proliferative chondrocytes begin to hypertrophy (Amizuka et al. 1994). With increasing postnatal age, the supply of resting chondrocytes gradually diminishes (Schrier et al. 2006). We speculate that the decrease in resting zone chondrocyte numbers might lead to a decrease in PTHrP production and consequently may explain why, in older animals, proliferative chondrocytes stop replicating and undergo hypertrophic differentiation at a point closer to the resting zone than occurs in the young animal. Therefore, diminished production of PTHrP in a dwindling resting zone might explain why the length of the proliferative columns decreases with age, a prominent feature of growth plate senescence (Walker & Kember 1972, Nilsson & Baron 2004).
Our findings agree with most but not all prior studies of the Ihh–PTHrP system in the postnatal rodent. Several previous studies have assessed expression of some genes involved in the Ihh–PTHrP system using in situ hybridization and immunohistochemistry. Our findings are consistent with in situ hybridization studies of Ihh (Vortkamp et al. 1998, van der Eerden et al. 2000, Maeda et al. 2007), Ptch1 (Vortkamp et al. 1998, Maeda et al. 2007), and Gli1 (Vortkamp et al. 1998). However, our findings differ from the studies by van der Eerden et al. (2000) that used non-radioactive in situ hybridization and immunohistochemistry and found PTHrP and Ptch1 expression in the prehypertrophic and hypertrophic zones suggesting that the postnatal system differs from the embryonic system and may involve dual hedgehog–PTHrP feedback loops in the proximal and distal regions of the growth plate. The differing results may be due to difference in the age of the animals, a difference in methodology, or both.
In summary, our work provides a comprehensive expression analysis of the key genes involved in Ihh and PTHrP signaling by two quantitative methods, microarray analysis and real-time RT-PCR, as well as a functional murine model to assess hedgehog signaling. The results provide evidence that the Ihh–PTHrP system, which is established in the embryonic growth cartilage, persists in the mature postnatal growth. We also found evidence that postnatally, this system is adjusted to allow expression of PTHrP in the resting zone. This adjustment presumably serves to provide PTHrP from a more proximal source because the secondary ossification center, which forms in the center of the postnatal epiphysis, presumably obstructs the diffusion path between the periarticular region and the growth plate.
Funding
This research was supported by the Intramural Research Program of the Eunice Kennedy Shriver National Institute of Child Health and Human Development, NIH, Bethesda, MD, USA. O N was supported by an ESPE Research Fellowship Grant and grants from the Swedish Research Council (K2007-52X-20316-01-4), the Stockholm County Council, the Swedish Society of Medicine, HKH kronprinsessan Lovisas Förening för Barnasjukvård, Sällskapet Barnavård, Stiftelsen Frimurare Barnhuset i Stockholm, and the Karolinska Institutet.
Footnotes
Declaration of interest
The authors declare that there is no conflict of interest that could be perceived as prejudicing the impartiality of the research reported.
References
- Abad V, Meyers JL, Weise M, Gafni RI, Barnes KM, Nilsson O, Bacher JD & Baron J 2002. The role of the resting zone in growth plate chondrogenesis. Endocrinology 143 1851–1857.doi: 10.1210/en.143.5.1851. [DOI] [PubMed] [Google Scholar]
- Alvarez J, Sohn P, Zeng X, Doetschman T, Robbins DJ & Serra R 2002. TGFbeta2 mediates the effects of hedgehog on hypertrophic differentiation and PTHrP expression. Development 129 1913–1924. [DOI] [PubMed] [Google Scholar]
- Amizuka N, Warshawsky H, Henderson JE, Goltzman D & Karaplis AC 1994. Parathyroid hormone-related peptide-depleted mice show abnormal epiphyseal cartilage development and altered endochondral bone formation. Journal of Cell Biology 126 1611–1623.doi: 10.1083/jcb.126.6.1611. [DOI] [PMC free article] [PubMed] [Google Scholar]
- Bai CB, Auerbach W, Lee JS, Stephen D & Joyner AL 2002. Gli2, but not Gli1, is required for initial Shh signaling and ectopic activation of the Shh pathway. Development 129 4753–4761.doi: 10.1242/dev.00115. [DOI] [PubMed] [Google Scholar]
- Baron J, Klein KO, Colli MJ, Yanovski JA, Novosad JA, Bacher JD & Cutler GB Jr 1994. Catch-up growth after glucocorticoid excess: a mechanism intrinsic to the growth plate. Endocrinology 135 1367–1371.doi: 10.1210/en.135.4.1367. [DOI] [PubMed] [Google Scholar]
- Bitgood MJ & McMahon AP 1995. Hedgehog and Bmp genes are coexpressed at many diverse sites of cell–cell interaction in the mouse embryo. Developmental Biology 172 126–138.doi: 10.1006/dbio.1995.0010. [DOI] [PubMed] [Google Scholar]
- Chen X, Macica CM, Dreyer BE, Hammond VE, Hens JR, Philbrick WM & Broadus AE 2006. Initial characterization of PTH-related protein gene-driven lacZ expression in the mouse. Journal of Bone and Mineral Research 21 113–123.doi: 10.1359/JBMR.051005. [DOI] [PubMed] [Google Scholar]
- Chen X, Macica CM, Nasiri A & Broadus AE 2008. Regulation of articular chondrocyte proliferation and differentiation by indian hedgehog and parathyroid hormone-related protein in mice. Arthritis and Rheumatism 58 3788–3797.doi: 10.1002/art.23985. [DOI] [PMC free article] [PubMed] [Google Scholar]
- Chung UI, Schipani E, McMahon AP & Kronenberg HM 2001. Indian hedgehog couples chondrogenesis to osteogenesis in endochondral bone development. Journal of Clinical Investigation 107 295–304.doi: 10.1172/JCI11706. [DOI] [PMC free article] [PubMed] [Google Scholar]
- van der Eerden BC, Karperien M, Gevers EF, Lowik CW & Wit JM 2000. Expression of Indian hedgehog, parathyroid hormone-related protein, and their receptors in the postnatal growth plate of the rat: evidence for a locally acting growth restraining feedback loop after birth. Journal of Bone and Mineral Research 15 1045–1055.doi: 10.1359/jbmr.2000.15.6.1045. [DOI] [PubMed] [Google Scholar]
- van der Eerden BC, Karperien M & Wit JM 2003. Systemic and local regulation of the growth plate. Endocrine Reviews 24 782–801.doi: 10.1210/er.2002-0033. [DOI] [PubMed] [Google Scholar]
- Forcinito P, Andrade AC, Finkielstain GP, Baron J, Nilsson O & Lui JC 2011. Growth-inhibiting conditions slow growth plate senescence. Journal of Endocrinology 208 59–67.doi: 10.1677/JOE-10-0302. [DOI] [PMC free article] [PubMed] [Google Scholar]
- Gill PS & Rosenblum ND 2006. Control of murine kidney development by sonic hedgehog and its GLI effectors. Cell Cycle 5 1426–1430.doi: 10.4161/cc.5.13.2928. [DOI] [PubMed] [Google Scholar]
- Heinrichs C, Yanovski JA, Roth AH, Yu YM, Domene HM, Yano K, Cutler GB Jr & Baron J 1994. Dexamethasone increases growth hormone receptor messenger ribonucleic acid levels in liver and growth plate. Endocrinology 135 1113–1118.doi: 10.1210/en.135.3.1113. [DOI] [PubMed] [Google Scholar]
- Hirai T, Chagin AS, Kobayashi T, Mackem S & Kronenberg HM 2010. Parathyroid hormone/parathyroid hormone-related protein receptor signaling is required for maintenance of the growth plate in postnatal life. PNAS 108 191–196.doi: 10.1073/pnas.1005011108. [DOI] [PMC free article] [PubMed] [Google Scholar]
- Hunziker EB 1994. Mechanism of longitudinal bone growth and its regulation by growth plate chondrocytes. Microscopy Research and Technique 28 505–519.doi: 10.1002/jemt.1070280606. [DOI] [PubMed] [Google Scholar]
- Kember NF & Sissons HA 1976. Quantitative histology of the human growth plate. Journal of Bone and Joint Surgery 58-B 426–435. [DOI] [PubMed] [Google Scholar]
- Koziel L, Kunath M, Kelly OG & Vortkamp A 2004. Ext1-dependent heparin sulfate regulates the range of Ihh during endochondral ossification. Developmental Cell 6 801–813.doi: 10.1016/j.devcel.2004.05.009. [DOI] [PubMed] [Google Scholar]
- Koziel L, Wuelling M, Schneider S & Vortkamp A 2005. Gli3 acts as a repressor downstream of Ihh in regulating two distinct steps of chondrocyte differentiation. Development 132 5249–5260.doi: 10.1242/dev.02097. [DOI] [PubMed] [Google Scholar]
- Kronenberg HM 2003. Developmental regulation of the growth plate. Nature 423 332–336.doi: 10.1038/nature01657. [DOI] [PubMed] [Google Scholar]
- Kronenberg HM 2006. PTHrP and skeletal development. Annals of the New York Academy of Sciences 1068 1–13.doi: 10.1196/annals.1346.002. [DOI] [PubMed] [Google Scholar]
- Lee K, Deeds JD & Segre GV 1995. Expression of parathyroid hormone-related peptide and its receptor messenger ribonucleic acids during fetal development of rats. Endocrinology 136 453–463.doi: 10.1210/en.136.2.453. [DOI] [PubMed] [Google Scholar]
- Lee K, Lanske B, Karaplis AC, Deeds JD, Kohno H, Nissenson RA, Kronenberg HM & Segre GV 1996. Parathyroid hormone-related peptide delays terminal differentiation of chondrocytes during endochondral bone development. Endocrinology 137 5109–5118.doi: 10.1210/en.137.11.5109. [DOI] [PubMed] [Google Scholar]
- Liu A, Joyner AL & Turnbull DH 1998. Alteration of limb and brain patterning in early mouse embryos by ultrasound-guided injection of Shh-expressing cells. Mechanisms of Development 75 107–115.doi: 10.1016/S0925-4773(98)00090-2. [DOI] [PubMed] [Google Scholar]
- Long F, Zhang XM, Karp S, Yang Y & McMahon AP 2001. Genetic manipulation of hedgehog signaling in the endochondral skeleton reveals a direct role in the regulation of chondrocyte proliferation. Development 128 5099–5108. [DOI] [PubMed] [Google Scholar]
- Lui JC, Andrade AC, Forcinito P, Hegde A, Chen W, Baron J & Nilsson O 2010. Spatial and temporal regulation of gene expression in the mammalian growth plate. Bone 46 1380–1390.doi: 10.1016/j.bone.2010.01.373. [DOI] [PMC free article] [PubMed] [Google Scholar]
- Maeda Y, Nakamura E, Nguyen MT, Suva LJ, Swain FL, Razzaque MS, Mackem S & Lanske B 2007. Indian hedgehog produced by postnatal chondrocytes is essential for maintaining a growth plate and trabecular bone. PNAS 104 6382–6387.doi: 10.1073/pnas.0608449104. [DOI] [PMC free article] [PubMed] [Google Scholar]
- Mak KK, Kronenberg HM, Chuang PT, Mackem S & Yang Y 2008. Indian hedgehog signals independently of PTHrP to promote chondrocyte hypertrophy. Development 135 1947–1956.doi: 10.1242/dev.018044. [DOI] [PMC free article] [PubMed] [Google Scholar]
- Marino R, Hegde A, Barnes KM, Schrier L, Emons JA, Nilsson O & Baron J 2008. Catch-up growth after hypothyroidism is caused by delayed growth plate senescence. Endocrinology 149 1820–1828.doi: 10.1210/en.2007-0993. [DOI] [PMC free article] [PubMed] [Google Scholar]
- Nieuwenhuis E & Hui CC 2005. Hedgehog signaling and congenital malformations. Clinical Genetics 67 193–208.doi: 10.1111/j.1399-0004.2004.00360.x. [DOI] [PubMed] [Google Scholar]
- Nilsson O & Baron J 2004. Fundamental limits on longitudinal bone growth: growth plate senescence and epiphyseal fusion. Trends in Endocrinology and Metabolism 15 370–374.doi: 10.1016/S1043-2760(04)00185-7. [DOI] [PubMed] [Google Scholar]
- Nilsson O, Parker EA, Hegde A, Chau M, Barnes KM & Baron J 2007. Gradients in bone morphogenetic protein-related gene expression across the growth plate. Journal of Endocrinology 193 75–84.doi: 10.1677/joe.1.07099. [DOI] [PubMed] [Google Scholar]
- Pfaffl MW 2001. A new mathematical model for relative quantification in real-time RT-PCR. Nucleic Acids Research 29 e45 doi: 10.1093/nar/29.9.e45. [DOI] [PMC free article] [PubMed] [Google Scholar]
- Schipani E, Lanske B, Hunzelman J, Luz A, Kovacs CS, Lee K, Pirro A, Kronenberg HM & Juppner H 1997. Targeted expression of constitutively active receptors for parathyroid hormone and parathyroid hormone-related peptide delays endochondral bone formation and rescues mice that lack parathyroid hormone-related peptide. PNAS 94 13689–13694.doi: 10.1073/pnas.94.25.13689. [DOI] [PMC free article] [PubMed] [Google Scholar]
- Schrier L, Ferns SP, Barnes KM, Emons JA, Newman EI, Nilsson O & Baron J 2006. Depletion of resting zone chondrocytes during growth plate senescence. Journal of Endocrinology 189 27–36.doi: 10.1677/joe.1.06489. [DOI] [PubMed] [Google Scholar]
- Vortkamp A, Lee K, Lanske B, Segre GV, Kronenberg HM & Tabin CJ 1996. Regulation of rate of cartilage differentiation by Indian hedgehog and PTH-related protein. Science 273 613–622.doi: 10.1126/science.273.5275.613. [DOI] [PubMed] [Google Scholar]
- Vortkamp A, Pathi S, Peretti GM, Caruso EM, Zaleske DJ & Tabin CJ 1998. Recapitulation of signals regulating embryonic bone formation during postnatal growth and in fracture repair. Mechanisms of Development 71 65–76.doi: 10.1016/S0925-4773(97)00203-7. [DOI] [PubMed] [Google Scholar]
- Walker KV & Kember NF 1972. Cell kinetics of growth cartilage in the rat tibia. I. Measurements in young male rats. Cell and Tissue Kinetics 5 401–408. [DOI] [PubMed] [Google Scholar]
- Weise M, De-Levi S, Barnes KM, Gafni RI, Abad V & Baron J 2001. Effects of estrogen on growth plate senescence and epiphyseal fusion. PNAS 98 6871–6876.doi: 10.1073/pnas.121180498. [DOI] [PMC free article] [PubMed] [Google Scholar]