

Abstract
Single nanoparticle analysis can reveal how particle-to-particle heterogeneity affects ensemble properties derived from traditional bulk measurements. High-bandwidth, low noise electrochemical measurements are needed to examine the fast heterogeneous electron-transfer behavior of single nanoparticles with sufficient fidelity to resolve the behavior of individual nanoparticles. Herein, nanopore electrode arrays (NEAs) are fabricated in which each pore supports two vertically spaced, individually addressable electrodes. The top ring electrode serves as a particle gate to control the transport of silver nanoparticles (AgNPs) within individual attoliter volume NEAs nanopores, as shown by redox collisions of AgNPs collisions at the bottom disk electrode. The AgNP-nanoporeis system has wide-ranging technological applications as well as fundamental interest, since the transport of AgNPs within the NEA mimics the transport of ions through cell membranes via voltage-gated ion channels. A voltage threshold is observed above which AgNPs are able to access the bottom electrode of the NEAs, i.e., a minimum potential at the gate electrode is required to switch between few and many observed collision events on the collector electrode. It is further shown that this threshold voltage is strongly dependent on the applied voltage at both electrodes as well as the size of AgNPs, as shown both experimentally and through finite-element modeling. Overall, this study provides a precise method of monitoring nanoparticle transport and in situ redox reactions within nanoconfined spaces at the single particle level.
Keywords: Voltage-gated transport, nanoparticle collisions, nanopore electrode arrays, particle rectification
Technical Summary
Gated nanoparticle transport is implemented to control the kinetics of single-nanoparticle redox processes. Ag nanoparticle redox processes in attoliter-volume nanopore dual-electrode arrays are controlled by the relative potentials of the two electrodes and the nanoparticle diameter, producing voltage-gated amperometric behavior, which mimics the behavior of biological voltage-gated ion channels.
1. Introduction
The recent rapid development of solid-state nanopores represents a robust and durable sensing platform to perform single biomolecule detection,[1,2] DNA sequencing,[3,4] and proteomic profiling.[5–7] Synthetic nanopores not only approach the small size of biological ion channels, but can also be designed to incorporate voltage-gating properties and bio-recognition capabilities to mediate analyte transport into the nanopore, where chemical signals can be generated.[8–11] Some biomimetic nanopores behave like ionic diodes, allowing ions or molecules to flow in one direction while suppressing motion in the reverse direction.[12–16] By modifying the inner nanopore wall with bio-receptors or molecular recognition motifs, target molecules can be selectively detected in high-sensitivity assays.[17–21] One method, resistive-pulse sensing, takes advantage of solid-state nanopores by analyzing the change in solution resistance during translocation of a target species to obtain information about the analyte, including size and concentration,[22–24] shape, and velocity.[25–27] Beyond this approach, it is desirable to measure redox reactions of analyte species, including both molecules and nanoparticles, which requires extending the capabilities of resistive pulse experiments.
Nanoparticle collisions at an electrode surface can support direct electron transfer, thereby permitting examination of the heterogeneous electron transfer kinetics of nanoparticles with fast response times and high signal-to-noise ratios.[28–30] A single nanoparticle colliding on the electrode surface can also block the electrode from transferring charge (if the nanoparticle is not redox active),[31–33] serve as an active-site for electrocatalytic reaction,[34–36] or initiate direct redox reactions involving the nanoparticle species.[37,38] Bard and coworkers first characterized single nanoparticle collisions on an ultramicroelectrode by recording the current transients from electrocatalytic reactions in the presence of nanoparticles.[39] Compton and coworkers proposed a straightforward way to characterize the oxidation of single silver nanoparticles on an ultramicroelectrode.[40] After these seminal contributions, detection of a wide range of single objects was demonstrated, e.g. liposomes,[41,42] viruses,[43,44] DNA,[45] soft nanoparticles,[46,47] and nanodroplets.[48,49] Recently, three groups independently reported multipeak collision behavior of single Ag nanoparticles.[50–52] By increasing the bandwidth and lowering the background noise of their electrochemical measurements, they observed the dynamic collision processes of Ag nanoparticles by tracking the trajectories of individual nanoparticles, and proposed a mechanism to explain the partial oxidation and multiple collisions they observed. These results serve to illustrate the intrinsic complexity of electron transfer reactions occurring during the nanoparticle-electrode collision process.
A few attempts have been made to combine the above-motioned techniques, e.g. investigating nanoparticle collisions within a nanopore electrode.[53–55] Compared with the widely-used planar ultramicroelectrodes, nanopore electrodes not only confine the observation volume to enhance the interaction between the particle and electrode, but also isolate the captured nanoparticle from the bulk solution.[56,57] In these examples, nanoparticle transport into the nanopore was governed by diffusion before the nanoparticle was captured, leading to a relatively low collection efficiency. Recently, our group has developed a way to enhance the transport of redox molecules into nanopores by ion accumulation[58,59] and to improve selective uptake by surface modification[60] of nanopore electrodes.
In this work, we demonstrate a method of controlling nanoparticle transport into nanopores while monitoring electrode-surface collisions of single nanoparticles within a nanoconfined volume. Unlike previous work using large planar ultramicroelectrodes, the nanopore electrode arrays (NEAs) used in this study have an average pore size slightly larger than the nanoparticle. In the vertical direction, each nanopore exhibits two closely-spaced electrodes separated by a thin dielectric forming a metal-insulator-metal (MIM) stack, in which the two metals serve as the annular gate and disk detection electrodes, respectively. When operated in single-electrode mode, with only the bottom disk electrode powered, the current magnitude and pulse duration computed from amperometric traces during oxidative nanoparticle collisions are a strong function of applied potential, reflecting the ion accumulation characteristics of attoliter-volume nanopores. When operated in double-electrode mode, the top electrode behaves like a transport-controlling gate which regulates access of nanoparticles to the bottom electrode. The voltage gating behavior is not linear, but instead the frequency of collision events on bottom electrode increases dramatically when the applied top electrode voltage passes a threshold voltage. Furthermore, the voltage threshold is determined by the applied potentials at both electrodes and by nanoparticle size. Simulations indicate that the strong electric field within the NEAs attracts nanoparticles into the nanopores, where they may accumulate, when the applied voltage at the gate electrode is switched to an “ON” potential, i.e. above the threshold voltage. Overall, these results demonstrate a facile approach to accelerate nanoparticle transport within nanopores for in situ investigation of direct electron transfer at single-particle levels.
2. Results and Discussion
2.1. Nanopore Electrode Array Characterization
In order to perform the electrochemical experiments, attoliter-volume nanopore electrode arrays (NEAs) were first fabricated with a recessed ring-disk geometry; a cross-sectional schematic of a single nanopore within the array is shown in Figure 1(A). NEAs were fabricated by a combination of multilamellar film deposition and nanosphere lithography, the details of which are given in the Experimental Section.[61,62] The area covered by the NEAs was 30 μm x 30 μm, as shown in Figure 1(B). The nanopores were defined through nanosphere lithography; thus, pore spacing and pore size were determined by the size of polystyrene (PS) beads and the time of O2 plasma etching, respectively. For this work, the initial diameter of the PS beads, and thus the pore spacing, was 460 nm. The beads were then reduced to ca. 250 nm diameter by O2 plasma to define the final pore size achieved after multi-step reactive ion etching. The arrays exhibit a pore density of ca. 5.5 pores/μm2 (Figure 1(C)), or ~ 5000 pores total in the 30 μm x 30 μm NEA area. The cross-sectional SEM image (Figure 1(D)) clearly shows the MIM structure, composed of the bottom Au electrode, insulating SiNx, top Au electrode, and passivating SiO2 capping layer. The conical frustum shape of the nanopores provides a larger opening at the top to assist nanoparticle access. The diameters of the top ring and bottom disk electrodes were ca. 175 nm and 120 nm, respectively. Since the thickness of the top Au layer and SiNx was 100 nm, the electrochemically active pore volume was ca. 13.8 attoliter (13.8 × 10⁻¹⁸ L). Considering the array contains 5000 nanopores, the particle concentration for single nanoparticle occupancy is ca. 25 pM. The AgNP concentrations in the following experiments was 80 pM, giving an average array occupancy, 〈n〉array = 3.3, or an average pore occupancy, 〈n〉pore = 0.00066.
Figure 1.

(A) Schematic diagram of the experimental configuration, where the potential of top ring electrode and bottom disk electrode were separately controlled by a potentiostat and a patch-clamp (pClamp) amplifier, respectively. (B) SEM image of an NEA with an area of 30 μm x 30 μm and ca. 5000 nanopores. Tilted plan view (C) and cross-sectional (D) SEM images of NEAs at higher magnification. The arrows in (D) indicate the composition of the MIM layers.
Once a nanoparticle-containing solution was placed on the array, the top ring electrode serves as a gate electrode, controlling the entry of nanoparticles into the interior of the nanopore. The potential of the top electrode (ETE) was set via potentiostat relative to a Pt quasi-reference electrode (QRE). Current transients corresponding to AgNP collisions on the bottom disk electrode were then recorded amperometrically by patch-clamp electrometer at high bandwidth and with a low noise background. The patch-clamp also controlled the potential of the bottom electrode (EBE). This unique design, i.e. two closely-placed, independently-controlled electrodes embedded in a nanopore array, was able to control the transport of nanoparticles and to detect nanoparticle collisions simultaneously.
2.2. Single-Electrode Mode
The collision of AgNPs on the bottom electrode of the NEA was first investigated with a floating top electrode, i.e. no applied voltage at ETE. Figure 2 shows amperometric traces recorded in the presence of a 80 pM Tris buffer solution (50 mM, pH 7.4) of 50 nm AgNPs in which the potential of bottom electrode (EBE) of NEAs was stepped from 0.0 V to +0.6 V vs. Pt QRE in 0.1 V increments. Amperometric traces were recorded at 50 kHz sampling rate with a 10 kHz low pass filter. At 0.0 V, no spikes were observed from AgNP-electrode collisions, and the noise level was below 20 pA. As EBE increased to +0.1 V, spikes with small peak current (ipeak < 100 pA) were observed, likely due to partial oxidation of a small number of AgNPs. Then a dramatic increase in the number of spikes was observed at EBE > +0.1 V. In all cases, the signal was easily distinguished from the background noise, and the background was always kept at a very small level with increasingly positive values of EBE. In addition to the clearly increasing number of spikes at higher voltage, the maximum peak current also changed with applied voltage; most peaks were below 500 pA at EBE = +0.2 V, increasing to a few nA at EBE = + 0.6 V. The frequency of oxidative spikes at EBE = +0.2 V, +0.3 V, +0.4 V and +0.5 V were 3.2 Hz, 2.8 Hz, 2.8 Hz and 3.8 Hz, respectively, i.e. roughly independent of EBE.
Figure 2.

Amperometric traces recorded at the bottom electrode obtained at EBE values from +0.0 V to +0.6 V vs. Pt QRE with ETE floating. All experiments were performed in Tris buffer (50 mM, pH 7.4) containing 80 pM AgNPs with average diameter ~ 50 nm.
If the frequency of collisions at the bottom electrode is dominated by diffusion of AgNPs from the bulk solution to the electrode surface, the theoretical collision frequency is given by:
| (1) |
where we assume each bottom electrode behaves like a recessed disk electrode.[51] Then the overall array collision frequency is obtained from the collision frequency in a single nanopore multiplied by the number of pores (Npore) in the array. CNP is the particle concentration (80 pM), rpore is the radius of the bottom electrode (60 nm), Npore is the number of nanopores in the array (~ 5000), NA is Avogadro’s number, and DNP is the diffusion coefficient of the particle, which is given by the Einstein-Smoluchowski relation:
| (2) |
where kB is the Boltzmann constant, T is the temperature (298 K), η is the solution viscosity (1.002 × 10⁻³ kg/s·m), and rNP is the radius of the AgNPs (25 nm). From eqn. (2), the calculated DNP = 8.71 × 10⁻¹² m2/s. Using this value of DNP in equation (1), the theoretical collision frequency is 7.2 s−1, larger than the observed values from EBE = +0.2 V to +0.5 V. The discrepancy between theoretical and experimental collision frequency at this voltage range could arise from several factors. (1) Equation 1 is strictly applicable for planar disk electrodes where nanoparticle collisions are driven solely by diffusion. Here, we assume that each bottom disk electrode behaves like a planar disk electrode without considering the effects of inner nanopore walls or adsorption to the top passivation layer.[63] It is, thus, likely that Eq. 1 overestimates the nanopore-confined collision frequency. (2) The assumption of 100% oxidation efficiency of nanoparticles diffusing to the electrode surface is likely optimistic, i.e. some AgNPs may collide with the surface but not produce a measurable current pulse - either because the duration was beyond the measurement bandwidth or the amount of oxidation was too small to observe. (3) Some nanopores may not have been completely etched to expose the entire surface of the bottom electrode. In support of these observations, a recent study by Oja et al. also produced an experimental collision frequency lower than the theoretical prediction.[51]
In order to quantitatively evaluate the AgNP collisions at different applied EBE values, peak analysis was performed on the oxidative AgNP spikes, the results of which are plotted as histograms in Figure 3. As the applied potential EBE is varied from +0.2 V, Figure 3(A), to +0.6 V, Figure 3(E), vs. Pt QRE the histograms show that the mean peak current (left column) increases, and its distribution becomes bimodal as EBE becomes more positive, before collapsing into a single broad peak at EBE = +0.6 V. As expected from the Butler-Volmer equation, the kinetics of AgNP oxidation are affected by applied potential, with more oxidizing potentials causing the AgNPs to exhibit distinct current distributions. Starting at EBE = +0.2 V, the peak current shows a single maximum near 0.3 nA. However, going to successively more positive potentials yields a clear second component centered at ~ 1 nA, which becomes the dominant component at EBE = +0.6 V. In concert, the peak duration distribution becomes narrower at successively higher EBE values. In addition, the integrated charge distribution exhibits two clear peaks at all potentials – one at ~0.15 pC, and another at ~0.55 pC as seen in the right column of Figure 3. The calculated value for complete charge transfer upon oxidation of the entire nanoparticle is ca. 0.5 pC, which is well matched to the experimentally observed value for the second peak in the charge distributions. At potentials below +0.6 V, the second peak in the charge distribution is assigned to incomplete oxidation. Other groups typically see incomplete oxidation of AgNPs on planar gold electrodes, which is also likely happening in the NEA device here.[50–52] In both histograms of peak current and charge transferred, a bimodal distribution is observed in the voltage range +0.3 V to +0.5 V. The lower peak current, below 500 pA, as well as the charge ≤ 0.2 pC, is direct evidence that some AgNPs undergo incomplete oxidation at lower potentials. Thus, at +0.2 V, only about 30% of each AgNP is oxidized during collision, while increasing to higher voltages drives the AgNPs to be more aggressively oxidized, until finally complete oxidation of most AgNPs is observed at +0.6 V.
Figure 3.

Histograms of peak current, pulse duration, and total charge of oxidative peaks derived from the amperometric traces in Figure 2 at EBE = (A) +0.2, (B) +0.3 V, (C) +0.4 V, (D) +0.5 V and (E) +0.6 V vs. Pt QRE. Solid lines are fits to one- or two-component Gaussian distributions. All experiments were performed in Tris buffer (50 mM, pH 7.4) containing 80 pM AgNPs with average diameter ~ 50 nm.
2.3. Double-Electrode Mode
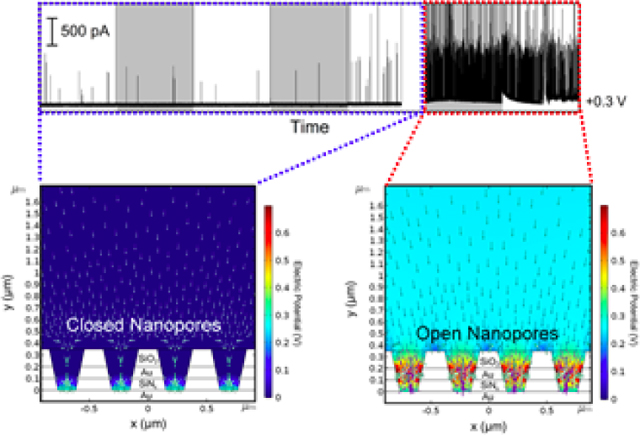
Previous research on molecular redox species indicates that ion accumulation inside NEAs is strongly dependent on surface charge, electrode potential, and nanopore size.[59,64] Logically then, this concept might be extended to control the motion of nanoparticles within attoliter-volume NEAs by adjusting these same parameters. To utilize the unique design of the NEAs, a potentiostat was used to control the top electrode potential ETE relative to a Pt QRE, rather than leaving the top electrode floating. A patch-clamp electrometer was again used to control EBE and measure the current from collision events at the bottom electrode. The amperometric traces in Figure 4(A) were recorded from 80 pM AgNP solution with average nanoparticle diameter of 80 nm. The potential of the top electrode, ETE, was stepped from +0.1 V to +0.7 V in 0.1 V increments, while EBE was fixed at +0.3 V, both potentials relative to independent Pt QREs. At low top electrode potentials from +0.1 V to +0.4 V, only sporadic peaks were observed, the frequency of which were almost unchanged relative to the non-gated data shown in Figure 2. The frequency independence indicates that the mobility of AgNPs inside the nanopore is not affected by the top electrode. In contrast, increasing ETE to +0.5 V or + 0.6 V resulted in a dramatic increase in the frequency of oxidative peaks, as clearly shown in Figure 4(A), indicating that the top electrode may serve as a voltage gate to control the access of AgNPs to the bottom electrode. The number of oxidative current peaks at ETE = +0.6 V and +0.5 V were 605 and 22, respectively, suggesting a particle rectification of 28 at EBE = +0.3 V. In order to test whether the change in peak frequency could be assigned unambiguously to the potential of the top electrode, a control experiment was performed in which the top electrode potential was allowed to float during the measurement, while keeping all other conditions constant. As expected, the frequency of oxidative current events showed no fluctuation over extended periods under these conditions confirming the gating function of the top ring electrode.
Figure 4.

(A) Representative amperometric traces from the bottom electrode obtained by applying different voltages, ranging from +0.1 V to +0.7 V vs. Pt QRE to the top electrode and at the same time fixing the bottom electrode of NEAs at +0.3 V. (B, C) Simulated electric field and particle trajectories of AgNPs in the nanopores under steady-state conditions. The finite element simulations were conducted by applying constant potential, ETE = 0.0 V (gate closed, (B)) or +0.7 V (gate open, (C)), while EBE was fixed at +0.3 V. All experiments were performed in Tris buffer (50 mM, pH 7.4) containing 80 pM AgNPs with average diameter ~ 80 nm.
Nanopores that exhibit ionic diode behavior, i.e. rectification, have attracted a great deal of attention. To further explore the possibility of using NEAs to achieve single-nanoparticle diode behavior, i.e. establishing a voltage threshold which could be used to control nanoparticle access to the nanopore, we performed simulations to examine the detailed particle position and velocity distributions. In single-electrode mode, nanoparticle-electrode collisions are mainly driven by diffusion, with a small contribution possibly coming from the electrostatic force between the nanoparticle and electrode. In contrast in double-electrode mode, the top electrode potential affects transport. Figures 4B and 4C show the simulated electric field and particle trajectories of AgNPs in the nanopores under steady-state conditions. Finite element simulations were conducted under a constant potential, ETE = 0.0 V (gate closed, Figure 4B) or + 0.7 V (gate open, Figure 4C), while EBE was fixed at +0.3 V. As Figure 4B illustrates, diffusion of AgNPs into the nanopores is limited under gate-closed conditions. This is expected, because the AgNPs are anionic and are repelled by the negatively charged nanopore surface. However, when ETE reaches more positive potentials (ETE > +0.6 V), the gate opens, allowing negatively charged AgNPs to enter the nanopores and be transported under a combination of diffusion and electric field-induced migration, Figure 4(C). The simulation results demonstrate that the positive top electrode potential not only gates the entry of AgNPs into the nanopore but also produces an electric field that assists nanoparticle transport once the nanoparticle enters the pore.
Given that Ag oxidation to Ag+ is the principal reaction at the bottom electrode, the question arises as to the fate of the Ag+ produced. One possibility is formation of AgCl using Cl- from the Tris-HCl buffer solution. Interestingly, the NEA devices display temporary shorting, evidenced by a sharp increase in the magnitude of some current spikes observed at potentials ETE ≥ +0.5 V, viz. Figure 4(A). A bimodal distribution of current spikes is observed with most spikes having magnitudes less than 500 pA at ETE ≤ +0.4 V, and a number of spikes exceeding 1 nA at higher potentials – especially at ETE ≥ +0.6 V. This is attributed to the temporary formation of nanoscale filaments between top and bottom electrodes, in which Ag+ produced by the oxidation of AgNPs forms AgCl in the nanopore, ultimately spanning the thickness of the 100 nm thick insulating layer (SiNx) between top and bottom electrodes, leading to a temporary shorting of the array. Another possibility is that temporary shorting is due to a concentration change of Ag+ within the nanopore resulting from AgNP oxidation to Ag+. Assuming the complete oxidation of a single 80 nm AgNP inside a nanopore with a pore volume of 13.8 attoliter, leads to a change in the Ag+ concentration from ≈0 to 1.88 M, shifting the actual redox potential to more positive values. Thus, the potential applied to oxidize AgNPs to Ag+ with no Ag+ in the background electrolyte is simultaneously negative enough to reduce Ag+ back to Ag when Ag+ accumulates to a very large concentration inside the nanopore. Ag nanofilaments formed in this way then tend to spontaneously break, as the Ag+ concentration in the nanopore decreases by outdiffusion and incorporation into the nascent nanofilament, thus reshifting the potential.
To investigate this effect further, Ag+ with different concentration, ranging from 50 μM to 5 mM, was added to the AgNP solution before measurement. In accordance with the hypothesis, AgNP solutions with additional Ag+ added were observed to produce a larger number of shorting events between the top and bottom electrode. In addition, as shown in the SEM image of an NEA after AgNP exposure, Figure S1(A), a significant amount of AgNPs was found aggregated in the NEA region, and electrodeposited Ag filled some nanopores, Figure S1(B). Aggregated AgNPs and electrodeposited Ag are both consistent with temporary shorting of the NEA electrodes. Shorted devices were observed to recover their original electrical isolation, if a positive overpotential was applied to both electrodes, or the Ag metal was exposed to a wet etch to remove the electrodeposited silver.
2.4. Effect of Electrode Potential
The dependence of particle rectification on electrode potential was investigated further to explore the existence of a voltage threshold for nanoparticle entry into NEAs. Figure 5 shows the influence of EBE on nanoparticle transport and collisions of 80 nm AgNPs (80 pM) at various values of the gating voltage, ETE, which was increased from +0.1 V to +0.7 V in 0.1 V steps every 60 s over the course of each run. Time traces for values of EBE from 0.0 V to +0.4 V are shown in Figure 5(A) to 5(E), respectively. The number of observed current peaks for current-time traces in Figure 5 is summarized in Table 1. For the lowest value of EBE, in Figure 5(A), only a few small magnitude (ipeak < 100 pA) peaks are evident at ETE < +0.4 V, with some peak currents reaching 500 pA at higher ETE. Fewer than 25 events were observed within 60 s, independent of EBE, indicating that the top electrode did not allow nanoparticle transport inside the NEAs. When EBE was increased to +0.1 V, in Figure 5(B), the number of observed current peaks was again relatively small, but increased substantially (17 to 54) at ETE = +0.7 V, suggesting an incipient voltage threshold at ETE between +0.6 V and +0.7 V for EBE = +0.1 V. In Figure 5(C) with EBE = +0.2 V, this behavior becomes more obvious, with a 5-fold increase (18 to 102) between ETE = +0.5 V and +0.6 V, and a dramatic increase (522 peaks) observed at yet higher potential (ETE = +0.7 V), giving a particle collision frequency of 8.7 s–1. Since the particle collision frequency observed in single-electrode mode was 3.2 s–1 at EBE = +0.2 V, the potential applied to the upper gate electrode introduces an additional enhancement of particle transport, most likely arising from electric field-induced migration.
Figure 5.

Amperometric traces obtained at the bottom electrode by applying different voltages, ranging from +0.1 V to +0.7 V vs. Pt QRE to the top electrode and at the same time fixing the bottom electrode potential at: (A) 0.0 V, (B) +0.1 V, (C) +0.2 V, (D) +0.3 V and (E) +0.4 V. All experiments were performed in Tris buffer (50 mM, pH 7.4) containing 80 pM AgNPs with average diameter ~ 80 nm.
Table 1.
Number of peaks derived from amperometric traces in Figure 5.
| Potential (vs Pt QRE) | ETE | |||||||
|---|---|---|---|---|---|---|---|---|
| +0.1 V | +0.2 V | +0.3 V | +0.4 V | +0.5 V | +0.6 V | +0.7 V | ||
| EBE | 0.0 V | 12 | 14 | 23 | 23 | 9 | 10 | 18 |
| +0.1 V | 17 | 12 | 14 | 4 | 14 | 17 | 54 | |
| +0.2 V | 16 | 14 | 7 | 11 | 18 | 102 | 522 | |
| +0.3 V | 12 | 8 | 3 | 2 | 22 | 605 | 496 | |
| +0.4 V | 43 | 60 | 43 | 51 | 295 | 244 | 59 | |
Similarly, extending the value of EBE to higher potentials produces a shift in the observed threshold, as indicated by the dashed line in Figure 5. Furthermore, the number of temporary shorting events, evidenced by current spikes in excess of 2 nA, increases with increasing bottom electrode potential, cf. the number of large current spikes increases dramatically upon increasing ETE from +0.6 V to +0.7 V at EBE = +0.2 V as shown in Figure 5(C). This trend continues at higher EBE until +0.4 V, where a decrease in the number of peaks is observed, likely due to the blockage/accumulation of AgNPs inside the NEAs in concert with the observation of temporary shorting events (Figure 5(E)). As shown in Figure S1(B), accumulation of AgNPs reduces the capacity of NEAs to allow entry of additional nanoparticles, thereby decreasing the number of observed current spikes. Overall, the voltage threshold for nanoparticle rectification was found to depend on both bottom and top electrode potentials. In addition, the gating behavior was reflected both in the frequency of nanoparticle-electrode encounters and in the number of high current magnitude spikes attributed to temporary shorting events.
2.5. Effect of Nanoparticle Size
If a combination of electrode gating and permselectivity is indeed the operative mechanism, the size of the nanoparticle should also affect the rectification behavior. Figure 6 shows amperometric traces at the bottom electrode of NEAs obtained with AgNPs of three different sizes - 80 nm, 50 nm, and 30 nm, in Figures 6(A), (B), and (C), respectively. ETE was increased from +0.1 V to +0.7 V in steps of +0.1 V every 60 s, while EBE was fixed at +0.2 V in all three experiments. In Figure 6(A), a threshold is observed between ETE = +0.6 V and +0.7 V for 80 nm AgNPs. As shown in Figure 6(B), the voltage threshold decreased with smaller AgNPs (50 nm), to between ETE = +0.5 V and +0.6 V. Decreasing the nanoparticle size further proves difficult, as the voltage-gated behavior became less obvious for 30 nm AgNPs, where only a small increase in peak frequency was found between ETE = +0.2 V and +0.3 V, as shown in Figure 6(C). Thus, the particle rectification ratio diminished with decreasing AgNP size, going from 5.7 with 80 nm AgNPs, to 3.1 for 50 nm AgNPs, and only 1.3 for 30 nm AgNPs at EBE = +0.2 V. The diameters of top electrode and bottom electrodes in these experiments were 175nm and 120 nm, respectively, which is only 1–2 times larger than 80 nm AgNPs, but 4–6 times larger than the 30 nm nanoparticles. Consequently, larger nanoparticles exhibit more obvious confinement effects, and the applied potential at both electrodes affects the larger nanoparticles to a greater extent, resulting in larger particle rectification ratios compared with smaller particles.
Figure 6.

Amperometric traces obtained at the bottom electrode by applying different voltages, ranging from +0.1 V to +0.7 V vs. Pt QRE to the top electrode and at the same time fixing the bottom electrode of NEAs at +0.2 V. Experiments performed with solutions containing 80 pM AgNPs with average diameters of (A) 80 nm, (B) 50 nm and (C) 30 nm, respectively. All experiments were performed in Tris buffer (50 mM, pH 7.4).
In order to explore the driving forces for nanoparticle motion under these conditions, we collected amperometric traces of 50 nm AgNPs and 30 nm AgNPs at different potential values for top and bottom electrodes. As shown in Figure S2, the transport of 50 nm AgNPs within NEAs was controlled by the potential of both electrodes, i.e. a higher voltage threshold was observed when EBE was lower and vice versa. By comparing the particle rectification ratios of 50 nm AgNPs with the values in Figure 5, we found that voltage-gating was not as strong for 50 nm AgNPs as it was for 80 nm AgNPs. As expected, the voltage-gating behavior was even weaker for 30 nm AgNPs, Figure S3. The voltage gating behavior is a strong function of the particle diameter, with the highest rectification observed for nanoparticles approaching the electrode diameter.
3. Conclusion
Achieving control over the kinetics of single-nanoparticle redox processes is challenging, yet it is motivated by its relevance to advanced technologies, e.g. electrocatalysis. In this work, we develop and demonstrate a nanopore-based system to control the transport of nanoparticles for subsequent in situ characterization of nanoparticle collisions. The experimental NEA system consists of an array of nanopores, each with two closely placed but vertically separated and individually-addressable electrodes. Because of attoliter-scale nanoconfinement, nanoparticles entering the nanopores display different collision dynamics compared to the more widely-used planar ultramicroelectrodes. By simultaneously controlling the potentials applied to both top and bottom electrodes, it was possible to control access of nanoparticles to the bottom electrode, with the current spike frequency typically exhibiting a voltage threshold, characteristic of the (ETE, EBE) pair. Finite-element simulations revealed that transport within the pore was largely controlled by the intra-pore electric field. The dependence of the threshold electrode potential on the “gate” electrode voltage and the size of nanoparticles was explored in detail, showing that increased EBE values and larger nanoparticles produced larger rectification ratios. The maximum rectification ratio observed under optimal conditions was 28. Overall, this study provides a robust and versatile way to control the motion of nanoparticles within nanopores by mimicking the functionality of biological voltage-gated ion channels. The behavior observed in NEAs with the ability to manipulate nanoparticle access to - and dynamics in - confined nanostructures moves us closer to realizing nanocontrolled, biomimetic nanopore-based systems.
4. Experimental Section
Chemicals and Materials.
Tris(hydroxymethyl)aminomethane (Tris) and hydrochloric acid (HCl) were purchased from Sigma-Aldrich and used as received. The 50 mM Tris-HCl buffer solution was prepared by dissolving the Tris powder in deionized water (18.2 MΩ cm, Milli-Q Gradient System) and then adjusting the pH to 7.4 by adding 0.5 M HCl. Colloidal silver nanoparticle (AgNPs) solutions supplied in 2 mM citrate buffer (pH 7.4) were obtained from Ted Pella, Inc. The particle concentrations of 30 nm, 50 nm and 80 nm AgNPs were 1.3 × 10¹¹ particles mL−1 (216 pM), 2.9 × 10¹⁰ particles mL−1 (48 pM), and 7.1 × 10⁹ particles mL−1 (12 pM), respectively. In order to make these solutions the same concentration, AgNP solutions were centrifuged at 12000 rpm for 40 min, and the supernatants were discarded. Thereafter, the 50 mM Tris-HCl buffer (pH 7.4) solution was added with different volumes into the AgNP precipitates, producing 80 pM solutions of all three particle sizes. All AgNP solutions were prepared immediately before each measurement to avoid particle aggregation. The 460 nm polystyrene (PS) beads used for the nanosphere lithography were purchased from Sigma-Aldrich. Precleaned glass slides (Schott Nexterion), photoresist S1813 (Shipley), photoresist developer (Microchemicals), chromium and gold etchant (Sigma-Aldrich) used for device fabrication were all purchased and used as received.
Device Fabrication and Characterization.
The nanopore electrode arrays (NEAs) were fabricated according to previously reported procedures.[59,62] Briefly, metal deposition, photolithography and wet etching were used to define the bottom and top electrodes, which were separated by an insulating layer of silicon nitride (SiNx) through plasma-enhanced chemical vapor deposition (PECVD 790, Plasma-Therm). Then a passivation layer of SiO2 was coated on this MIM stack. Thereafter, nanosphere lithography, including monolayer coating of PS beads, O2 plasma etching, Cr deposition and PS beads removal, was applied to achieve a nanoporous Cr mask on the SiO2 layer. Finally, a multi-step reactive ion etching (RIE) process was used to obtain NEAs with recessed ring disk geometry by successively etching the SiO2 layer, top electrode layer and middle SiNx. Scanning electron microscopy (SEM) images were obtained on an FEI-Helios Dual Beam 600 at an accelerating voltage of 5 kV. Prior to imaging, all samples were sputter-coated with 2.5 nm iridium to avoid surface charging. The cross-sectional SEM images were acquired by depositing a protective Pt layer on the selected region of NEAs and gradually slicing the tilted sample with a focused ion beam.
Modeling and Calculations.
Numerical calculations were performed with a finite element method using COMSOL Multiphysics version 5.2. We used the ‘Electrostatics’, and ‘Charged Particle Tracing’ physics of COMSOL in a time-dependent mode to obtain the AgNP trajectories. An NEA of 10 nanopores was simulated in a 2D geometry, consisting of recessed disk electrodes, a 100 nm thick insulating layer, a 100 nm thick ring electrode layer, and a 150 nm top insulator layer. The geometry was adapted to match scanning electron micrographs (SEMs) of FIB cross-sections. The domain above the pores was drawn sufficiently large (w = 1000 μm, h = 1000 μm) to avoid interference from boundaries, and the mesh was refined both within the nanopores and in the region just above the pores to provide sufficient resolution. In this work, the SiNx and SiO2 pore walls were assigned a surface charge density, ρsurface = –1 mC/m2.
Electrochemical Measurements.
Considering the importance of high bandwidth and low background noise detection, we used an Axopatch 200B (Molecular Devices) patch-clamp electrometer to collect the amperometric traces of AgNP redox processes. Data acquisition with the patch-clamp electrometer was possible out to 50 kHz with noise level below 20 pA. The single AgNP experiments were carried out using the patch-clamp amplifier together with a high-resolution, low-noise digitizer (Digidata 1440A, Molecular Devices). The headstage of the patch-clamp electrometer was connected to the bottom electrode of NEA as the working electrode, while a Pt wire was used as the counter/quasi-reference electrode. Voltage-gated experiments were performed by integrating a potentiostat (760E, CH Instruments) into the patch-clamp system to independently control the voltage of the top electrode of the NEA. A second Pt wire was used as the counter/quasi-reference for the potentiostatically-controlled electrodes. The patch-clamp and potentiostat shared the same ground (electrode). The pClamp 10 software (Molecular Devices) stimulated the voltage input to the bottom electrode, recorded the amperometric trace, and simultaneously triggered the potentiostat to apply voltage and then record the current of the top electrode. The patch-clamp was used in V-Clamp mode with a sampling rate of 50 kHz and the built-in 4-pole Bessel filter was set to 10 kHz and 1 kHz for single-electrode mode or double-electrode mode, respectively. All amperometric traces were analyzed and calculated by Clampfit 10 software (Molecular Devices) to find the current spikes, charges and duration times through its “baseline correction” and “event detection” functions. Then the histograms of current spikes and their Gaussian fits were obtained by OriginPro 9.0 software. The instrumentation was placed completely within a well-shielded Faraday cage.
Supplementary Material
Acknowledgements
K. F. and D. H. contributed equally to this work. This work was supported by the National Science Foundation grant (CHEM-1404744) and the Defense Advanced Research Projects Agency grant (FA8650-15-C-7546). G. M. C. was supported by a NASA Space Technology Research Fellowship (NNX16AM45H). We gratefully acknowledge Dr. Chaoxiong Ma, Dr. Ceming Wang and Dr. Yi-Lun Ying for helpful discussions and suggestions during this research. We also acknowledge the Notre Dame Nanofabrication Facility and Integrated Imaging Facility for supporting fabrication and structural characterization of the devices studied here.
Footnotes
Supporting Information
Supporting Information is available from the Wiley Online Library or from the author.
Contributor Information
Kaiyu Fu, Department of Chemistry and Biochemistry, University of Notre Dame, Notre Dame, IN 46556, US.
Dr. Donghoon Han, Department of Chemical and Biomolecular Engineering, University of Notre Dame, Notre Dame, IN 46556, US
Garrison M. Crouch, Department of Chemical and Biomolecular Engineering, University of Notre Dame, Notre Dame, IN 46556, US
Dr. Seung-Ryong Kwon, Department of Chemical and Biomolecular Engineering, University of Notre Dame, Notre Dame, IN 46556, US
Paul W. Bohn, Department of Chemistry and Biochemistry, University of Notre Dame, Notre Dame, IN 46556, US; Department of Chemical and Biomolecular Engineering, University of Notre Dame, Notre Dame, IN 46556, US.
References
- [1].Han D, Crouch GM, Fu K, Zaino LP III, Bohn PW, Chem. Sci 2017, 8, 5345. [DOI] [PMC free article] [PubMed] [Google Scholar]
- [2].Goldschen-Ohm MP, White DS, Klenchin VA, Chanda B, Goldsmith RH, Angew. Chem. Int. Ed 2017, 56, 2399. [DOI] [PMC free article] [PubMed] [Google Scholar]
- [3].Cherf GM, Lieberman KR, Rashid H, Lam CE, Karplus K, Akeson M, Nat. Biotechnol 2012, 30, 344. [DOI] [PMC free article] [PubMed] [Google Scholar]
- [4].Manrao EA, Derrington IM, Laszlo AH, Langford KW, Hopper MK, Gillgren N, Pavlenok M, Niederweis M, Gundlach JH, Nat. Biotechnol 2012, 30, 349. [DOI] [PMC free article] [PubMed] [Google Scholar]
- [5].Kennedy E, Dong Z, Tennant C, Timp G, Nat. Nanotechnol 2016, 11, 968. [DOI] [PubMed] [Google Scholar]
- [6].Wei R, Gatterdam V, Wieneke R, Tampe R, Rant U, Nat. Nanotechnol 2012, 7, 257. [DOI] [PubMed] [Google Scholar]
- [7].Firnkes M, Pedone D, Knezevic J, Döblinger M, Rant U, Nano Lett. 2010, 10, 2162. [DOI] [PubMed] [Google Scholar]
- [8].Shi W, Friedman AK, Baker LA, Anal. Chem 2017, 89, 157. [DOI] [PMC free article] [PubMed] [Google Scholar]
- [9].Kowalczyk SW, Blosser TR, Dekker C, Trends Biotechnol. 2011, 29, 607. [DOI] [PubMed] [Google Scholar]
- [10].Hou X, Zhang H, Jiang L, Angew. Chem. Int. Ed 2012, 51, 5296. [DOI] [PubMed] [Google Scholar]
- [11].Amiri H, Shepard KL, Nuckolls C, Hernández Sánchez R, Nano Lett. 2017, 17, 1204. [DOI] [PMC free article] [PubMed] [Google Scholar]
- [12].Harrell CC, Kohli P, Siwy Z, Martin CR, J. Am. Chem. Soc 2004, 126, 15646. [DOI] [PubMed] [Google Scholar]
- [13].Siwy ZS, Adv. Funct. Mater 2006, 16, 735. [Google Scholar]
- [14].Xiao K, Xie G, Zhang Z, Kong X-Y, Liu Q, Li P, Wen L, Jiang L, Adv. Mater 2016, 28, 3345. [DOI] [PubMed] [Google Scholar]
- [15].Zhang Z, Kong XY, Xiao K, Liu Q, Xie G, Li P, Ma J, Tian Y, Wen L, Jiang L, J. Am. Chem. Soc 2015, 137, 14765. [DOI] [PubMed] [Google Scholar]
- [16].Zhang H, Hou X, Hou J, Zeng L, Tian Y, Li L, Jiang L, Adv. Funct. Mater 2015, 25, 1102. [Google Scholar]
- [17].Jiang Y, Liu N, Guo W, Xia F, Jiang L, J. Am. Chem. Soc 2012, 134, 15395. [DOI] [PubMed] [Google Scholar]
- [18].Liu Q, Wen L, Xiao K, Lu H, Zhang Z, Xie G, Kong X-Y, Bo Z, Jiang L, Adv. Mater 2016, 28, 3181. [DOI] [PubMed] [Google Scholar]
- [19].Yu R-J, Ying Y-L, Hu Y-X, Gao R, Long Y-T, Anal. Chem 2017, 89, 8203. [DOI] [PubMed] [Google Scholar]
- [20].Zhang J-H, Liu X-L, Hu Z-L, Ying Y-L, Long Y-T, Chem. Commun 2017, 53, 10176. [DOI] [PubMed] [Google Scholar]
- [21].Freedman KJ, Haq SR, Fletcher MR, Foley JP, Jemth P, Edel JB, Kim MJ, ACS Nano 2014, 8, 12238. [DOI] [PubMed] [Google Scholar]
- [22].Ito T, Sun L, Henriquez RR, Crooks RM, Acc. Chem. Res 2004, 37, 937. [DOI] [PubMed] [Google Scholar]
- [23].Lan W-J, Holden DA, Zhang B, White HS, Anal. Chem 2011, 83, 3840. [DOI] [PubMed] [Google Scholar]
- [24].Ito T, Sun L, Crooks RM, Anal. Chem 2003, 75, 2399. [DOI] [PubMed] [Google Scholar]
- [25].Davenport M, Healy K, Pevarnik M, Teslich N, Cabrini S, Morrison AP, Siwy ZS, Létant SE, ACS Nano 2012, 6, 8366. [DOI] [PubMed] [Google Scholar]
- [26].Qiu Y, Yang C, Hinkle P, Vlassiouk IV, Siwy ZS, Anal. Chem 2015, 87, 8517. [DOI] [PubMed] [Google Scholar]
- [27].Qiu Y, Vlassiouk I, Hinkle P, Toimil-Molares ME, Levine AJ, Siwy ZS, ACS Nano 2016, 10, 3509. [DOI] [PubMed] [Google Scholar]
- [28].Cheng W, Compton RG, Trends Anal. Chem 2014, 58, 79. [Google Scholar]
- [29].Anderson TJ, Zhang B, Acc. Chem. Res 2016, 49, 2625. [DOI] [PMC free article] [PubMed] [Google Scholar]
- [30].Peng Y-Y, Qian R-C, Hafez ME, Long Y-T, ChemElectroChem 2017, 4, 977. [Google Scholar]
- [31].Quinn BM, van ‘t Ho PG, Lemay SG, J. Am. Chem. Soc 2004, 126, 8360. [DOI] [PubMed] [Google Scholar]
- [32].Fosdick SE, Anderson MJ, Nettleton EG, Crooks RM, J. Am. Chem. Soc 2013, 135, 5994. [DOI] [PubMed] [Google Scholar]
- [33].Boika A, Thorgaard SN, Bard AJ, J. Phys. Chem. B 2013, 117, 4371. [DOI] [PubMed] [Google Scholar]
- [34].Dasari R, Robinson DA, Stevenson KJ, J. Am. Chem. Soc 2013, 135, 570. [DOI] [PubMed] [Google Scholar]
- [35].Guo Z, Percival SJ, Zhang B, J. Am. Chem. Soc 2014, 136, 8879. [DOI] [PubMed] [Google Scholar]
- [36].Castaneda AD, Robinson DA, Stevenson KJ, Crooks RM, Chem. Sci 2016, 7, 6450. [DOI] [PMC free article] [PubMed] [Google Scholar]
- [37].Stuart EJE, Tschulik K, Batchelor-McAuley C, Compton RG, ACS Nano 2014, 8, 7648. [DOI] [PubMed] [Google Scholar]
- [38].Sokolov SV, Bartlett TR, Fair P, Fletcher S, Compton RG, Anal. Chem 2016, 88, 8908. [DOI] [PMC free article] [PubMed] [Google Scholar]
- [39].Xiao X, Bard AJ, J. Am. Chem. Soc 2007, 129, 9610. [DOI] [PubMed] [Google Scholar]
- [40].Zhou YG, Rees NV, Compton RG, Angew. Chem. Int. Ed 2011, 50, 4219. [DOI] [PubMed] [Google Scholar]
- [41].Cheng W, Compton RG, Angew. Chem. Int. Ed 2014, 53, 13928. [DOI] [PubMed] [Google Scholar]
- [42].Cheng W, Compton RG, ChemElectroChem 2016, 3, 2017. [Google Scholar]
- [43].Dick JE, Hilterbrand AT, Boika A, Upton JW, Bard AJ, Proc. Natl. Acad. Sci. U.S.A 2015, 112, 5303. [DOI] [PMC free article] [PubMed] [Google Scholar]
- [44].Dick JE, Hilterbrand AT, Strawsine LM, Upton JW, Bard AJ, Proc. Natl. Acad. Sci. U.S.A 2016, 113, 6403. [DOI] [PMC free article] [PubMed] [Google Scholar]
- [45].Ying Y-L, Long Y-T, Sci. China: Chem 2017, 60, 1187. [Google Scholar]
- [46].Zhou XF, Cheng W, Compton RG, Angew. Chem. Int. Ed 2014, 53, 12587. [DOI] [PubMed] [Google Scholar]
- [47].Cheng W, Compton RG, Angew. Chem. Int. Ed 2016, 55, 2545. [DOI] [PubMed] [Google Scholar]
- [48].Dick JE, Renault C, Kim BK, Bard AJ, Angew. Chem. Int. Ed 2014, 53, 11859. [DOI] [PubMed] [Google Scholar]
- [49].Kim BK, Kim J, Bard AJ, J. Am. Chem. Soc 2015, 137, 2343. [DOI] [PubMed] [Google Scholar]
- [50].Ma W, Ma H, Chen J-F, Peng Y-Y, Yang Z-Y, Wang H-F, Ying Y-L, Tian H, Long YT, Chem. Sci 2017, 8, 1854. [DOI] [PMC free article] [PubMed] [Google Scholar]
- [51].Oja SM, Robinson DA, Vitti NJ, Edwards MA, Liu Y, White HS, Zhang B, J. Am. Chem. Soc 2017, 139, 708. [DOI] [PubMed] [Google Scholar]
- [52].Ustarroz J, Kang M, Bullions E, Unwin PR, Chem. Sci 2017, 8, 1841. [DOI] [PMC free article] [PubMed] [Google Scholar]
- [53].Kang M, Perry D, Kim YR, Colburn AW, Lazenby RA, Unwin PR, J. Am. Chem. Soc 2015, 137, 10902. [DOI] [PubMed] [Google Scholar]
- [54].Mirkin MV, Sun T, Yu Y, Zhou M, Acc. Chem. Res 2016, 49, 2328. [DOI] [PubMed] [Google Scholar]
- [55].Panday N, Qian G, Wang X, Chang S, Pandey P, He J, ACS Nano 2016, 10, 11237. [DOI] [PubMed] [Google Scholar]
- [56].Hao R, Fan Y, Zhang B, J. Am. Chem. Soc 2017, 139, 12274. [DOI] [PubMed] [Google Scholar]
- [57].Zhou M, Yu Y, Hu K, Xin HL, Mirkin MV, Anal. Chem 2017, 89, 2880. [DOI] [PubMed] [Google Scholar]
- [58].Ma C, Contento NM, Bohn PW, J. Am. Chem. Soc 2014, 136, 7225. [DOI] [PubMed] [Google Scholar]
- [59].Fu K, Han D, Ma C, Bohn PW, Nanoscale 2017, 9, 5164. [DOI] [PubMed] [Google Scholar]
- [60].Fu K, Bohn PW, ACS Appl. Mater. Interfaces 2017, 9, 24908. [DOI] [PubMed] [Google Scholar]
- [61].Ma C, Contento NM, Gibson LR, Bohn PW, ACS Nano 2013, 7, 5483. [DOI] [PubMed] [Google Scholar]
- [62].Fu K, Han D, Ma C, Bohn PW, Faraday Discuss. 2016, 193, 51. [DOI] [PubMed] [Google Scholar]
- [63].Ortiz-Ledón CA, Zoski CG, Anal. Chem 2017, 89, 6424. [DOI] [PubMed] [Google Scholar]
- [64].Ma C, Xu W, Wichert WRA, Bohn PW, ACS Nano 2016, 10, 3658. [DOI] [PubMed] [Google Scholar]
Associated Data
This section collects any data citations, data availability statements, or supplementary materials included in this article.