

Abstract
Lipid species possess very different structures, leading to their very diversified cellular functions in biological systems. Lipidomics represents a powerful technology for deep analysis of hundreds to thousands of intact lipid molecular species. In the current study, a cluster of unknown ion peaks was displayed when we profiled cerebroside species in rat spinal cord samples by neutral loss scan of 162 Da in the positive ion mode using a multi-dimensional mass spectrometry-based shotgun lipidomics strategy. In order to identify the structural identities of these unknown ion peaks, MS2 and MS3 analyses of these ions were performed by high mass resolution mass spectrometry. Extensive lines of evidence allowed us to identify that these unknown ion peaks were monohexosyl alkyl-acyl glycerol (HAAG) species, including their sn-positional isomers and alkyl-acyl compositional isomers. We also applied the developed method to identify and quantify HAAG species present in a variety of mouse nerve tissues. We believe that the first kind of lipidomics study on HAAG species present in mammalian nerve tissue samples provided the foundation for future biological research in this unknown area.
Keywords: Glycolipids, lipids, mass spectrometry, monohexosyl alkyl-acyl glycerol, neurodegeneration, shotgun lipidomics
1. Introduction
Lipidomics has become a powerful tool for neuroscience research since the early development stage of this discipline [1]. This is mainly due to the importance and complication of the brain in the body as it is the second-highest lipid to protein ratio (next to adipocytes) and represents the organ containing the most diversified classes, subclasses, and individual molecular species of lipids in mammals [1, 2]. Lipidomics offers a comprehensive analysis of lipid content and composition, as well as their interactions in a large-scale analysis of cellular lipids [3, 4]. In this research arena, multi-dimensional mass spectrometry-based shotgun lipidomics (MDMS-SL), which is pioneered by our laboratories [5–9], has its unique advantage to identify and quantify lipid species from a small amount of source material in a high-throughput fashion.
A group of lipid species of any class which contains at least one monosaccharide group is commonly categorized as glycolipids [10]. They are very rich in plants, bacteria, and mammalian brains. These lipids are essential components of cellular membranes to maintain cell stability, such as in plant cell walls and brain myelin sheath. Glycolipids also play numerous essential functions. For example, they are essential for specific cellular contacts, signal transduction, as well as cell aggregation and dissociation, where they serve as receptors [11]. The most common glycolipids in brain cellular membranes are glycosphingolipids (e.g., cerebrosides and gangliosides) and glyceroglycolipids (e.g., galactosyl diacylglycerol), which have a monosaccharide or oligosaccharide moiety and aliphatic chains connected to sphingoid and glycerol backbones, respectively.
Glycosphingolipids are abundantly presented in both plasma membrane and myelin sheath in nerve tissue and play significant roles in cell function and signaling [12]. For instance, cerebrosides are a major form of glycosphingolipids present in high content in nerve cell membranes [13]. They consist of ceramide with a monosaccharide residue at the 1-hydroxy moiety and could be readily characterized by a neutral loss scan (NLS) of 162 Da (corresponding to the loss of the sugar residue) from their lithium adducts in the positive ion mode in MS analysis [14].
It was surprising that there existed a cluster of unknown peaks in the mass spectra of NLS162 when we performed MS analysis of cerebrosides by NLS 162 Da from rat spinal cord lipid extracts. The conducted analysis suggested that these unknown ions are likely glycolipids and possibly contain a moiety of monosaccharide. Moreover, these species should be glycerolglycolipids based on their accurate masses and the nitrogen rule. Herein, we present our findings on characterizing these unknown peaks from nerve tissue using an MDMS-SL strategy. These species are named as monohexosyl alkyl (alkenyl)-acyl glycerol (HAAG) species based on the structural characterization by MS analysis. In the study, we also used iodine to derivatize the lipid extract to confirm that vinyl ether-containing HAAG species was absent in rat and mouse nerve tissues at the detection limit. Finally, we applied the aforementioned method to analyze the HAAG species in mouse nerve tissue samples quantitatively. We believe the current study represents the first kind of lipidomics research on ether-containing glycolipids in brain tissue samples. It should be pointed out that we did not use the standard of HAAG to confirm the characterization of structure due to its commercial unavailability.
2. Materials and Methods
2.1. Materials
The internal standard N-pentadecanoyl cerebroside (N15:0 CBS) was obtained from Matreya, Inc. (Pleasant Gap, PA). The internal standard 1,2-dipalmitoleoyl-sn-glycero-3-phosphoethanolamine (PE (16:1/16:1)) was purchased from Avanti Polar Lipids, Inc. (Alabaster, AL). Iodine was purchased from Jade Scientific (Westland, MI). All solvents used for lipid extraction and sample preparation (including chloroform, methanol, and isopropanol) were obtained from Fisher Scientific (Pittsburgh, PA). Lithium chloride and lithium hydroxide were purchased from Sigma-Aldrich Chemical Co. (St. Louis, MO). Pierce™ BCA Protein Assay Kit was purchased from Fisher Scientific (Pittsburgh, PA). Precellys®24 Homogenizer and homogenizing ceramic beads kit (2 mL) from Bertin Instruments (Rockville, MD) were used for sample homogenization. N-EVAP nitrogen evaporator (24 positions) was from Organomation Associates, Inc. (Berlin, MA).
2.2. Animals
Wild type mice and rat (male) were purchased from the Jackson Laboratory (Bar Harbor, ME). They were fed with a standard rodent chow diet and water ad libitum, and housed with 12-h light/dark cycles at 20-22 °C. Animals were euthanized by asphyxiation with CO2, followed by decapitation. All nerve tissue samples were collected and immersed into liquid nitrogen immediately, and finally stored at −80 °C until lipid extraction and analysis. All animal procedures performed in the study were approved by the Institutional Animal Care and Use Committee at the University of Texas Health Science Center at San Antonio.
2.3. Preparation of lipid extracts
Mouse cerebrum, brain stem, spinal cord, and sciatic nerve tissue samples, as well as rat spinal cord, were homogenized in 10-times diluted PBS through Precellys®24 Homogenizer at 6,000 rpm for 20 sec and paused for 10 sec at 4 °C. The entire run was repeated three times. The protein content of individual homogenates was determined with a Pierce BCA assay kit. The rest of the homogenate was transferred into a disposable glass culture test tube for lipid extraction. For quantification of lipid species, a mixture of internal lipid standards was added prior to lipid extraction. Lipid extraction was performed with a modified procedure of Bligh and Dyer extraction, as previously described [15, 16]. In brief, a certain amount of internal standards based on the protein concentration of the individual sample prior to lipid extraction was added into different samples. The lipid content could be normalized to the protein content and quantified directly. Chloroform/methanol/50 mM lithium chloride water solution (v/v/v, 1/1/1) was added into each sample and vortexed for 1 min. Then all the samples were centrifuged at 4,000 x g for 10 min at room temperature. The chloroform layer of individual sample was collected into a new glass test tube, and this procedure was repeated once by adding the same volume of chloroform. The chloroform layer was combined and the solvent was evaporated under a nitrogen stream. The lipid residues were re-extracted with the aforementioned protocol with chloroform/methanol/10 mM lithium chloride water solution (v/v/v, 1/1/1). Finally, the lipid extracts were separately resuspended with a volume of 500 μL of chloroform/methanol (1:1, v/v) per mg of original tissue protein. Individual lipid solution was flushed with nitrogen, capped, and stored at −20 °C for lipid analysis. Individual lipid extract was further diluted with chloroform/methanol/isopropanol (1/2/4, v/v/v) prior to direct infusion for MS analysis.
2.4. Determination of plasmenyl vinyl ether bonds via derivatization with iodine and methanol
An aliquot of lipid extract (20 μL of stock solution) with internal standards including PE (16:1/16:1) was dried under a stream of nitrogen, then resuspended in 100 μL ice-cold chloroform/methanol (v/v, 2/1) with 2 mM ammonium bicarbonate and 0.167 mM iodine [17]. The mixture solution was incubated in an ice bath for 5 min, and the solvent was dried under a stream of nitrogen. Individual residue was re-dissolved in 100 μL of chloroform/methanol (v/v, 1/1) and further diluted with chloroform/methanol/isopropanol (v/v/v, 1/2/4) containing lithium hydroxide for MS analysis. The lithium hydroxide solution was made of 4,000-times dilution of a saturated methanol solution of lithium hydroxide.
2.5. Instrumentation
The mass spectrometric analysis was performed on a QqQ mass spectrometer (Thermo TSQ Quantiva, San Jose, CA) and a linear ion trap mass spectrometer (Thermo LTQ Orbitrap XL, San Jose, CA) equipped with an automated nanospray ion source device (TriVersa NanoMate, Advion Bioscience Ltd., Ithaca, NY) as described previously [18].
2.6. Data processing and analysis
All mass spectral data were automatically acquired by a customized sequence subroutine operated under Xcalibur software [18]. Data processing was conducted as described [19], based on the principles of shotgun lipidomics such as selective ionization, low concentration of lipid solution, and correction for differential kinetics of fragmentation [20, 21]. All data are presented as the means ± SEM from five animals.
3. Results and Discussion
3.1. Identification of monohexosyl alkyl (alkenyl)-acyl glycerol (HAAG)
As well known, the structure of cerebroside species contains a monosaccharide residue, and this sugar residue is readily lost from their lithium adducts, as demonstrated by MDMS-SL [14]. Therefore, all the species of cerebrosides can be easily detected via mass spectral analysis of NLS162 as structurally illustrated the neutral loss of the sugar residue from the lithium adduct of N18:0 CBS in the positive ion mode of ESI-MS analysis along with a mass spectrum of NLS162 from lipid extracts of rat spinal cord (Figure 1). In the spectrum, the most left ion peak at m/z 692.7 represents the lithium adduct of internal standard N15:0 CBS. Other endogenous cerebroside species present in rat spinal cord, as indicated, were presented in the right region of the mass spectrum. However, unexpectedly, the NLS162 mass spectrum displayed numerous unknown peaks in the region between m/z 715 to m/z 785 as highlighted with red frames, which could not be assigned to cerebroside species and represent lipid species previously not reported/identified.
Figure 1.

Illustration of structural loss of 162 Da from d18:1/18:0 cerebroside (N18:0 CBS) and of mass spectral loss of 162 Da from a lipid extract of rat spinal cord, respectively. Top, highlight the loss of a sugar residue (as indicated NLS 162 Da in red) from lithiated CBS species. Bottom, NLS162 mass spectrum displayed the known N15:0 CBS as an internal standard and endogenous cerebroside species present in a lipid extract of rat spinal cord in the mass region from m/z 780 to 880. The mass spectrum also unexpectedly detected several clusters of unknown peaks, as indicated with red frames.
In order to determine the identities of these unknown peaks, MS2 product ion analyses of the ions at m/z 721, 723, 749, 751, 777, and 779 were performed using a linear ion trap mass spectrometer, and the energy of collision-induced dissociation (CID) was in the range from 35 to 40 eV. In addition to the presence of an abundant fragment ion at m/z 559, 561, 587, 589, 615, and 617, respectively, in MS2 mass spectra, corresponding to the neutral loss of 162 Da from these unknown peaks as anticipated. A common fragment ion was detected at m/z 467 in MS2 mass spectra (Figure 2), as well as some low abundance fragments around m/z 467, which each corresponds to the neutral loss of a fatty acid molecule from their corresponding molecular ions as indicated (see discussion below). Therefore, combining NLS162 with neutral losses of all potential fatty acids located at the sn-2 position should allow us to determine all HAAG molecular species by MS2 analysis or by sequential NLS scans in some cases since the alkyl chain at the sn-1 position of individual HAAG species could be derived from the molecular mass and the identity of sn-2 fatty acid.
Figure 2.
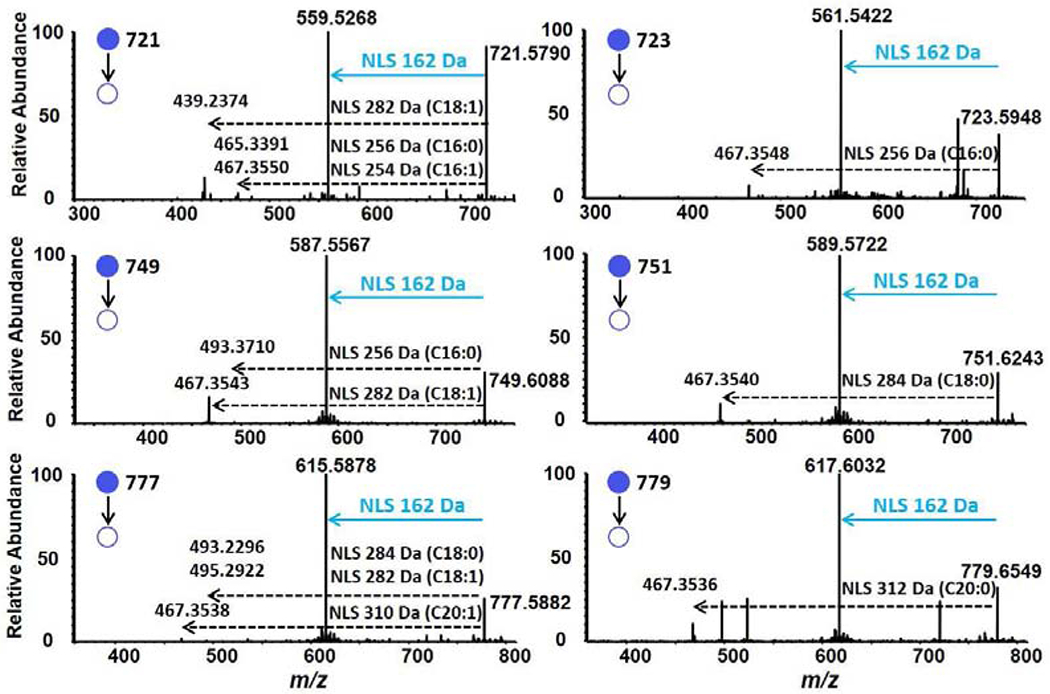
Tandem MS mass spectral analysis of unknown ions present in lipid extracts of rat spinal cord. The MS2 mass spectral analyses of ions at m/z 721, 723, 749, 751, 777, and 779 were separately conducted after CID using an Orbitrap mass spectrometer as described in the section of Materials and Methods.
Further tandem MS analysis of this common fragment ion at m/z 467.36 yielded from fragmentation of these unknown peaks was performed to elucidate their structure. Figure 3A displayed MS3 mass spectrum of the fragment ion at m/z 467.36 generated from the ion at m/z 749.61 using the CID energy at 30 eV. Four major product ions at m/z 169.0686, 185.0634, 225.0945, and 305.3025 were yielded after CID fragmentation of the ion at m/z 467.3545 (Figure 3A). According to the nitrogen rule, no nitrogen element is presented in these unknown ions. Therefore, chemical formulation prediction for individual product ion without a nitrogen element was conducted based on their accurate masses. The chemical formulas were determined as C25H48O7Li+ (m/z 467.3555), C6H10O5Li+ (m/z 169.0683), C6H10O6Li+ (m/z 185.0632), C9H14O6Li+ (m/z 225.0945), and C19H38O2Li+ (m/z 305.3026). There were less than 2 ppm mass errors between the experimental and the theoretical masses. Based on the predicted chemical formulas from the MS3 data (e.g., m/z 749 → 467 →), we proposed the structures of each lithiated fragment ion (Figure 3B). These MS3 analyses allowed us to identify that the lithiated ion at m/z 467.3555 contains the moiety composed of glycerol, an aliphatic chain, and a sugar. Yielding the fragment ion at m/z 305.3026 after the neutral loss of 162 Da, along with the presence of the fragment ions at m/z 169.0683, 185.0632, and 225.0945 strongly suggests the ion at m/z 467.3555 containing a sugar (glucose or galactose) moiety (Figure 3A).
Figure 3.

(A) Tandem MS mass spectral analysis of product ion at m/z 467.36 yielded from tandem MS analysis of the ion at m/z 749.61. The MS3 mass spectral analysis of the ion at m/z 749 was conducted using an Orbitrap mass spectrometer, as described in the section of Materials and Methods. The chemical formulation prediction and their corresponding accurate mass of individual product ion were all labeled in blue. Mass errors between these two accurate masses were labeled into red color. (B) Proposed structures of lithiated adduct ion in the positive ion mode based on the predicted chemical formulas from the accurate mass of MS3 ions from m/z 749.61 → 467.36 →.
Tandem MS analysis (i.e., MS3 analysis) was further conducted to elucidate the identity of the fragment ion after the neutral loss of a sugar residue. For example, an abundant fragment ion at m/z 587.5885 was generated after CID fragmentation of the lithiated ion at m/z 749.61 with the CID energy at 38 eV (Figure 2). Based on the elucidation of the common ion at m/z 467.3555 as described above, we anticipated that the m/z 587.5885 ion should contain glycerol as a backbone and two aliphatic chains connected to the hydroxy groups at sn-1 and sn-2 positions of the glycerol. To confirm our anticipation, tandem MS analysis of this m/z 587.5885 fragment ion was performed, and the MS3 analysis of m/z 749.61 ion displayed six major fragment ions at m/z 289.2719, 305.3031, 323.3136, 349.3290, 331.3188, and 569.5480 (Figure 4A). Based on the nitrogen rule and accurate mass comparison as described above, the chemical formulation prediction of individual product ion should be C37H72O4Li+ (m/z 587.5585), C18H34O2Li+ (m/z 289.2713), C19H38O2Li+ (m/z 305.3026), C19H40O3Li+ (m/z 323.3132), C21H40O2Li+ (m/z 331.3183), C21H42O3Li+ (m/z 349.3289), and C37H70O3Li+ (m/z 569.5479). The mass errors between the experimental and the theoretical masses were also all less than 2 ppm. The proposed structures of each lithiated fragment ion were shown in Figure 4B.
Figure 4.

(A) Tandem MS mass spectral analysis of product ion at m/z 587.56 yielded from tandem MS analysis of the ion at m/z 749.61. The CID energy was 42 eV. The experimental m/z of each product ion was labeled in black. The chemical formulation prediction and their corresponding accurate masses of the product ions were all labeled in blue. Mass errors between these two accurate masses were labeled in red. (B) Proposed structures of lithiated adducts in the positive ion mode based on the predicted chemical formula from the accurate masses of MS3 ions from m/z 749.61 → 587.56 →. Please note that the location of double bonds in both sn-1 and sn-2 C18 aliphatic chains in the study was assigned to the n-9 position, considering 18:1 FA-CoA (n-9) is predominantly present in almost all biological systems.
Specifically, the ion at m/z 289.2713 represents a lithium adduct of oleic acid, and the m/z 323.3132 ion could be a moiety containing the glycerol backbone and a C16:0 alkyl group which connects to glycerol by an ether bond (usually at sn-1 position). Identification of alkyl connection, but not alkenyl linkage, will be described below. The neutral loss of water (18 Da) from the ion at m/z 323.3132 yielded the ion at m/z 305.3026. Combining the information from these three fragment ions, the ion at m/z 587.5885 should be a lithiated moiety containing a glycerol backbone, a C16:0 alkyl chain, and a C18:1 fatty acid (Figure 4B).
In addition to three aforementioned abundant fragment ions around m/z 300 in tandem MS mass spectrum of m/z 587.5585 ion, the spectrum also displayed two additional, relatively low intense fragment ions at m/z 349.3289 and 331.3183 (Figure 4A). The structure of the ion at m/z 349.3289 was similar to that of m/z 323.3132. The difference of the current case from the abundant one was a C18:1 aliphatic chain replacing a C16:0 one. Further neutral loss of water from this ion led to the production of the ion at m/z 331.3183. This observation indicates that there existed two isomeric species corresponding to the ion at m/z 587.5585, and thus the molecular ion at m/z 749.61 as illustrated in Figure 2. These isomeric species should be O-16:0-18:1 HAAG (abundant one) and O-18:1-16:0 HAAG (low abundance one) in an estimated relative ratio of 91:9 based on their peak intensity ratios of the corresponding fragment ions at m/z 323.3132 and 349.3289, or m/z 305.3026 and 331.3183. This ratio can also be estimated from the ions at m/z 467.34 and 493.37.
A similar procedure of MS2 and MS3 analyses of the ion m/z 749.61 was applied to other unknown ion peaks. The MS3 mass spectra, as well as the predicted chemical formulas of individual fragment ions from other unknown peaks, were provided in Figure S1. It was found that their mass errors between experimental and theoretical masses were also all less than 2 ppm. The isomeric information of these HAAG species and their relative composition of each ion from rat spinal cord were given in Table 1 and Figure S2 through the neutral losses of all potential fatty acids and their corresponding intensities located at the sn-2 position from each HAAG molecular species (Figure 2). It should be emphasized that among all HAAG species, C16:0 alkyl-containing species were predominant in rat spinal cord. This phenotype was also found in all examined mouse brain samples. The biochemistry leading to this phenotype and its role in brain functions remain elusive.
Table 1.
The isomers of HAAG species and their relative composition of individual ion present in rat spinal cord sample.
| m/z | HAAG species | R1 | R2 | Composition (%) |
|---|---|---|---|---|
| O-16:0-16:1 | C16H33 | C15H29 | 49 | |
| 721.5790 | O-14:0-18:1 | C14H29 | C17H33 | 43 |
| O-16:1-16:0 | C16H31 | C15H31 | 8 | |
| 723.5948 | O-16:0-16:0 | C16H33 | C15H31 | 100 |
| 749.6113 | O-16:0-18:1 | C16H33 | C17H33 | 91 |
| O-18:1-16:0 | C18H35 | C15H31 | 9 | |
| 751.6270 | O-16:0-18:0 | C16H33 | C17H35 | 100 |
| O-16:0-20:1 | C16H33 | C19H37 | 72 | |
| 777.6426 | O-18:0-18:1 | C18H37 | C17H33 | 16 |
| O-18:1-18:0 | C18H35 | C17H35 | 12 | |
| 779.6583 | O-16:0-20:0 | C16H33 | C19H39 | 100 |
3.2. Verification of the absence of vinyl ether linkage in HAAG
To further confirm the linkage of the aliphatic chain at the sn-1 position of HAAG species was an ether bond, but not a vinyl ether one, the lipid extract was subjected to derivatization with iodine and methanol for specific identification of the presence of vinyl ether-containing species as previously described [17]. The analysis of plasmalogen PE species as a control group was conducted in parallel. The full scan mass spectra of PE species present in lipid extracts of rat spinal cord in the negative ion mode demonstrated the presence of abundant plasmalogen PE species along with other PE species (Figure S3). As displayed in the top panel of Figure S3, the ions at m/z 680 to 800, i.e., m/z 686.5, 700.5, 726.5, 728.6, 754.6, 774.5, and 790.5 represented the internal standard (i.e., PE(32:2)), PE(p-34:1), PE(p-36:2), PE(p-36:1), PE(p-38:4), PE(p-40:6), and PE (40:6), respectively. Here, the prefix “p-” denotes plasmalogen PE species. The bottom panel of Figure S3 displayed the mass spectrum acquired from the lipid extract derivatized with Iodine and methanol, which showed that the ion peaks corresponding to plasmalogen PE species were shifted to the higher mass range due to the addition of 157.9217 Da. For example, PE(p-34:1), PE(p-36:2), PE(p-36:1), PE(p-38:4), PE(p-40:6) shifted to m/z 858.4, 884.5, 886.5, 912.5, and 932.5, respectively, as indicated (Figure S3). This observation suggests that the derivatization worked very well for identification of vinyl ether bonds. However, the mass spectral analysis showed no difference in HAAG species between before and after the I2/MeOH derivatization (Figure S4). The amount of individual HAAG species was no change. Therefore, the result provided evidence that very minimal amounts of vinyl ether-containing HAAG species, if present, were presented in rat spinal cord.
3.3. Analysis of HAAG species in nerve tissue samples
In the study, we also applied the developed workflow to identify HAAG species and quantify their content in mouse nerve tissue samples via comparison with N15:0 CBS as an internal standard (due to that synthetic HAAG species are not commercially available for the standard purpose). The amounts of total HAAG content were 1.50 ± 0.39, 6.96 ± 0.94, 4.29 ± 0.41, and 0.58 ± 0.09 nmol/mg protein from mouse sciatic nerve, spinal cord, brain stem, and cerebrum tissues, respectively. The molecular profile of HAAG species presented in these nerve tissues were shown in Figure 5.
Figure 5.

The molecular profile of HAAG species from mouse sciatic nerve, spinal cord, brain stem, and cerebrum. HAAG species were identified by tandem MS analysis and quantified in comparison to the internal standard (i.e., N15:0 cerebroside) as described in the sections of Methods and Results.
Although glycolipids containing one or more than one sugar residues linked to alkylacylglycerol were discovered in human gastric secretions in 1977 [22], extensive characterization of these HAAG species in mammalian brain samples has never been reported. In the current study, we have profiled HAAG molecular species present in mouse nerve tissue samples (Figure 5) in addition to those in rat spinal cord. We found that the composition of isomeric HAAG species present in mouse brain tissue was virtually identical to that identified in rat spinal cord. However, we found the relative abundance of HAAG species in total monohexosyl lipids (including monohexosyl sphingolipids) was different among different nerve tissues and between different animal species. For example, the relative abundance of total HAAG to the total amount of monohexosyl lipids was about 19.6 ± 3.0 mol% in rat spinal cord. Among mouse nerve tissue samples determined, the relative content of total HAAG in total monohexosyl lipids present in sciatic nerve, spinal cord, brain stem, and cerebrum was 1.1 ± 0.3, 5.5 ± 0.4, 4.9 ± 0.4, and 3.5 ±1.1 mol%, respectively. As a preliminary test, we also confirmed the presence of HAAG species in human brain samples (data not shown). Although HAAG species were at low abundance in nerve tissues in general, their critical role(s) in brain cellular functions remain unknown. We believe our current study provided a foundation for us to unravel the biochemistry and their biological roles in the nerve tissue in the future.
4. Conclusions
In the current study, lipid extraction of biological samples was prepared with addition of n-pentadecanoyl cerebroside (N15:0 CBS) species as an internal standard (IS) for quantitation. After workup, analysis of HAAG species was performed in the MDMS-SL fashion on a QqQ mass spectrometer equipped with an automated nanospray device. The functional group selective derivatization was adapted to determine the potential presence of vinyl ether-containing HAAG isomers. We found that vinyl ether group was not observed within the detection limit. Through product ion MSn analysis of a few lithiated HAAG species, we found NLS162 could be used to profile all HAAG species. Full structural identification could be achieved in combination with neutral loss scans of all potential fatty acids present in the sn-2 position of HAAG species (mainly as C16:0, C16:1, C18:0, C18:1, C20:0, and C20:1) in some cases or directly product ion analysis. The current work represents the first kind of lipidomics study on HAAG species present in mammalian nerve tissue samples, which provides the foundation to explore future biological research in this unknown area.
Supplementary Material
Extensive characterization and profiling of monohexosyl alkyl-acyl glycerol (HAAG) species from nerve samples at the first time.
Determination of HAAG positional isomers via tandem MS analysis.
Validation of the minimal co-existence of vinyl ether-containing isomers with HAAG species in nerve samples.
Acknowledgments
This work was partially supported by National Institute of Aging Grant RF1 AG061872, National Institute of Neurological Disorders and Stroke Grant U54 NS110435, as well as from the UT Health SA intramural institutional research funds, the Mass Spectrometry Core Facility, and the Methodist Hospital Foundation. Special thanks are expressed to Dr. Juan Pablo Palavicini and Mr. Linyuan Chen for their skillful technical support in the analysis of lipids and/or animal care.
Footnotes
Appendix A. Supplementary data
Supplementary data to this article can be found online at https://doi.org/10.1016/j.aca.xxxxxx
Publisher's Disclaimer: This is a PDF file of an unedited manuscript that has been accepted for publication. As a service to our customers we are providing this early version of the manuscript. The manuscript will undergo copyediting, typesetting, and review of the resulting proof before it is published in its final form. Please note that during the production process errors may be discovered which could affect the content, and all legal disclaimers that apply to the journal pertain.
Declaration of competing interest
The authors declare that they have no known competing financial interests or personal relationships that could have appeared to influence the work reported in this paper.
References
- [1].Han X. Neurolipidomics: challenges and developments, Front. Biosci 12 (2007) 2601–2615. [DOI] [PMC free article] [PubMed] [Google Scholar]
- [2].Elliott DA, Weickert CS, Garner B. Apolipoproteins in the brain: implications for neurological and psychiatric disorders, Clin. Lipidol 51 (2010) 555–573. [DOI] [PMC free article] [PubMed] [Google Scholar]
- [3].Han X, Gross RW. Global analyses of cellular lipidomes directly from crude extracts of biological samples by ESI mass spectrometry: a bridge to lipidomics, J. Lipid Res 44 (2003) 1071–1079. [DOI] [PubMed] [Google Scholar]
- [4].Lagarde M, Geloen A, Record M, Vance D, Spener F. Lipidomics is emerging, Biochim Biophys Acta 1634 (2003) 61. [DOI] [PubMed] [Google Scholar]
- [5].Han X, Yang J, Cheng H, Ye H, Gross RW. Towards fingerprinting cellular lipidomes directly from biological samples by two-dimensional electrospray ionization mass spectrometry, Anal. Biochem 330 (2004) 317–331. [DOI] [PubMed] [Google Scholar]
- [6].Han X, Gross RW. Shotgun lipidomics: Electrospray ionization mass spectrometric analysis and quantitation of the cellular lipidomes directly from crude extracts of biological samples, Mass Spectrom. Rev 24 (2005) 367–412. [DOI] [PubMed] [Google Scholar]
- [7].Han X, Yang K, Gross RW. Multi-dimensional mass spectrometry-based shotgun lipidomics and novel strategies for lipidomic analyses, Mass Spectrom. Rev 31 (2012) 134–178. [DOI] [PMC free article] [PubMed] [Google Scholar]
- [8].Hu C, Wang M, Han X. Shotgun lipidomics in substantiating lipid peroxidation in redox biology: Methods and applications, Redox Biol. 12 (2017) 946–955. [DOI] [PMC free article] [PubMed] [Google Scholar]
- [9].Wang M, Wang C, Han RH, Han X. Novel advances in shotgun lipidomics for biology and medicine, Prog. Lipid Res 61 (2016) 83–108. [DOI] [PMC free article] [PubMed] [Google Scholar]
- [10].Fahy E, Subramaniam S, Brown HA, Glass CK, Merrill AH Jr., Murphy RC, Raetz CR, Russell DW, Seyama Y, Shaw W, Shimizu T, Spener F, Van Meer G, Vannieuwenhze MS, White SH, Witztum JL, Dennis EA. A comprehensive classification system for lipids, J. Lipid Res 46 (2005) 839–861. [DOI] [PubMed] [Google Scholar]
- [11].Moran AP. Molecular mimicry of host glycosylated structures by bacteria. In: Holst O, Brennan PJ, and Itzstein M von, editor. Microbial Glycobiology: Structures, Relevance and Applications. First ed: Academic Press - Elsevier; 2009. p. 847–870. [Google Scholar]
- [12].Hakomori S, Igarashi Y. Functional role of glycosphingolipids in cell recognition and signaling, J. Biochem 118 (1995) 1091–1103. [DOI] [PubMed] [Google Scholar]
- [13].Jurevics H, Hostettler J, Muse ED, Sammond DW, Matsushima GK, Toews AD, Morell P. Cerebroside synthesis as a measure of the rate of remyelination following cuprizone-induced demyelination in brain, J. Neurochem 77 (2001) 1067–1076. [DOI] [PubMed] [Google Scholar]
- [14].Han X, Cheng H. Characterization and direct quantitation of cerebroside molecular species from lipid extracts by shotgun lipidomics, J. Lipid Res 46 (2005) 163–175. [DOI] [PubMed] [Google Scholar]
- [15].Cheng H, Guan S, Han X. Abundance of triacylglycerols in ganglia and their depletion in diabetic mice: Implications for the role of altered triacylglycerols in diabetic neuropathy, J. Neurochem 97 (2006) 1288–1300. [DOI] [PMC free article] [PubMed] [Google Scholar]
- [16].Han X. Lipidomics: Comprehensive Mass Spectrometry of Lipids, John Wiley & Sons, Inc., 2016. [Google Scholar]
- [17].Fhaner CJ, Liu S, Zhou X, Reid GE. Functional group selective derivatization and gas-phase fragmentation reactions of plasmalogen glycerophospholipids, Mass Spectrom. 2 (2013) S0015. [DOI] [PMC free article] [PubMed] [Google Scholar]
- [18].Han X, Yang K, Gross RW. Microfluidics-based electrospray ionization enhances intrasource separation of lipid classes and extends identification of individual molecular species through multi-dimensional mass spectrometry: Development of an automated high throughput platform for shotgun lipidomics, Rapid Commun. Mass Spectrom 22 (2008) 2115–2124. [DOI] [PMC free article] [PubMed] [Google Scholar]
- [19].Yang K, Cheng H, Gross RW, Han X. Automated lipid identification and quantification by multi-dimensional mass spectrometry-based shotgun lipidomics, Anal. Chem 81 (2009) 4356–4368. [DOI] [PMC free article] [PubMed] [Google Scholar]
- [20].Yang K, Han X. Accurate quantification of lipid species by electrospray ionization mass spectrometry - Meets a key challenge in lipidomics, Metabolites 1 (2011) 21–40. [DOI] [PMC free article] [PubMed] [Google Scholar]
- [21].Wang M, Wang C, Han X. Selection of internal standards for accurate quantification of complex lipid species in biological extracts by electrospray ionization mass spectrometry-What, how and why?, Mass Spectrom. Rev 36 (2017) 693–714. [DOI] [PMC free article] [PubMed] [Google Scholar]
- [22].Slomiany BL, Slomiany A, Glass GB. Glycolipids of the human gastric content. Structure of the sulfated glyceroglucolipid, Eur. J. Biochem 78 (1977) 33–39. [DOI] [PubMed] [Google Scholar]
Associated Data
This section collects any data citations, data availability statements, or supplementary materials included in this article.