
Figure 2. Circular representation of the V. cholerae genome.
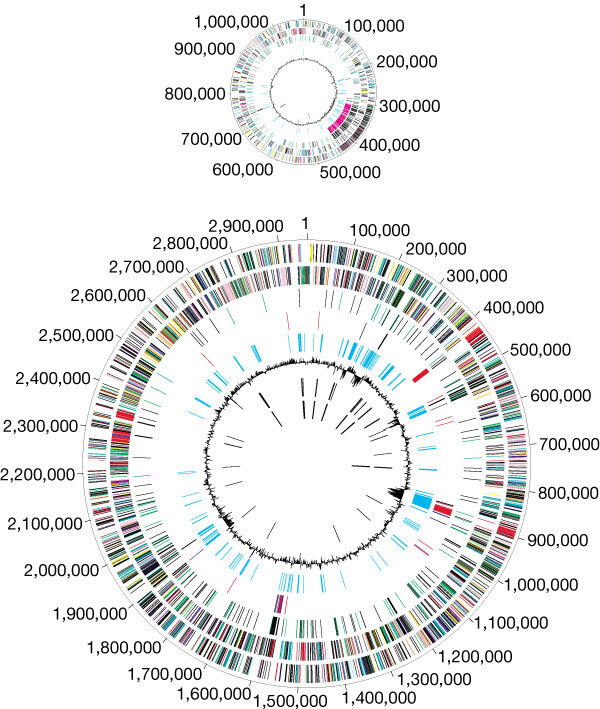
The two chromosomes, large and small, are depicted. From the outside inward: the first and second circles show predicted protein-coding regions on the plus and minus strand, by role, according to the colour code in Fig. 1 (unknown and hypothetical proteins are in black). The third circle shows recently duplicated genes on the same chromosome (black) and on different chromosomes (green). The fourth circle shows transposon-related (black), phage-related (blue), VCRs (pink) and pathogenesis genes (red). The fifth circle shows regions with significant χ2 values for trinucleotide composition in a 2,000-bp window. The sixth circle shows percentage G+C in relation to mean G+C for the chromosome.The seventh and eighth circles are tRNAs and rRNAs, respectively.