

Abstract
Purpose
The purpose of this study was to measure the composition of the inner nuclear layer (INL) in the central and peripheral human retina as foundation data for interpreting INL function and dysfunction.
Methods
Six postmortem human donor retinas (male and female, aged 31–56 years) were sectioned along the temporal horizontal meridian. Sections were processed with immunofluorescent markers and imaged using high-resolution, multichannel fluorescence microscopy. The density of horizontal, bipolar, amacrine, and Müller cells was quantified between 1 and 12 mm eccentricity with appropriate adjustments for postreceptoral spatial displacements near the fovea.
Results
Cone bipolar cells dominate the INL a with density near 50,000 cells/mm2 at 1 mm eccentricity and integrated total ∼10 million cells up to 10 mm eccentricity. Outside central retina the spatial density of all cell populations falls but the neuronal makeup of the INL remains relatively constant: a decrease in the proportion of cone bipolar cells (from 52% at 1 mm to 37% at 10 mm) is balanced by an increasing proportion of rod bipolar cells (from 9% to 15%). The proportion of Müller cells near the fovea (17%) is lower than in the peripheral retina (27%).
Conclusions
Despite large changes in the absolute density of INL cell populations across the retina, their proportions remain relatively constant. These data may have relevance for interpreting diagnostic signals such as the electroretinogram and optical coherence tomogram.
Keywords: amacrine cells, Mueller cells, horizontal cells, bipolar cells, ganglion cells
The fovea is a specialization in the retina of diurnal primates including humans.1 It is characterized by a high density of cone photoreceptors, a low density of rod photoreceptors, and the lateral displacement of postreceptoral neurons. The density of all cell types within the retina changes dramatically with the distance from the fovea (eccentricity). The purpose of the present study is to establish whether these density changes occur in parallel for the different cell types that constitute the inner nuclear layer (INL). This is an important question for ophthalmology, because these cell populations contribute to diagnostic signals such as the electroretinogram.2 We also address the question how the composition of the INL varies between individuals, as has been reported with respect to the density of photoreceptors and ganglion cells.3–5
The INL is composed of three neuronal cell classes (horizontal, bipolar, and amacrine cells) and one class of glia (Müller cells). Two types of horizontal cell, named H1 and H2 are distinguished in primate retina; they modulate glutamatergic transmission from photoreceptors.6 Bipolar cells are subdivided into rod bipolar cells that transfer the rod signal (scotopic vision) and eleven types of cone bipolar cell which transfer the cone signal (photopic vision).7 The spatial distribution of rod bipolar cells8 and most OFF cone bipolar types in human retina has recently been studied,5 but there is as yet limited data on the distribution of ON cone bipolar types. Amacrine cells are inhibitory interneurons that integrate signals in the inner retina and shape ganglion cell responses. Here, we aimed to quantify the spatial density of glycinergic and GABAergic amacrine cells that together make up the large majority of the at least 30 types of amacrine cells present in primate retinas.7
Müller cells are the principal glial cell in the mammalian retina,9,10 they provide structural and metabolic support to retinal neurons, and Müller cell dysfunction in the fovea has specifically been linked to degenerative diseases affecting the macula.11 It is thus important to establish the density of Müller cells in central and peripheral retina.
Here we sectioned the retinas from six postmortem human donors across the temporal horizontal meridian. We applied multiple antibodies against molecular markers to these sections to map the density and proportion of various INL cell populations and their variation across individuals.
Materials & Methods
Tissue Collection and Preparation
Postmortem human eyes from donors with no known history of eye disease were obtained from the Lions NSW Eye Bank (Sydney Eye Hospital) and Australian Ocular Biobank with consent and ethical approval from The University of Sydney Human Research Ethics Committee (HREC 2012/2833). Information about the donor eyes is summarized in Table 1. The same retinas used in this study were also used in our previous publications where a detailed description of the methodology can be found.5,8 Briefly, the retina was fixed in 2% paraformaldehyde in 0.1 M phosphate buffer while attached to the ora serrata and the retinal pigment epithelium. After rinses in phosphate buffer, the retina was dissected out of the eyecup, and the vitreous was removed. Retina pieces measuring 3 to 5 mm in width and 4 to 5 mm in length were prepared from defined eccentricities along the nasal-temporal axis (1 mm nasal to 15 mm temporal). The pieces were embedded in 3% low melting temperature Agarose (Sea Plaque Agarose; Lonza, Rockland, ME, USA) in PBS and sectioned vertically at a thickness of 100 µm using a Vibratome (VT 1200; Leica, Wetzlar, Germany). Subsequently sections were processed for standard immunofluorescence using a mixture of primary antibodies (incubation time four to seven days) listed in Table 2. Secondary antibodies (made in donkey) coupled to the fluorophores Alexa 594, Alexa 488 or Alexa 647 were obtained from Jackson ImmunoResearch (West Grove, PA, USA) and applied for about 16 hours. The nuclear stain DAPI was added to the diluent for the secondary antibodies. Sections were mounted onto polylysine-coated microscope slides within wells of adhesive spacers (diameter 20 mm, depth 0.12 mm, secure seal spacers; ThermoFisher Scientific, Waltham, MA, USA) and then coverslipped with Vectashield aqueous mounting medium (Vector Laboratories, Burlingame, CA, USA).
Table 1.
Donor Retinas
| ID | Eye | Sex | Age (y) | Time to Enucleation (h) | Time to Fixation in 2% PFA (h) | Fixation Time (h) |
|---|---|---|---|---|---|---|
| 14458 | Left | F | 31 | 3 | 5 | 25 |
| 15649 | Left | F | 36 | 0.5 | 8 | 40 |
| 14064 | Right | F | 44 | 1 | 3 | 13 |
| 13587 | Right | F | 44 | 2 | 4 | 12 |
| 15415* | Left | F | 54 | 3 | 5 | 17 |
| 13699 | Right | M | 56 | 2 | 9 | 21 |
PFA, paraformaldehyde.
The eye was placed into CO2 independent medium for 1 hour before fixation. Times over one hour are shown to the nearest hour.
Table 2.
Antibodies
| Antibody Name [Cell Type] | Immunogen | Source, Catalogue Number, RRID | Antibody Type | Dilution |
|---|---|---|---|---|
| Calbindin (CaBP) [DB3a, HC] | Recombinant rat calbindin D-28k | Swant, CB38, lot: 5.5 RRID: AB_10000340 | Rabbit polyclonal | 1:20,000 |
| Glutamic Acid Decarboxylase 65 (GAD-6) [Amacrine] | GAD-glutamic acid decarboxylase affinity purified from rat brain | Developmental Studies Hybridoma Bank developed under the auspices of the NICHD and maintained by the University of Iowa, RRID: AB_2314499 | Mouse monoclonal | 1:100 |
| Glutamic Acid Decarboxylase 67 (GAD67) [Amacrine] | Recombinant GAD67 protein, clone 1G10.2 | Millipore, MAB5406, lot: 2283338; RRID: AB_2278725 | Mouse monoclonal | 1:8000 |
| Glycine Transporter (Glyt-1) [Amacrine] | Synthetic peptide corresponding to the carboxyl terminal region of Glyt-1 | Gift from Prof. David Pow, University of Queensland, Australia; RRID: AB_2314597 | Rabbit polyclonal | 1:5000 |
| Glutamine Synthetase [Müller] | Human Glutamine Synthetase amino acids 1-373 | BD Biosciences, 610518; RRID: AB_397880 | Mouse monoclonal | 1:6000 |
| Islet-1 [ON bipolar] | C-terminal portion of rat Islet-1 | Hybridoma Bank, Iowa, 39.3F7; RRID: AB_1157901 | Mouse monoclonal | 1:250 |
| Parvalbumin [HC, GC] | Parvalbumin purified from carp muscles. | Swant, 235, lot: 10-11 (F); RRID: AB_10000343 | Mouse monoclonal | 1:20,000 |
| Parvalbumin [HC, GC] | Parvalbumin form rat muscle | Swant, PV 25, lot: 5.10; RRID: AB_10000344 | Rabbit polyclonal | 1:10,000 |
| Protein kinase Cα [rod bipolar] | Synthetic peptide corresponding to amino acids 659-672 from the C-terminal variable (V5) region of rat PKCα conjugated to KLH | Sigma-Aldrich, P4334; RRID AB477345 | Rabbit polyclonal | 1:50,000 |
Abbreviations: DB, diffuse bipolar; HC, horizontal cell; GC, ganglion cell.
Definitions
Based on previous studies1,12–14 foveal retina refers to 5.5˚ diameter of visual angle, which is equivalent to 0.8 mm radial distance from the foveal center, assuming retinal magnification 0.29 mm per degree (the reader is referred to Masri et al.5 for further details). Central (macular) retina refers to 10˚ diameter of visual angle which is equivalent to radial eccentricity within 1.5 mm. For comparison, the radii of the Early Treatment Diabetic Retinopathy Study Group subfields are 0.5 mm (center), 1.5 mm (inner ring), and 3.0 mm (outer ring).15 We refer to eccentricities beyond 3 mm (visual angles larger than 30°) as peripheral retina.
Microscopy
Sections were imaged using a confocal scanning microscope (Zeiss LSM700) equipped with 405, 488, 555, and 635 nm lasers using a 20 × air objective (Plan Apochromat no. 420650-9901) at a resolution of 2048 × 2048 or 1024 × 1024 pixels and a Z-axis step size of 0.87 to 1.15 µm for each optical section. Tiled stacks of each vibratome section were stitched together using Zeiss ZEN Black Software. The contrast and brightness of the images were adjusted using Zen Blue (Zeiss) or Adobe Photoshop software.
Analysis
Density Measurements
Cell densities were determined from tiled image stacks using Zen Blue software as described in our previous publications.5,8 Briefly, cells were counted from volumetric reconstructions of Vibratome sections, that is, by going through image stacks taking the fluorescent marker, DAPI, and differential contrast optics into account. Cells were counted across the length and depth of each section, except where the retinal layers were mechanically distorted or the immunolabeling was substantially weaker than in other parts of the same section. Volumetric reconstructions of individual vibratome sections were separated into bins (normally 100 µm width), and cells were counted within each bin across a minimum depth of 10 µm in the z-plane. Areal densities (cells/mm2 of retinal surface) were calculated for each bin at various eccentricities along the temporal horizontal meridian. Density measurements were pooled across preparations and fit using 3-stage difference-of-exponentials functions. Optimal fit parameters are provided in Table 3 for the equation: D = c1 exp (λ1X) + c2 exp (λ2X) + c3 exp (λ3X), where D is cell density (cells/mm2), λ1, λ2, and λ3 are exponential coefficients, c1, c2, and c3 are multiplicative coefficients, and X is eccentricity (mm). Negative fit values in the fovea were set to zero. As in our previous study,5 cumulative density across the horizontal meridian was calculated by circular integration of spatial densities within annuli of defined eccentricity ranges, radiating from the foveal center in a “bullseye” pattern. The following formula was applied to calculate the number (N) of cells within each annulus:
where ro represents the radius of the outer border and ri represents the radius of the inner border of the eccentricity range in question. Integrated cell numbers were calculated by taking into account the spatial offset caused by Henle's fibers (postreceptoral displacement), as well as the larger volume of INL containing each population's cell bodies with respect to the foveal cone outer segments10,16 (for detailed methodology see5).
Table 3.
Best Fit Parameters for Pooled Data
| c1 | λ1 | c2 | λ2 | c3 | λ3 | |
|---|---|---|---|---|---|---|
| Cones | 3.673e+05 | −7.828e+00 | −2.000e+05 | −2.000e+03 | 2.034e+04 | −2.164e−01 |
| S-Cones | 5.048e+03 | −3.014e+00 | −1.100e+04 | −7.869e+00 | 1.455e+03 | −1.370e−01 |
| Ganglion cells | 5.717e+05 | −1.031e+00 | −6.000e+05 | −1.261e+00 | −5.527e+01 | −9.658e+01 |
| OFF Midget Bipolar cells | 4.208e+05 | −1.225e+00 | −4.551e+05 | −1.387e+00 | 1.230e+04 | −6.986e−02 |
| ON Bipolar cells | 1.788e+05 | −4.755e−01 | −1.836e+05 | −5.618e−01 | 8.894e+03 | −1.832e−02 |
| DB3a cells | 4.275e+03 | −1.949e−01 | −9.614e+03 | −5.831e+00 | 3.336e+02 | 5.811e−03 |
| DB3b cells | 7.061e+03 | −1.511e−01 | −7.869e+03 | −3.120e+00 | −3.653e+03 | −3.347e−01 |
| Horizontal cells | 2.051e+04 | −3.850e−01 | −4.246e+04 | −4.196e+00 | 2.672e+03 | −1.097e−02 |
| H1 cells | 1.659e+04 | −3.334e−01 | −4.227e+06 | −1.633e+01 | 1.280e+03 | 4.952e−02 |
| H2 cells | 5.131e+03 | −2.197e−01 | −5.440e+03 | −6.706e−01 | −8.006e−01 | −5.171e+01 |
| Glycinergic amacrine cells | 1.614e+04 | −1.260e−01 | −3.944e+05 | −5.923e+00 | −6.498e+02 | −5.675e+01 |
| GABAergic amacrine cells | 1.214e+05 | −1.001e+00 | −1.354e+05 | −1.113e+00 | 7.605e+03 | −6.347e−02 |
| Müller cells | 2.011e+05 | −1.845e+00 | −2.369e+05 | −2.362e+00 | 1.379e+04 | −2.815e−02 |
Numbers show best fit parameters for sum-of-exponential fits. c1, c2, c3, multiplicative coefficients., λ1, λ2, λ3, exponential coefficients.
Results
The same six retinas from donors between the ages of 31 to 56 years (Table 1) as in our previous studies5,8 were used to analyze the spatial distribution of horizontal, amacrine, ON cone bipolar and Müller cells. Consistent with previous studies, we did not observe any obvious age-related differences in the distribution of cells in the INL in these retinas.5,8,17
Figure 1 shows a confocal image from a vertical section taken 500 µm from the foveal center of a 36-year-old female donor (15649). The nuclear and synaptic layers, as well as individual cell nuclei, can be readily distinguished.
Figure 1.
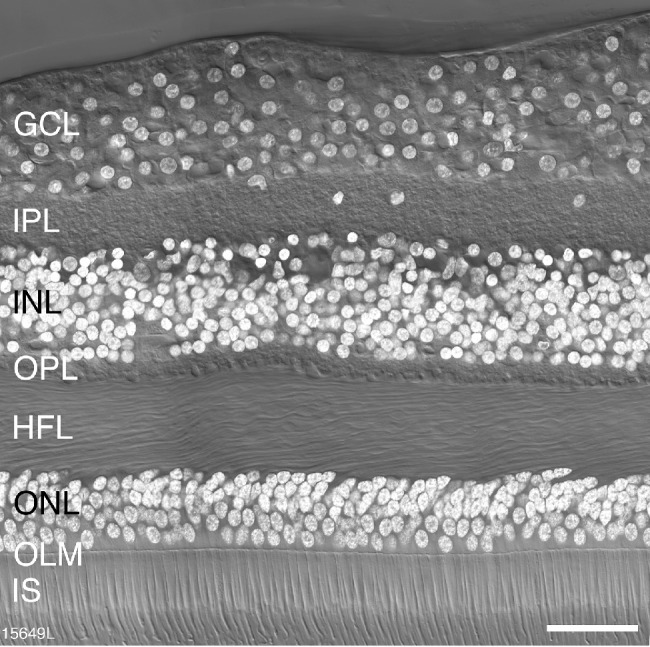
Retinal layers. Confocal image of a vertical section through a postmortem human donor retina (age 36 years) taken at 500 µm eccentricity. The layers of the retina are visible with Nomarski differential contrast optics and DAPI nuclear stain (white) reveals the nuclei of cell bodies located in the outer nuclear layer (ONL), the inner nuclear layer (INL) and the ganglion cell layer (GC). IPL, inner plexiform layer; OPL, outer plexiform layer; HFL, Henle fiber layer; OLM, outer limiting membrane; IS, inner segments of photoreceptors. Scale bar: 50 µm.
Horizontal Cells
Horizontal cells were labeled with antibodies against the calcium binding proteins parvalbumin and calbindin.18 Parvalbumin is strongly expressed in the cell body and dendritic processes of horizontal cells and weakly expressed in the cell bodies of ganglion cells (Fig. 2). Parvalbumin positive horizontal cells were observed as close as 100 µm from the foveal center (Figs. 2A and 3). In accordance with previous studies, we assumed parvalbumin is expressed by both H1 and H2 cells, whereas calbindin is only expressed by H2 cells.18–20 Consistently, we found that nearly all cells in the horizontal cell layer expressed parvalbumin whereas a subpopulation of cells in addition expressed calbindin (presumed H2 cells, Figs. 2E-G, arrows). Presumed H2 cells had a more rounded and smaller cell body than H1 cells. Parvalbumin staining intensity was comparable in the two cell types.
Figure 2.

Fluorescence micrographs of horizontal cells in temporal retina. Confocal images of vertical sections from preparation 15415 (aged 54 years) processed with antibodies against parvalbumin (green) and calbindin (magenta). (A) Vertical section taken 100 µm superior to the center of the fovea showing strongly parvalbumin positive horizontal cells and weakly positive ganglion cells. Nomarski optics image is superimposed to reveal the retina layers. (B) The same section as shown in A at an eccentricity of 1 mm. Panels C and D show regions of interest at 2 mm and 3.5 mm, respectively. (E–G) Images from a section double labeled with antibodies against parvalbumin (green) and calbindin (CaBP, magenta). Merged image in G shows H1 horizontal cells expressing parvalbumin alone and H2 cells expressing both parvalbumin and calbindin (arrows). A cell body expressing calbindin alone can also be observed (arrowhead). NFL, nerve fibre layer; GCL, ganglion cell layer; IPL, inner plexiform layer; INL, inner nuclear layer; OPL, outer nuclear layer; HFL, Henle fiber layer; ONL, outer nuclear layer. Scale bar: 50 µm in A (applies to A and B), 20 µm in E (applies to C–G).
Figure 3.

Spatial density of horizontal cells. (A) Density of horizontal cells labeled using antibodies against parvalbumin (H1 and H2) plotted against eccentricity for six preparations (B) Data from A fit to an exponential curve showing the average distribution of horizontal cells across the retina. (C, D) H1 and H2 cell populations were quantified in three preparations (13587, 14064, 15415), which were double labeled for parvalbumin and calbindin. The average density across the retina for H1 cells is shown in C and for H2 cells is shown in D. Error bars in B–D (in some cases smaller than the marker symbols) show standard deviations for pooled data.
We quantified the spatial density of H1 and H2 cells across the temporal retina for six preparations. Figure 3A shows the densities of parvalbumin immunoreactive (H1 and H2) horizontal cells. The pooled data are shown in Figure 3B. Horizontal cell density peaks at an average of 16,200 cells/mm2 at roughly 0.75 mm temporal to the foveal center. Horizontal cell density declines steeply within the central-most 6 mm then plateaus and remains in excess of 2500 cells/mm2 at 10 mm eccentricity.
The spatial distribution of H1 and H2 cells was calculated by pooling data from preparations which were double labeled with parvalbumin and calbindin (13587, 14064, 15415). The density of H1 cells (Fig. 3C) is higher than that of H2 cells (Fig. 3D) at all eccentricities. The density of H1 cells peaks at an average of 15,000 cells/mm2 at 0.6 mm and drops to roughly 2500 cells/mm2 by 12 mm eccentricity. The density of H2 cells declines steadily from a peak density of 2000 cells/mm2 at 2.5 mm to below 300 cells/mm2 at 12 mm. The peak density of H2 cells was in the range of 2000 to 4000 cells/mm2 within 1 and 2.5 mm eccentricity. At about 0.6 mm the ratio of H1 to H2 cells is 15:1, at 2.5 mm the ratio is 4.4:1, and beyond 4 mm the ratio is about 3:1.
We also found some cells in the horizontal cell layer which only expressed calbindin (Figs. 2F, 2G arrowhead). Comparable cells were found in all preparations, but they were very rare (n = 35 cells out of a total of 2447 horizontal cells counted). Thus we assume that they do not represent a separate population of horizontal cells. It is possible that these cells are DB3a bipolar cells where the axon is not labeled.5,21
Bipolar Cells
Antibodies against recoverin were used to identify OFF midget bipolar cells,5,22 antibodies against calbindin and CD15 were used to identify the OFF diffuse bipolar (DB) types DB3a and DB3b, respectively,5,21,22 and antibodies against the transcription factor Islet-1 were used to label ON cone bipolar and rod bipolar cells.21,23 We first compared the expression of Islet-1 with that of recoverin (Fig. 4). Islet-1 was localized to cell bodies in the middle of the inner nuclear layer (Figs. 4B, 4E), and, as expected, we found no overlap between the two markers (Figs. 4C, 4F).
Figure 4.

Fluorescence micrographs of bipolar cells. A-F: Confocal micrographs from preparation #15649 (aged 36 years) stained with antibodies against recoverin (green, A,D) to label OFF-midget bipolar cells and antibodies against islet-1 (magenta, B,E) to label ON bipolar cell nuclei, Nomarski optics images are superimposed. Regions of interest are shown at 1.2 mm (A–C) and 2.5 mm eccentricity (D–F). Merged images C and F show that there is no colocalization between recoverin and Islet-1. Abbreviations as in Figure 1. Scale bar: 50 µm shown in F (applies to all), Nomarski optics images are superimposed.
The intensity of Islet-1 immunoreactivity varied between individual bipolar cells (Fig. 4B). To characterize further the strongly Islet-1–positive cells we double-labeled some sections with antibodies against Islet-1 and antibodies against the rod bipolar cell marker protein kinase Cα (PKCα).8,24,25 We found that all strongly labeled Islet-1–positive cells were also strongly labeled for PKCα (Fig. 5), suggesting that they are rod bipolar cells. The weakly labeled Islet-1–positive cells are assumed to be ON cone bipolar cells. We also found a low proportion of weakly labeled PKCα-positive cells that were not labeled for Islet-1 (arrow in Figs. 5B–5D). These cells are most likely DB4 cone bipolar cells.8,14,25
Figure 5.

Fluorescence micrographs of Islet-1 positive ON bipolar cells. Confocal micrographs from preparation 14064 (aged 44 years) stained with antibodies against Islet-1 (magenta) to label ON bipolar cell bodies and antibodies against PKCα to label rod bipolar cells and DB4 cells. (A) Most cells are double labeled. (B–D) Rod bipolar cells strongly express both PKCα and Islet-1 (white dots). The arrows point to a cell that expresses PKCα but does not express Islet-1: this is likely a DB4 cell. The arrowheads point to a cell that expresses Islet-1 but not PKCα. OPL, outer plexiform layer; INL, inner nuclear layer; IPL, inner plexiform layer; GCL, ganglion cell layer. Scale bar: 50 µm in A and 25 µm in B–D.
Figures 6A and 6B show the combined spatial density of strongly and weakly Islet-1 labeled bipolar cells for six preparations. The average density of Islet-1 positive bipolar cells peaks at roughly 2 mm eccentricity near 18,000 cells/mm2 (range ∼10,000 to ∼28,000 cells/mm2) and gradually decreases to 7000 cells/mm2 by 13 mm eccentricity. The curve of pooled densities of Islet-1 positive bipolar cells does not have a sharp peak because it includes rod bipolar cells, which have their peak density between 2 and 3 mm.8 As reported for OFF midget bipolar cells, 5 there is some variation in density between preparations.
Figure 6.

Spatial density of Islet-1 positive ON bipolar cells. (A) Spatial density quantified across six preparations labeled with antibodies against Islet-1. Density is plotted against eccentricity. (B) Pooled data across the six preparations in A, fit to an exponential curve to illustrate the population density of ON bipolar cells across the human retina. (C, D) Comparison of the density of ON bipolar cells (C) and OFF midget bipolar cells (D) in central retina within a single preparation (15649). Error bars in B (in some cases smaller than the marker symbols) show standard deviations for pooled data.
The pooled density of Islet-1 positive bipolar cells shown in Figure 6B on average is lower than the pooled density of OFF midget bipolar cells we reported previously. (see Fig. 3F in 5) suggesting that OFF bipolar cells outnumber ON bipolar cells. The previous study, however, did not include preparation 15415, which in the present study showed relatively low peak density of Islet-1 positive cells (Fig. 6A). When we compared the density of Islet-1 positive bipolar cells with that of recoverin positive OFF midget bipolar cells directly in preparation 15649 (Fig. 4) we found that Islet-positive ON bipolar cells outnumber OFF midget bipolar cells by at least 20% up to 4 mm eccentricity (Figs. 6C, 6D).
To determine the average density of ON cone bipolar cells in the INL we subtracted the average density of rod bipolar cells obtained from PKCα labeling in our previous study8 from the average density of Islet-1 positive bipolar cells. In Figure 7 we compare the average density of different bipolar types at 1 mm, 2 mm and 3 mm eccentricity for four preparations (13587, 13699, 14064, 15649). The data for the OFF cone bipolar cell types (midget, DB3a and DB3b) are from our previous study.5 For all cone bipolar types, the peak density is around 1 mm and decreases thereinafter, whereas rod bipolar cell density peaks between 2 and 4 mm eccentricity.
Figure 7.

Average density of ON and OFF bipolar cell types at 1-, 2- and 3 mm eccentricity counted directly from immunolabeled vibratome sections from up to four preparations (13587, 13699, 14064, 15649). The error bars show standard deviation between preparations. At least three preparations were measured for each eccentricity excepting DB3b cells at 3 mm, where the two values measured were 2587.1 (case 13699) and 2813.3 (case 15649).
Amacrine Cells
Amacrine cells were identified with antibodies against glycine transporter 1 (GlyT1) to distinguish glycinergic amacrine cells26,27 and antibodies against the GABA synthesizing enzyme glutamic acid decarboxylase (GAD) to distinguish GABAergic amacrine cells8,14 (Figs. 8A, 8B). At eccentricities between about 1 and 2 mm amacrine cell somas form two rows and from 2 mm eccentricity onwards they form one row. We quantified the spatial density of amacrine cells for two preparations (13587 and 14064) taking DAPI labeling and differential contrast optics into account as outlined in the methods. Both GABAergic and glycinergic amacrine cells were found as close as 100 µm from the foveal center and followed comparable patterns of distribution. The peak density (located between 1 and 2 mm) is 13,550 cells/mm2 for glycinergic amacrine cells and 8500 cells/mm2 for GABAergic amacrine cells. The amacrine density gradually declines between 1 and 5 mm and steadies thereinafter (Figs. 8C, 8D). On average, the density of glycinergic amacrine cells is higher than that of GABAergic cells across all eccentricities (Fig. 8E). The ratio of glycinergic amacrine cells to GABAergic amacrine cells is 1.6:1 at their respective peak densities and 1:1 outside macular retina.
Figure 8.

Amacrine cells. Confocal images of vertical sections through donor retina 13587 (age 44 years) which were processed with antibodies against glycine transporter 1 (GlyT1, green) or glutamic acid decarboxylase (GAD-6, magenta). (A, B) Fluorescent images taken at eccentricities between 2 and 3 mm with Nomarski optics image to reveal retinal layers. (A) Glycinergic amacrine cells express glycine transporter 1 (GlyT1). (B) GABAergic amacrine cells express GAD-6. Displaced GABAergic amacrine cells are visible in the ganglion cells layer (arrowhead) but were not quantified. The spatial density of glycinergic amacrine cells (C) and GABAergic amacrine cells (D) was quantified in two preparations. (E) Pooled fits for GlyT1 positive glycinergic and GAD positive GABAergic amacrine cells up to 15 mm eccentricity. Abbreviations as in Figure 1. Scale bar: 50 µm in B (applies to A, B). Error bars in E (in some cases smaller than the marker symbols) show standard deviations for pooled data.
Müller Cells
Müller cells were identified with antibodies against glutamine synthetase.28 Glutamine synthetase is localized to the somas of Müller cells, and is strongly expressed in their processes alongside the Henle fibers and in their end feet (Figs. 9A–9D). The morphology of Müller cells observed in our preparations was consistent with previous descriptions.9,29,30 The cell bodies of Müller cells are located sclerad to the amacrine cell layer (Figs. 9B–9D). We counted Müller cell somas in combination with DAPI labeling and differential interference contrast to improve accuracy in identifying the polygonal cell bodies (Figs. 9B–9D).
Figure 9.

Müller cells. Confocal images of vertical sections through human donor retinas which were processed with antibodies against glutamine synthetase (GS). (A) Fluorescent micrograph taken at 1 mm eccentricity (preparation 14064, 44-year-old female donor) showing GS immunoreactivity (green) together with DAPI nuclear labeling (white) and differential contrast optics. The rectangle indicates the region shown in B. (B) Higher resolution image of the inner nuclear layer (INL) region indicated in A. GS-positive Müller cell somas (stars) are located in between amacrine (A) and bipolar (B) cells. (C, D) Fluorescent micrograph taken at 8 mm eccentricity (preparation 15415, 54-year-old female donor) showing GS immunoreactive Müller cell somas (stars) intermingled with amacrine (A) and bipolar (B) cells. Scale bar: 50 µm (A). Scale bar: 50 µm (B–D).
The spatial density of Müller cells was determined for four preparations. The average peak density of Müller cells was 24,000 cells/mm2 at roughly 0.8 mm from the foveal center (Figs. 10A–10D). In central retina, there was considerable variation in the density of Müller cells both within and between individuals; for example, at 1 mm eccentricity, density counts ranged from 9800 to 31,000 cells/mm2. Some of this variation is likely attributable to the gossamer-like morphology of the Müller cell membranes, which made the task of cell counting more difficult than was the case for the other INL populations. For one preparation (case 15415) we could make counts on the foveal slope and found a minimum density value 3600 cells/mm2 at 0.25 mm (indicated by arrows in Fig. 10A), but we could not measure at the foveolar floor and did not specifically address the question of density and morphology in foveolar Müller populations.10 The Müller cell density gradually declines outside the macula to ∼10,000 cells/mm2 by 11 mm eccentricity (Fig. 10B). Similarly, the Müller cell density in macaque monkey retina has a peak of ∼ 30,000 cells/mm2 within 2 mm eccentricity (10° of visual angle) and drops to ∼10,000 cells/mm2 in far peripheral retina (>12 mm or over 30°).30
Figure 10.

Spatial density of Müller cells. (A) A spatial density quantified from four preparations. Arrows indicate eccentricity (0.25 mm) and density (3600 cells / mm2) of the closest sample to the fovea that could be measured. (B) Population fit for the density of Müller cells in human retina across the four samples shown in A. Error bars (in some cases smaller than the marker symbols) show standard deviations for pooled data. (C) Comparison of Müller cell density with cone inner segment density measured in the same retinas.5 (D) Ratio of Müller cells to cone inner segments. Inset graph shows ratios within 2 mm eccentricity allowing for foveal lateral displacements. See text for details.
Figure 10C compares the density of Müller cells with that of cone inner segments measured in our previous study of the same retinas5; the density ratio between the populations is shown in Figure 10D. The ratios for central retina (inset, Fig. 10D) take foveal displacement into account as described in the methods section. Consistent with previous estimates in macaque31 and human,10 we find between one and two Müller cells for every foveal cone (inset, Fig. 10D). What is new here is that we find a steady increase in the ratio of Müller cells to cones with increasing eccentricity outside the macula, with over 10 Müller cells per cone at 15 mm (Fig. 10D).
Proportions of Cell Populations in the Inner Nuclear Layer
Using the data reported in the foregoing sections, in combination with our previously published values obtained from the same retinas,5,8 we plot the ratios of the major cell classes in the INL for our most thoroughly characterized retina (case 13587, Fig. 11A). The density of cone bipolar cells was estimated by combining the densities of OFF midget bipolar, DB3a, and DB3b cells5 with the density of Islet-1–positive bipolar cells and then subtracting the density of rod bipolar cells.8 It should be noted that the OFF cone bipolar types DB1 and DB2 are missing from this dataset because their densities were not measured. The question whether other cell types may be missing is discussed further below.
Figure 11.

Distribution of cell classes in the inner nuclear layer. (A) The relative proportions of the major cell classes in the inner nuclear layer at 1mm, 5 mm, and 10 mm eccentricity. (B) Comparison of labeled cell classes (shown as stacked bar plots) with total INL nuclei labeled with DAPI at five retinal locations on temporal axis, for case 13587 (age 44 years). (C) The same comparison at three retinal locations on temporal axis, for case 14604 (age 44 years).
In central retina the density of cone bipolar cells is about four times higher than of the other cell classes, but in peripheral retina the cone bipolar density decreases, and is only slightly higher than that of the other cell classes in the INL. Figure 11B shows the fraction of each population for three eccentricities (1mm, 5 mm, and 10 mm) in the same preparation. The data support the view that the cone bipolar fraction is highest in central retina. Here, on average, cone bipolar cells make up 52% of all cells in the INL, rod bipolar cells 9%, amacrine cells 18%, horizontal cells 14%, and Müller cells 18% (range, 17%–27%). These proportions do not change dramatically with increasing eccentricity: a decrease in proportion of cone bipolar cells from 52% at 1 mm to 37% at 10 mm is roughly balanced by increased proportions of rod bipolar cells (from 9% to 16%). The proportion of Müller cells, however, rises from 17% to 27%. In sum, despite large changes in absolute density of INL populations on passing from central to peripheral retina, the overall neuronal makeup of the INL remains relatively stable.
Two natural questions arise from these data. First, has our bank of cell labels accounted for the entire INL (in other words, have any INL populations remained unlabeled)? Second, how representative is the best-studied case shown in Figures 11A and 11B? We attacked these questions by comparing the total density of all identified cell populations in the INL with the density of DAPI labeled nuclei, and by making a parallel set of counts from a second retina (case #14064). We found that there is a small but consistent discrepancy between the total density of DAPI labeled INL nuclei (gray bars, Figs. 11C, 11D) and the total density of the antibody-labeled populations, (stacked bar plots, Figs. 11C, 11D). We refer to this discrepancy hereinafter as the “DAPI-gap.” The DAPI-gap magnitude must be roughly 10% of the total INL population, because the DAPI densities are on average 10.6% greater than the combined antibody-labeled population densities (SD 6.5; range, 4.2–21.2).
Table 4 shows integrated cell numbers from our pooled data, at three radial eccentricities corresponding to the Early Treatment Diabetic Retinopathy Study Group subfields Center (0.5 mm), Inner Ring (1.5 mm), and Outer Ring (3.0 mm), as well as at 10 mm (∼35°) eccentricity. For postreceptoral populations below 10 mm eccentricity the magnitude of spatial displacement (column CED) and integrated cell numbers incorporating spatial displacement (column IND) are also shown.
Table 4.
Integrated Cell Numbers
| Cell | OSE | INU | CED | IND |
|---|---|---|---|---|
| Class | (mm) | (cells/1000) | (mm) | (cells/1000) |
| Amacrine | ||||
| 0.5 | 8.8 | 0.84 | 43.0 | |
| 1.5 | 197.9 | 1.72 | 272.8 | |
| 3.0 | 821.3 | 3.06 | 849.9 | |
| 10.0 | 3382.2 | n.d. | n.d. | |
| Cone bipolar | ||||
| 0.5 | 16.7 | 0.84 | 122.5 | |
| 1.5 | 528.5 | 1.72 | 695.9 | |
| 3.0 | 1768.1 | 3.06 | 1823.5 | |
| 10.0 | 9965.5 | n.d. | n.d. | |
| Cone | ||||
| 0.5 | 45.5 | 0.84 | n.d. | |
| 1.5 | 158.3 | 1.72 | n.d. | |
| 3.0 | 434.3 | 3.06 | n.d. | |
| 10.0 | 1729.5 | n.d. | n.d. | |
| Ganglion | ||||
| 0.5 | 12.3 | 0.89 | 71.9 | |
| 1.5 | 237.6 | 1.73 | 308.9 | |
| 3.0 | 640.8 | 3.06 | 653.5 | |
| 10.0 | 903.0 | n.d. | n.d | |
| Horizontal | ||||
| 0.5 | 3.9 | 0.84 | 32.7 | |
| 1.5 | 134.0 | 1.72 | 172.0 | |
| 3.0 | 385.9 | 3.06 | 396.1 | |
| 10.0 | 2090.7 | n.d. | n.d. | |
| Müller | ||||
| 0.5 | 14.5 | 0.83 | 53.2 | |
| 1.5 | 166.3 | 1.72 | 209.8 | |
| 3.0 | 516.5 | 3.06 | 532.8 | |
| 10.0 | 4172.9 | n.d. | n.d. | |
| Rod bipolar | ||||
| 0.5 | 0.9 | 0.84 | 19.2 | |
| 1.5 | 91.7 | 1.72 | 123.0 | |
| 3.0 | 353.7 | 3.06 | 367.8 | |
| 10.0 | 3285.6 | n.d. | n.d. |
OSE, cone outer segment eccentricity; INU, integrated cell number; CED, eccentricity incorporating foveal displacement; IND, integrated cell number incorporating foveal displacement; n.d., not determined.
The pattern of results for cones and ganglion cells is broadly consistent with previous studies of these cell populations in human and macaque retina.3,4,16,31,32 For example, 45,500 cones within 0.5 mm radius of the foveal center supply 71,900 ganglion cells located up to 0.89 mm of the foveal center. Such data could in principle be compared to cell numerosities inferred from single cell RNA sequencing in macaque retina19 and human retinas,20,33,34 but such detailed comparisons are beyond the scope of the present study.
Discussion
The present study has provided the first comprehensive analysis of neurons in the inner nuclear layer of the human retina. Combining rod and cone bipolar cells shows that the fraction of all cell classes in the inner nuclear layer is fairly consistent across all eccentricities and between different retinas.
Recent studies have used single-cell RNA sequencing techniques to investigate cell populations in human and nonhuman primates.19,20,33,34 Although there are obvious differences between the methods used in these studies compared to our study, it is worth noting that these different methods arrived at similar conclusions with respect to cell ratios. For example, Yan and colleagues19,33 used 1.5 mm–diameter punches centered on the fovea and report that the H1:H2 cell ratio is higher in this region compared to peripheral retina, and similarly the GABAergic to glycinergic amacrine cell ratio was lower in peripheral retina.
Inventory of INL Cells
When we combined the density of immunolabeled cell populations with the density of all DAPI-labeled INL nuclei, we concluded that our bank of antibodies has left ∼10% of INL cells unlabeled (the “DAPI-gap”, Fig. 11). Although only two retinas were comprehensively labeled with all antibodies, the consistent cross-individual densities of the individual populations studied (Figs. 3, 6, 8, 10) give us confidence that the proportions we report here would be applicable to other normal human retinas. We are confident that the antibodies against GABA and glycine (Figs. 8A, B) together have labeled the great majority of amacrine cells,7 the antibodies against parvalbumin (Fig. 2) have identified essentially all horizontal cells,18–20,33 and the antibodies against PKCα have identified all rod bipolar cells (Fig. 5).8 Thus we can conclude that cone bipolar cells are the most likely contributor to the DAPI-gap (cf. Fig. 5). Among the OFF cone bipolar types, we are missing types DB1 and DB2 cells, and among the ON cone bipolar types we are missing DB4 cells, which were Islet-1 negative (Fig. 5). But because diffuse bipolar cell types make up only a low proportion of cone bipolar cells,25 it is possible that other ON cone bipolar cell types35,36 were not labeled for Islet-1 and thus are not included in our counts. Which other ON cone bipolar cell type(s) are immunonegative to antibodies against Islet-1 remains an open question.
Relevance to the Diagnosis and Treatment of Retinal Disease
Knowledge of the spatial distribution of cells across the retina can serve as a reference in the interpretation of diagnostic signals such as the multifocal electroretinogram and optical coherence tomogram17,37,38 (but see references 39 and 40), for detection of abnormalities in disease and for informed targeting of treatments. In conditions such as age-related macular degeneration and retinitis pigmentosa, rod and cone photoreceptors degenerate but many downstream neurons survive.41–46 Our data provide a baseline to guide the delivery of treatments which take advantage of surviving neurons.
Acknowledgments
The authors thank Arzu Demir for assistance with experiments and the Lions NSW Eye Bank and Australian Ocular Biobank for providing postmortem eye tissue.
Supported by Project Grant APP1123418 from the National Health & Medical Research Council (UG and PRM), Fellowship of the Sydney Medical School Foundation (UG); Research Training Program Scholarship of the Australian Government (RAM); Ophthalmology and Vision Science PhD Scholarship by Save Sight Institute (RAM).
Disclosure: R.A. Masri, None; F. Weltzien, None; S. Purushothuman, None; S.C.S. Lee, None; P.R. Martin, None; U. Grünert, None
References
- 1. Hendrickson A. Organization of the adult primate fovea. In: Penfold PL, Provis JM, eds. Macular Degeneration. Berlin: Springer; 2005. [Google Scholar]
- 2. Hood DC. Assessing retinal function with the multifocal technique. Prog Retin Eye Res. 2000; 19: 607–646. [DOI] [PubMed] [Google Scholar]
- 3. Curcio CA, Allen KA.. Topography of ganglion cells in human retina. J Comp Neurol. 1990; 300: 5–25. [DOI] [PubMed] [Google Scholar]
- 4. Curcio CA, Sloan KR, Kalina RE, Hendrickson AE.. Human photoreceptor topography. J Comp Neurol. 1990; 292: 497–523. [DOI] [PubMed] [Google Scholar]
- 5. Masri RA, Grünert U, Martin PR.. Analysis of parvocellular and magnocellular visual pathways in human retina. J Neurosci. 2020; 40: 8132–8148. [DOI] [PMC free article] [PubMed] [Google Scholar]
- 6. Thoreson WB, Dacey DM.. Diverse cell types, circuits, and mechanisms for color vision in the vertebrate retina. Physiol Rev. 2019; 99: 1527–1573. [DOI] [PMC free article] [PubMed] [Google Scholar]
- 7. Grünert U, Martin PR.. Cell types and cell circuits in human and non human primate retina. Prog Retin Eye Res. 2020; 78: 100844. [DOI] [PubMed] [Google Scholar]
- 8. Lee SCS, Martin PR, Grünert U.. Topography of neurons in the rod pathway of human retina. Invest Ophthalmol Vis Sci. 2019; 60: 2848–2859. [DOI] [PubMed] [Google Scholar]
- 9. Bringmann A, Pannicke T, Grosche J, et al.. Müller cells in the healthy and diseased retina. Prog Retin Eye Res. 2006; 25: 397–424. [DOI] [PubMed] [Google Scholar]
- 10. Bringmann A, Syrbe S, Görner K, et al.. The primate fovea: structure, function and development. Prog Ret Eye Res. 2018; 66: 49–84. [DOI] [PubMed] [Google Scholar]
- 11. Zhang T, Zhu L, Madigan MC, et al.. Human macular Müller cells rely more on serine biosynthesis to combat oxidative stress than those from the periphery. Elife. 2019; 8: e43598. [DOI] [PMC free article] [PubMed] [Google Scholar]
- 12. Polyak SL. The Retina. Chicago: The University of Chicago Press; 1941 [Google Scholar]
- 13. Provis JM, Dubis AM, Maddess T, Carroll J.. Adaptation of the central retina for high acuity vision: cones, the fovea and the avascular zone. Prog Retin Eye Res. 2013; 35: 63–81. [DOI] [PMC free article] [PubMed] [Google Scholar]
- 14. Strettoi E, Masri RA, Grünert U.. AII amacrine cells in the primate fovea contribute to photopic vision. Sci Rep. 2018; 8: 16429. [DOI] [PMC free article] [PubMed] [Google Scholar]
- 15. Pollreisz A, Reiter GS, Bogunovic H, et al.. Topographic Distribution and Progression of Soft Drusen Volume in Age-Related Macular Degeneration Implicate Neurobiology of Fovea. Invest Ophthalmol Vis Sci. 2021; 62: 26. [DOI] [PMC free article] [PubMed] [Google Scholar]
- 16. Schein SJ. Anatomy of macaque fovea and spatial densities of neurons in foveal representation. J Comp Neurol. 1988; 269: 479–505. [DOI] [PubMed] [Google Scholar]
- 17. Curcio CA, Messinger JD, Sloan KR, Mitra A, McGwin G, Spaide RF.. Human chorioretinal layer thicknesses measured in macula-wide, high-resolution histologic sections. Invest Ophthalmol Vis Sci. 2011; 52: 3943–3954. [DOI] [PMC free article] [PubMed] [Google Scholar]
- 18. Wässle H, Dacey D, Haun T, Haverkamp S, Grünert U, Boycott BB.. The mosaic of horizontal cells in the macaque monkey retina: with a comment on biplexiform ganglion cells. Visual Neurosci. 2000; 17: 591–608. [DOI] [PubMed] [Google Scholar]
- 19. Peng YR, Shekhar K, Yan W, et al.. Molecular classification and comparative taxonomics of foveal and peripheral cells in primate retina. Cell. 2019; 176: 1222–1237. [DOI] [PMC free article] [PubMed] [Google Scholar]
- 20. Lu Y, Shiau F, Yi W, et al.. Single-Cell Analysis of Human Retina Identifies Evolutionarily Conserved and Species-Specific Mechanisms Controlling Development. Dev Cell. 2020; 53: 473–491.e9. [DOI] [PMC free article] [PubMed] [Google Scholar]
- 21. Haverkamp S, Haeseleer F, Hendrickson A.. A comparison of immunocytochemical markers to identify bipolar cell types in human and monkey retina. Visual Neurosci. 2003; 20: 589–600. [DOI] [PubMed] [Google Scholar]
- 22. Milam AH, Dacey DM, Dizhoor AM.. Recoverin immunoreactivity in mammalian cone bipolar cells. Visual Neurosci. 1993; 10: 1–12. [DOI] [PubMed] [Google Scholar]
- 23. de Souza CF, Nivison-Smith L, Christie DL, et al.. Macromolecular markers in normal human retina and applications to human retinal disease. Exp Eye Res. 2016; 150: 135–148. [DOI] [PubMed] [Google Scholar]
- 24. Greferath U, Grünert U, Wässle H.. Rod bipolar cells in the mammalian retina show protein kinase C-like immunoreactivity. J Comp Neurol. 1990; 301: 433–442. [DOI] [PubMed] [Google Scholar]
- 25. Grünert U, Martin PR, Wässle H.. Immunocytochemical analysis of bipolar cells in the macaque monkey retina. J Comp Neurol. 1994; 348: 607–627. [DOI] [PubMed] [Google Scholar]
- 26. Pow DV, Hendrickson AE.. Distribution of the glycine transporter glyt-1 in mammalian and nonmammalian retinae. Visual Neurosci. 1999; 16: 231–239. [DOI] [PubMed] [Google Scholar]
- 27. Lee SCS, Weltzien F, Madigan MC, Martin PR, Grünert U.. Identification of AII amacrine, displaced amacrine and bistratified ganglion cell types in human retina with antibodies against calretinin. J Comp Neurol. 2016; 524: 39–53. [DOI] [PubMed] [Google Scholar]
- 28. Nishikawa S, Tamai M.. Müller cells in the human foveal region. Curr Eye Res. 2001; 22: 34–41. [DOI] [PubMed] [Google Scholar]
- 29. Kalloniatis M, Marc RE, Murry RF.. Amino acid signatures in the primate retina. J Neurosci. 1996; 16: 6807–6829. [DOI] [PMC free article] [PubMed] [Google Scholar]
- 30. Distler C, Dreher Z.. Glia cells of the monkey retina. II. Müller cells. Vision Res. 1996; 36: 2381–2394. [DOI] [PubMed] [Google Scholar]
- 31. Ahmad KM, Klug K, Herr S, Sterling P, Schein S.. Cell density ratios in a foveal patch in macaque retina. Visual Neurosci. 2003; 20: 189–209. [DOI] [PubMed] [Google Scholar]
- 32. Wässle H, Grünert U, Röhrenbeck J, Boycott BB.. Cortical magnification factor and the ganglion cell density of the primate retina. Nature. 1989; 341: 643–646. [DOI] [PubMed] [Google Scholar]
- 33. Yan W, Peng YR, van Zyl T, et al.. Cell atlas of the human fovea and peripheral retina. Sci Rep. 2020; 10: 9802. [DOI] [PMC free article] [PubMed] [Google Scholar]
- 34. Cowan CS, Renner M, De Gennaro M, et al.. Cell types of the human retina and its organoids at single-cell resolution. Cell. 2020; 182: 1623–1640.e34. [DOI] [PMC free article] [PubMed] [Google Scholar]
- 35. Boycott BB, Wässle H.. Morphological classification of bipolar cells of the primate retina. Eur J Neurosci. 1991; 3: 1069–1088. [DOI] [PubMed] [Google Scholar]
- 36. Tsukamoto Y, Omi N.. ON bipolar cells in Macaque retina: type-specific synaptic connectivity with special reference to OFF counterparts. Front Neuroanat. 2016; 10: 104. [DOI] [PMC free article] [PubMed] [Google Scholar]
- 37. Cuenca N, Ortuño-Lizarán I, Pinilla I.. Cellular characterization of OCT and outer retinal bands using specific immunohistochemistry markers and clinical implications. Ophthalmology. 2018; 125: 407–422. [DOI] [PubMed] [Google Scholar]
- 38. Cuenca N, Ortuño-Lizarán I, Sánchez-Sáez X, et al.. Interpretation of OCT and OCTA images from a histological approach: Clinical and experimental implications. Prog Retin Eye Res. 2020; 77: 100828. [DOI] [PubMed] [Google Scholar]
- 39. Curcio CA, Sparrow JR, Bonilha VL, Pollreisz A, Lujan BJ. Re: Cuenca, et al. Cellular characterization of OCT and outer retinal bands using specific immunohistochemistry markers and clinical implications (Ophthalmology. 2018;125;407-422).[letter]. Ophthalmology. 2018; 125(7): e47–e48. [DOI] [PubMed] [Google Scholar]
- 40. Pollreisz A, Neschi M, Sloan KR, et al.. Atlas of human retinal pigment epithelium organelles significant for clinical imaging. Invest Ophthalmol Vis Sci. 2020; 61: 13. [DOI] [PMC free article] [PubMed] [Google Scholar]
- 41. Stone JL, Barlow WE, Humayun MS, de Juan EJ, Milam AH.. Morphometric analysis of macular photoreceptors and ganglion cells in retinas with retinitis pigmentosa. Arch Ophthalmol. 1992; 110: 1634–1639. [DOI] [PubMed] [Google Scholar]
- 42. Santos A, Humayun MS, de Juan EJ, et al.. Preservation of the inner retina in retinitis pigmentosa. A morphometric analysis. Arch Ophthalmol. 1997; 115: 511–515. [DOI] [PubMed] [Google Scholar]
- 43. Medeiros NE, Curcio CA.. Preservation of ganglion cell layer neurons in age-related macular degeneration. Invest Ophthalmol Vis Sci. 2001; 42: 795–803. [PubMed] [Google Scholar]
- 44. Edwards MM, McLeod DS, Bhutto IA, Grebe R, Duffy M, Lutty GA.. Subretinal glial membranes in eyes with geographic atrophy. Invest Ophthalmol Vis Sci. 2017; 58: 1352–1367. [DOI] [PMC free article] [PubMed] [Google Scholar]
- 45. Li M, Dolz-Marco R, Huisingh C, et al.. Clinicopathologic correlation of geographic atrophy secondary to age-related macular degeneration. Retina. 2019; 39: 802–816. [DOI] [PMC free article] [PubMed] [Google Scholar]
- 46. Li M, Huisingh C, Messinger J, et al.. Histology of geographic atrophy secondary to age-related macular degeneration: a multilayer approach. Retina. 2018; 38: 1937–1953. [DOI] [PMC free article] [PubMed] [Google Scholar]