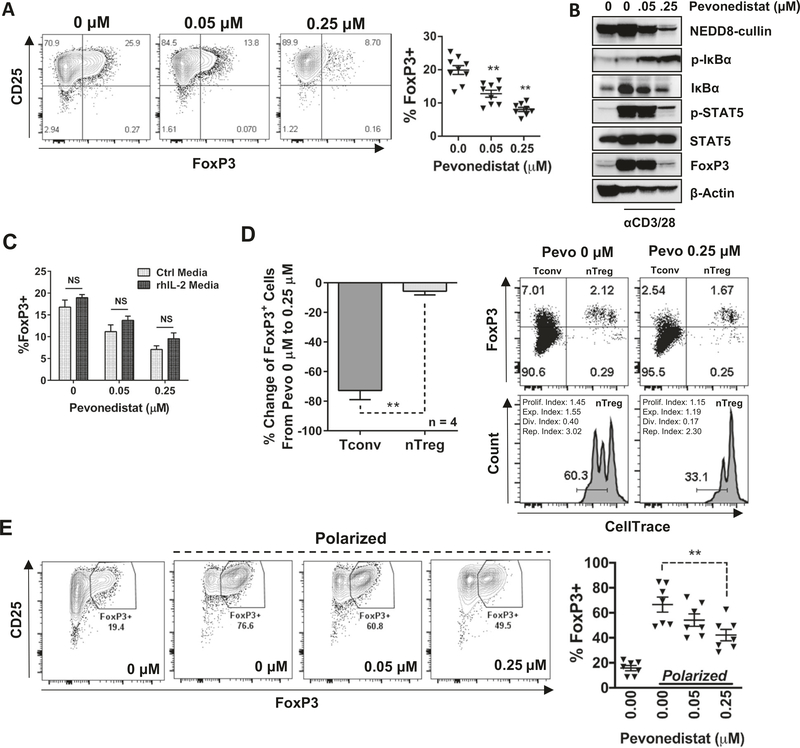
Fig. 3. Pevonedistat prevents differentiation of iTregs.
Magnetically enriched CD3+ cells were activated with 0.5 μg/mL αCD3/28 for 24 h. Thereafter, stimulation continued in the presence of the indicated doses of pevonedistat or vehicle control for an additional 72 h. Data are mean ± standard error (SE). Student’s t test was performed for statistical analysis, *p < 0.05, **p < 0.01 vs. control. a FoxP3 expression was quantified in CD4+ T cells by flow cytometry. b Cells were collected after 72 h of drug exposure and whole-protein lysates were subjected to immunoblotting. c nTregs and Tconvs were separated by FACS. nTregs were then stained with CellTrace dye and remixed with Tconvs. After 72 h of TCR engagement, FoxP3 expression was quantified within both nTregs and Tconvs by flow cytometry. d Enriched CD3+ T cells were incubated with or without exogenous rh-IL-2 (20 ng/mL) for the entirety of activation and drug treatment. FoxP3 expression within CD4+ T cells was quantified by flow cytometry. e Sorted naive CD4+ T cells were subjected to Treg-polarizing conditions for 96 h, in the presence of the indicated concentrations of pevonedistat. FoxP3 expression was analyzed as previously.

