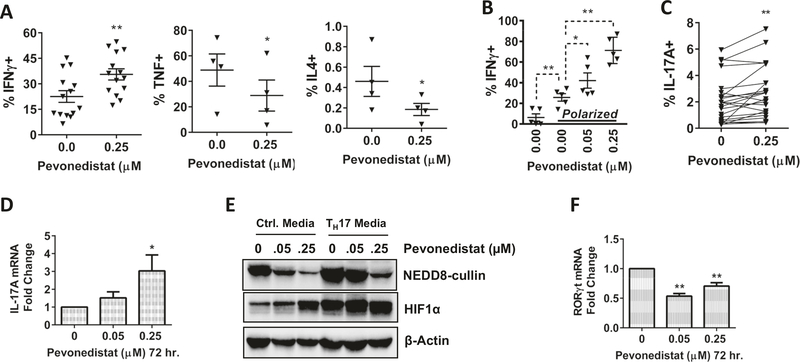
Fig. 4. Pevonedistat alters the polarization of CD4+ T cells.
Magnetically enriched CD3+ cells were activated with 0.5 μg/mL αCD3/28 for 24 h prior to exposure of pevonedistat. Cells resumed stimulation for 72 h in the presence of the drug. Data are mean ± standard error (SE). Student’s t test was performed for statistical analysis, *p < 0.05, **p < 0.01 vs. control. a CD3+ T cells were activated for 96 h. Thereafter, cells were restimulated with PMA/ionomycin in the presence of monensin for 5 h. Cytokine expression within CD4+ T cells was quantified by flow cytometry. b Sorted naive CD4+ T cells were incubated in TH1-polarizing conditions for 96 h, IFNγ cytokine expression was measured following the procedures described above. c–f CD3+ T cells were TCR-stimulated in the presence of pevonedistat for 10 days. IL-17A cytokine expression within CD4+ T cells was quantified as previously described above (c). Cells were harvested and mRNA expression was quantified by q-RT-PCR (d, f) or total lysate and subjected to immunoblotting (e).

