

Abstract
Recent studies have reported that optical indices of cerebral pulsatility are associated with cerebrovascular health in older adults. Such indices, including cerebral pulse amplitude and the pulse relaxation function (PRF), have been previously applied to quantify global and regional cerebral pulsatility. The aim of the present study was to determine whether these indices are modulated by cardiovascular status and whether they differ between individuals with low or high cardiovascular risk factors (LCVRF and HCVRF) and coronary artery disease (CAD). A total of 60 older adults aged 57–79 were enrolled in the study. Participants were grouped as LCVRF, HCVRF, and CAD. Participants were asked to walk freely on a gym track while a near‐infrared spectroscopy (NIRS) device recorded hemodynamics data. Low‐intensity, short‐duration walking was used to test whether a brief cardiovascular challenge could increase the difference of pulsatility indices with respect to cardiovascular status. Results indicated that CAD individuals have higher global cerebral pulse amplitude compared with the other groups. Walking reduced global cerebral pulse amplitude and PRF in all groups but did not increase the difference across the groups. Instead, walking extended the spatial distribution of cerebral pulse amplitude to the anterior prefrontal cortex when CAD was compared to the CVRF groups. Further research is needed to determine whether cerebral pulse amplitude extracted from data acquired with NIRS, which is a noninvasive, inexpensive method, can provide an index to characterize the cerebrovascular status associated with CAD.
Keywords: cardiovascular risk factors, cerebral pulsatility, coronary artery disease, near‐infrared spectroscopy, older adults, walking
Optical index of cerebral pulsatility extracted from near‐infrared spectroscopy data indicates that there is a higher cerebral pulse amplitude in older adults with coronary artery disease compared with older adults cardiovascular risk factors.

1. INTRODUCTION
Cardiovascular functions influence cerebral hemodynamics (Saha et al., 1993; Ritz, van Buchem, & Daemen, 2013; Oh et al., 2012). In a healthy individual, the heart generates blood flow and pressure in the central arteries that are sufficiently pulsatile to provide adequate perfusion for distal cerebral regions (Mitchell, 2008; Zarrinkoob et al., 2016). The arterial tree regulates this pulsatile flow into relatively constant blood flow as the blood travels toward the brain microcirculation (Barić, 2014; Mitchell, 2008; Satish & Tadi, 2020). Healthy brain metabolism and microvascular integrity are supported by the efficiency of this regulation (McDonald, 2011). With aging, impairment of the arterial tree functions causes the cushioning of arterial pulsations to diminish; hence, higher pulsatility is transferred to distal brain arteries (Mitchell, 2008; Zarrinkoob et al., 2016).
Presence of cardiovascular risk factors (CVRF) can exacerbate transferring higher pulsatility to the cerebral circulation (Pase, Grima, Stough, Scholey, & Pipingas, 2012). Also, impairment in the heart function, as the primary generator of pulsatile flow and pressure, can impair cerebral hemodynamics (Lutski, Haratz, Weinstein, Goldbourt, & Tanne, 2018). Indeed, heart diseases such as coronary artery disease (CAD) are linked to modified cerebral hemodynamics and cerebrovascular damage (Anazodo et al., 2016; Zheng et al., 2012). Although a large proportion of older adults are exposed to both CVRF and CAD, little attention has been paid to whether cerebral pulsatility differs between patients with CVRF and those with CAD.
At rest, even in some individuals with CAD, compensatory mechanisms may efficiently and sufficiently regulate cardiac output and cerebral blood flow (Koike et al., 2008). However, during physical activity, higher oxygen demand increases the blood flow of exercising muscles. This could influence the hemodynamics of other organs, such as the brain (Koike et al., 2008). Furthermore, physical activity temporarily escalates systolic blood pressure and imposes higher stress on the arterial walls (Wielemborek‐Musial, Szmigielska, Leszczynska, & Jegier, 2016 ) where we suspect the impairment in the damping of pulsatility is more pronounced. Hence, it is possible that physical activity allows us to identify hemodynamic differences that are not seen in the resting state. Therefore, we sought to explore whether low‐intensity, short‐duration walking as a common daily task increases the difference of cerebral pulsatility indices and improves differentiation between CVRF and CAD individuals.
There are several noninvasive tools for quantitative assessment of cerebral pulsatility. Carotid ultrasound (Chuang et al., 2016; Ozari et al., 2012), transcranial Doppler ultrasound (Al‐Jehani, 2014; Ghorbani, Ahmadi, & Shemshaki, 2015), and phase‐contrast magnetic resonance imaging (PC‐MRI) data can be used to index pulsatility in the carotids and vertebral arteries (Wåhlin et al., 2012; Wåhlin, Ambarki, Birgander, Malm, & Eklund, 2014) or other cerebral arteries such as the middle cerebral arteries (MCAs, Zarrinkoob et al., 2016). Other indices of pulsatility can be extracted from pulse wave velocity (PWV; O'Rourke & Jiang, 2001), which determines velocity by measuring pulse transit time in a known vascular path length (often the carotid‐femoral arteries). Another simple and inexpensive peripheral index of arterial pulsatility is determined based upon the difference between systole and diastole in the pulse cycle using pulse plethysmography (Elgendi, 2012). Notably, all these techniques are limited to probing larger vessels (Gupta, Lyons, & Hedgire, 2019; Nayak et al., 2015) and introduce a single, global index of pulsatility. Moreover, these techniques do not often reveal the spatial distribution of pulsatility indices across the cortical regions, especially in the natural setting of walking.
Near‐infrared spectroscopy (NIRS) can assess local cerebral pulsatility across the cortex noninvasively (Fabiani et al., 2014; Tan et al., 2017; Themelis et al., 2007). NIRS data often include heartbeat‐like components that originate from heart pulsations (Fabiani et al., 2014; Themelis et al., 2007). In each cardiac cycle, a volume of oxygenated blood pulsates into the cerebral arterial network (Themelis et al., 2007). The local increase in oxyhemoglobin concentration alters the intensity of near‐infrared light in the region probed by the NIRS source and detector pair (Fabiani et al., 2014; Themelis et al., 2007). In the earlier NIRS studies, these heartbeat‐like components were generally considered to be noise and were removed from the data (Themelis et al., 2007). In recent years, Fabiani et al. (2014) reported that indices extracted from these heartbeat‐like components can qualify cerebrovascular health. These indices such as cerebral pulse amplitude or pulse relaxation function (PRF) were correlated to cognition (Tan et al., 2016; Tan et al., 2017), and cardiorespiratory fitness (Tan et al., 2017). Despite these studies, to best of our knowledge, the relation between NIRS indices of cerebral pulsatility and cardiovascular status in humans remain to be further documented. Notably, the work of Fabiani et al. (2014) followed previous animal experiments by Themelis et al. (2007) who measured changes of local cerebral blood flow from the pulsatile component of NIRS data acquired from newborn pigs. Themelis et al. (2007) demonstrated that the pulsatile component of cerebral blood flow measured with NIRS is highly correlated with laser Doppler measurements of cerebral blood flow.
The objectives of the present study were twofold. (a) Assess the impact of LCVRF, HCVRF, and CAD on cerebral pulsatility indices extracted from NIRS data. We hypothesized that cerebral pulsatility is higher (cerebral pulse amplitude is higher and PRF is lower) in the CAD, HCVRF, and LCVRF respectively. (b) Evaluate whether short‐duration walking could increase cerebral pulsatility indices differently in these clinical groups. It was expected that after walking (AW) cerebral pulsatility reduces (cerebral pulse amplitude reduces and PRF increases) compared to before walking (BW) and that this change would be lower in CAD.
2. MATERIALS AND METHODS
2.1. Participants
A total of 60 older adults including 45% women (aged 57–78, right‐handed) were recruited for the study and divided into three groups according to their CVRF level and CAD diagnosis.
2.2. Screening procedure
Classical cardiovascular risk factors of (1) high total cholesterol (2) diabetes (3) hypertension (4) low high‐density lipoprotein (HDL) (5) high low‐density lipoprotein (LDL), and (6) smoking were considered, in addition to cardiovascular condition. The blood test results of the participants were reviewed by a cardiologist. The presence or absence of coronary heart disease (CHD) was determined from the clinical data assessment and the list of participants' medications, which enabled the cardiologist to classify the participants into two groups, non‐CAD and CAD. Patients with CAD had any of the risk factors (1), (2), (3), (4), and (5) in addition to any history of coronary artery disease, coronary artery bypass grafting or myocardial infarction events (that occurred more than a year prior to the experiment). The exclusion criteria for the CAD group were moderate to severe valvular heart disease, congestive heart failure, a recent history of myocardial infarction, overt neuropathy, and uncontrolled hypertension.
Non‐CAD participants were divided into two groups, which were the LCVRF and the HCVRF groups, based on the Framingham table (Wilson et al., 1998, see Section 2.3). All participants were screened for any previous head injury, neurological disorder, major psychiatric illness, renal disease, use of central nervous system affecter medication (benzodiazepine or any antidepressants), alcoholism, and a history of migraines. Approval of all aspects of this study was obtained from the ethics committee of the Montreal Heart Institute. Prior to participation, all enrolled participants were provided oral and written explanations of the study and the freedom to drop out. Written consent was obtained from each participant prior to the experiment.
2.3. Quantification of CVRF using Framingham table
Framingham scoring served as an index that combines scores of gender, age, cholesterol or LDL, HDL, blood pressure, diabetes mellitus and smoking status to estimate 10‐year risk of developing CHD events. In the Framingham table published by Wilson et al. (1998), risk factor tables categorize the measure of risk factor to low or very low or moderate, high or very high. We elected to assign the non‐CAD participants possessing very low, low, or moderate risk factors to LCVRF group. Also, participants with at least one high or very high‐risk factor were assigned to the HCVRF group. Due to the unavailability of Framingham age‐scores for individuals older than 74 years, the age‐scores for those five participants older than this age were linearly extrapolated.
2.4. Assessment of cardiorespiratory fitness on treadmill
Cardiorespiratory fitness (CRF) was assessed for each participant using a treadmill (T2000, GE Medical Systems, USA) with an individualized ramp protocol following a previously published protocol (Boidin et al., 2015; Gayda, Brun, Juneau, Levesque, & Nigam, 2008). During the test with the personalized ramp protocol, the speed and slope were gradually increased every 15 s to reach a linear load for a total duration of about 10 min (Myers et al., 1992). All participants were instructed to take their medications as they normally would. During the tests, the participants' electrocardiograms (ECG: Marquette case 12, GE Medical Systems, USA) were measured continuously. The rate of perceived exhaustion (RPE) according to Borg's scale (6–20) and blood pressure (manual measure: sphygmomanometer, Welsh Allyn, USA) were measured every 2 min. Criteria for the symptom‐limited maximal exercise test were the rate of perceived exertion ≥18 and/or ≥85% of age‐predicted maximal heart rate or patient exhaustion. The exercise was discontinued in cases of participant fatigue, dyspnea, abnormal blood pressure responses or electrocardiogram (ECG) abnormalities. The highest levels of metabolic equivalents (METs) were determined from maximal treadmill speed and grade as previously published (Boidin et al., 2015). At the end of the session, each participant had a 5 min passive recovery period. In order to normalize the METs data for sex, we calculated theoretical METs values using Wasserman/Hansen equations for the treadmill for each participant (Wasserman, Hansen, Sue, Stringer, Whipp, 2004). The ratio of raw METs values to the theoretical METs was then calculated and used for data analysis (Table 1).
TABLE 1.
Baseline characteristics of the participants
| Characteristics | LCVRF (n = 16) | HCVRF (n = 26) | CAD (n = 18) |
|---|---|---|---|
| Female/male (n) | 11/5 | 15/11 | 1/17 |
| Age (years) | 66.31 (4.52) | 66.96 (5.77) | 71.05 (4.06) |
| Resting SBP (mmHg) | 122.68 (7.25) | 124.57 (13.55) | 125.16 (15.22) |
| Resting DBP (mmHg) | 75.68 (6.38) | 76.38 (7.05) | 75.27 (7.07) |
| Pulse pressure (mmHg) | 43.24 (2.78) | 45.14 (5.98) | 54.97 (11.23) |
| NIRS‐estimated heart rate BW (beat/min) | 67.19 (7.16) | 70.13 (9.34) | 73.13 (11.09) |
| NIRS‐estimated heart rate AW (beat/min) | 88.76 (10.28) | 88.14 (11.09) | 102.81 (16.33) |
| METs | 1.41 (0.23) | 1.17 (0.26) | 1.19 (0.32) |
| Smoking, n (%) | 0 | 3 (11.54) | 1 (0.055) |
| Blood sample parameters | |||
| Total‐cholesterol (mmol L−1) | 4.80 (0.74) | 4.91 (1.29) | 3.65 (0.54) |
| LDL‐cholesterol (mmol L−1) | 2.68 (0.65) | 2.92 (1.09) | 1.80 (0.47) |
| HDL‐cholesterol (mmol L−1) | 1.64 (0.29) | 1.35 (0.54) | 1.27 (0.28) |
| Medication therapy | |||
| Aspirin, n (%) | 1 (5.55) | 5 (19.23) | 16 (88.89) |
| Beta‐blockers, n (%) | 1 (5.55) | 4 (15.38) | 12 (66.67) |
| Calcium‐antagonist, n (%) | 2 (11.11) | 4 (15.38) | 5 (27.78) |
| ACE‐inhibitor, n (%) | 0 | 3 (11.54) | 3 (16.67) |
| ARA, n (%) | 2 (11.11) | 8 (30.77) | 6 (33.33) |
| Treatment for CAD | |||
| Coronary angioplasty | 0 | 0 | 11 (61.11) |
| CABG | 0 | 0 | 6 (33.33) |
| Infarcts | 0 | 0 | 10 (55.56) |
Note: Variables are expressed as mean (standard deviation).
Abbreviations: ACE, angiotensin converting enzyme; ARA, angiotensin receptor antagonist; AW, standing rest after short‐duration walking; BW, standing rest before short‐duration walking; CABG, coronary artery bypass graft; CAD, coronary artery disease; DBP, diastolic blood pressure; HCVRF, high cardiovascular risk factors; HDL, high‐density lipoprotein; LCVRF, low cardiovascular risk factors; LDL, low‐density lipoprotein; METs, metabolic equivalents (ratio of METs value to theoretical METs); n, number of participants; SBP, systolic blood pressure; %, percent of participants.
2.5. Blood draw and blood pressure measurement
Blood samples were collected from each of the participants following overnight fasting. Glucose, cholesterol, LDL, and HDL levels were measured based on the protocol in Boidin et al., 2015 and in Gayda et al., 2008. Prior to walking, the average blood pressure was determined over 3 min of continuous measurement after the participant had rested for 10 min in a seated position. The blood pressure was taken on the right upper arm using a digital sphygmomanometer.
2.6. NIRS acquisitions
The NIRS system used for the acquisitions was an in‐house‐developed, fully portable system using 16 near‐infrared light emitting diode (LED) sources and 16 detectors mounted on a long‐lasting, flexible mesh to account for various head contours across the participants. This portable NIRS system was previously validated and used for other studies such as Lareau et al. (2011). The LEDs generated near‐infrared light at 735 and 850 nm. The design of the optodes featured a compression spring that provided stable contact with the scalp. Each source and detector were fixed on a socket using a stretchable band (Figure 1a,b). An orthogonal orientation was maintained with the skin surface to ensure a good skin‐optode contact, which boosts light‐coupling efficiency and an optimal co‐registration with the MRI template. The reflected near‐infrared light was captured using avalanche photodiodes located on the head. A source‐detector separation of 2.5–5.6 cm was used to detect hemodynamic changes from part of the frontal lobe and motor areas (Figure 1a). The frontal cortex is an area sensitive to age‐related decline and has demonstrated positive changes induced by physical activity (Agbangla, Audiffren, & Albinet, 2017; Greenwood, 2007). It is also an area in which changes in cerebral oxygenation are acquired with NIRS (Agbangla et al., 2017) in young and older adults in mobility‐based tasks (Vitorio, Stuart, Rochester, Alcock, & Pantall, 2017). Further, this area has been found to be a good target when exploring vascular changes in the aging brain (Desjardins, 2015). Pictures of the helmet and the whole system on a participant are shown in Figure 1c. One triaxial accelerometer was placed on the helmet. The data from the accelerometer and the 16 detectors were sent in real time by Bluetooth to a computer. A LabView (National Instrument, TX) user interface was used to calibrate the system, start and stop acquisitions, manage task triggers and visualize the recorded data. A lightweight black cloth was placed over the helmet to prevent ambient light from being detected by the detectors. The source and detectors were positioned according to the international 10–20 EEG system (Klem, Lüders, Jasper, & Elger, 1999).
FIGURE 1.

(a) Posterior–anterior view of the source and detector placements projected on the cortex. The red dots represent the sources, and the blue dots represent the detectors. Sixteen sources and 16 detectors were placed on the helmet. (b) Helmet and optode sockets. Source and detector housings are identical and are fixed on the helmet's sockets. (c) Participant equipped with the system. The prototype is attached on the back of the participant and sends data by Bluetooth to a computer
2.7. Walking paradigm
Participants were asked to walk freely at a self‐selected pace (similar to: Fraser, Dupuy, Pouliot, Lesage, & Bherer, 2016) for two distinct trials identified as blocks 1 and 2. The walking paradigm is similar to those presented in Beurskens, Helmich, Rein, and Bock (2014); Maidan et al. (2016); Mirelman et al. (2014). These trials were performed in a quiet room where markings on the ground indicated a 10‐m‐long trail to follow. The participants were instructed to walk the distance back and forth at a self‐selected pace for 30 s. The NIRS helmet was mounted on the participants' foreheads. Care was taken to place the NIRS optodes on the heads of the participants to establish a good coupling between the near‐infrared optodes and the head surface. In each trial, the participants returned to the origin after the end of trial. Participants were accompanied by a trainer to ensure safety in each walking trial. NIRS data were collected continuously during each block.
2.8. Windkessel model and cerebral pulsatility parameters
The pulsatile motion of blood expands the elastic arteries and arterioles (Themelis et al., 2007). It also induces periodic alterations in the concentration of oxy‐hemoglobin, which changes absorption of near‐infrared light. This attenuation can be measured by the near‐infrared source and detector pairs (Fabiani et al., 2014). A fluid dynamics model has been proposed to explain the association between local alterations of blood volume and detected near‐infrared light intensity described by the following equation (Cook, 2001; Wisely & Cook, 2001).
| (1) |
Here is the relative change in near‐infrared light intensity, is the instantaneous change in blood volume, is time, is the pulsatile flow (the difference between inflow and outflow), or inflow is the ejected flow from the left ventricle as estimated from a sine wave (Segers et al., 2008) with amplitude and frequency 1 Hz or . is the outflow or the flow through arterioles with resistance and pressure . Assuming a linear pressure‐volume relationship, the compliance of the artery is defined as Thus, the Windkessel equation can be rewritten:
| (2) |
2.8.1. Cerebral pulse amplitude
Assuming that inflow is predominant during systole, outflow can be neglected () (Themelis et al., 2007). Therefore, we can rewrite Equation (1):
| (3) |
Integrating both sides of the equation, can be written:
| (4) |
Solving Equation (4) for the beginning of the cardiac cycle (t 0 = 0), and for t max yields: . At a given pressure, as the compliance of the arterial wall decreases, the amplitude of the optically detected heartbeat increases. Here, systolic amplitude was calculated as the change in cerebral pulse amplitude from systolic peak to baseline value of pulse or preceding diastolic peak (Tan et al., 2017, Figure 2), normalized by the diastolic peak. Therefore, the cerebral pulse amplitude is proportional to the changes of signal intensity with respect to its baseline.
FIGURE 2.

Example of single cerebral pulse waveform for a participant. The change in intensity between the systolic and the diastolic peaks represents cerebral pulse amplitude. The shaded area represents the PRF as estimated by dividing the shaded area from systolic peak to the next diastolic peak to the cerebral pulse amplitude (adapted from Tan et al., 2017). ‐axis is time (s) and ‐axis is NIRS signal intensity. PRF, pulse relaxation function
2.8.2. Pulse relaxation function
PRF relates to the shape of the pulse during diastolic relaxation (Fabiani et al., 2014). At the end of systole, when cardiac ejection ceases, arterial inflow can be neglected () and the relaxation of the arterial elastic elements passively flushes the blood into the vascular bed. Solving the Windkessel first degree differential equation for in the diastolic phase yields:
| (5) |
The Windkessel model proposes that during diastole, the relaxation of the artery follows an exponential function with parameters dependent on the compliance of the artery (decay time ). This equation assumes that an elastic artery has a delayed recoil which in turn allows for an optimal temporal distribution of the pulse. Conversely, the loss of arterial wall elasticity is reflected in a shorter diastolic decay or a quick recoil. Fabiani et al. (2014) simplified the exponential function in Equation (5) to a straight line (Chiarelli et al., 2017) and subtracted the area under the relaxation curve from the area under the diastolic waveform to estimate the reflected wave. Here, PRF was determined as the integral of the area under the diastolic phase of the pulse waveform minus the area of the triangle estimating the relaxation curve. Next, this value was normalized by systolic amplitude (Fabiani et al., 2014, see Figure 2). Accordingly, the extent of arterial wall elasticity in cerebral arteries and arterioles can be related to the pulse amplitude and the shape of the cerebral heartbeat during diastolic relaxation by the degree that that arterial wall maintains its expanded volume during diastolic phase (Fabiani et al., 2014; Tan et al., 2017). Since the wavelength of 850 nm is more sensitive to the absorption of oxyhemoglobin (Themelis et al., 2007), data related to this wavelength were used for analysis of pulsatility parameters of the two blocks of the task.
2.9. Pulse pressure
Pulse pressure was calculated as the difference between systolic maximum and diastolic minimum of blood pressure measured on the arm (Wåhlin et al., 2014).
2.10. NIRS data processing
2.10.1. Preprocessing
Data analysis was performed using MATLAB 2017a (MathWorks, Natick, MA). In this study, we focused on the pre‐ and postwalking standing rest periods where data were not contaminated by motion. This distinction between motion and rest periods was made using accelerometer data (Figure 3a,b). Saturated channels were removed from the analysis and the raw NIRS data of the remaining channels were normalized to their means (Fabiani et al., 2014). Intensity data were filtered with a bandpass filter with cutoff frequencies at 0.5–5 Hz (Tan et al., 2017) to preserve brain physiology data while eliminating unwanted high‐ and low‐frequency noises. Motion artifacts were identified using accelerometer data and movement artifact functions in the HOMER2 toolbox (Huppert, Diamond, Franceschini, & Boas, 2009). In this study, data were inspected visually, channel by channel, to ensure movement artifacts were removed from the analysis. Next, we followed the approach in Pollonini et al. (2014) as a quality check for heartbeat epochs in one channel. In short, a good source detector coupling presents a prominent synchronized cardiac oscillation in both wavelengths. Hence, after preserving the cardiac component in both wavelengths, a cross‐correlation at time lag zero showed how well two wavelengths were coupled. The resulting number is called scalp coupling index (SCI) and served as a quality check for each channel. In this study, only channels with an SCI ≥0.8 were considered for further analysis.
FIGURE 3.
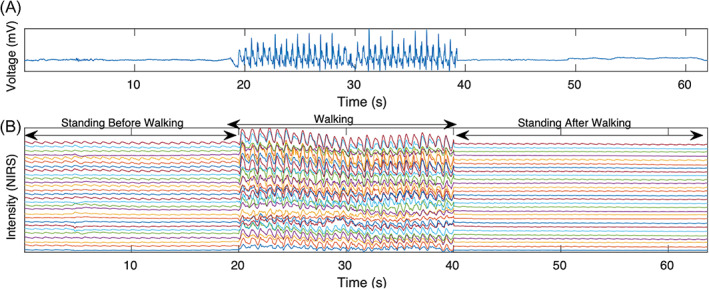
(a) Example of accelerometer data averaged over three axes including standing rest before short‐duration walking, walkig,and standing rest after short‐duration walking. (b) Example of the NIRS intensity data for wavelength 850 nm. A higher pulse amplitude in the standing rest before short‐duration walking in comparison with after short‐duration walking is clearly identifiable. NIRS, near‐infrared spectroscopy
2.10.2. Extraction of cerebral pulse amplitude and PRF
Heartbeat pulse epochs were analyzed for each resting period, BW and AW, separately. Local maxima (peaks) and local minima (nadirs) were determined with a semi‐automatic approach using the “FindPeak” function in MATLAB 2018a (MathWorks, Natick, MA). Each heartbeat epoch was tagged based on defining a local extremum. However, if a peak or nadir was flat, the individual heartbeat epoch was discarded from further analysis. Nevertheless, in some channels, we observed heartbeat waveform variability. Therefore, manual and visual inspection were performed on all the channels for each participant to ensure that any misidentifications or detection errors of the peaks and nadirs were fixed manually. Manual fixes were effected by adjusting the “FindPeak” algorithm parameters or discarding the heartbeat epoch as an artifact from further analysis. Following identification of peaks and nadirs, each individual heartbeat was separated. The baseline shift of each heartbeat epoch was removed by piecewise cubic spline interpolation.
The waveforms with cerebral pulse amplitude with standard deviation twice greater than the mean were considered motion artifacts and were removed from the analysis. The average waveform of the remaining heartbeats was determined and a correlation between each individual and the average heartbeat epoch was calculated. The heartbeat epochs with a correlation ≥0.8 were kept. Channel data were divided into four quantiles and the second and third quantiles were averaged (median). In each heartbeat epoch obtained from the NIRS signal, cerebral pulse amplitude and PRF were calculated separately. Next, the average of the pulsatility indices was used to represent the pulsatility index for that channel. In addition, the average across all the channels was used as the global pulsatility index in each participant. Figure 4 provides a diagram of NIRS data processing to extract pulsatility indices. For each participant, we averaged the cerebral pulse amplitude across all channels as an indicator of the global cerebral pulse amplitude for the participants. The same procedure was followed for global PRF.
FIGURE 4.

Schematic diagram of NIRS data processing to extract pulsatility indices and analysis. ANOVA, analysis of variance; HB, heartbeat epoch; M (SD), mean ±standard deviation; NIRS, near‐infrared spectroscopy; PRF, pulse relaxation function; SCI, scalp coupling index
2.10.3. Statistical analysis for global pulsatility parameters
A one‐way analysis of variance (ANOVA) using group as between subject factor (LCVRF, HCVRF, and CAD) was performed on the data. The aim of the analysis was to evaluate whether at standing rest, cardiovascular degradation from LCVRF to HCVRF and CAD could alter cerebral pulse amplitude and PRF. In this model, the dependent variables were cerebral pulse amplitude and PRF. Finally, to explore the impact of walking on alterations of global cerebral pulse amplitude in each group individually, we employed a paired student t‐test within each group. All statistical analysis was performed with SPSS (IBM statistics for Macintosh, Version 25.0).
2.10.4. Statistical analysis for channel‐wise pulsatility parameters and cortical projections
In addition to the above analysis assessing the global pulsatility index combining all NIRS channels for a single participant, we conducted channel‐wise analysis on pulsatility parameters to explore their spatial properties BW and AW. A two‐sample t‐test was then conducted on the pulsatility scores across the groups, testing the null hypothesis that there was no statistically significant difference in the measured cerebral pulse amplitude or PRF across the three groups for this channel. This yielded a total of 38 NIRS channels to be included in the channel‐wise analysis (Figure 5). The t‐values of each comparison were then corrected for multiple comparison with a false discovery rate (FDR) approach (Benjamini & Hochberg, 1995). Along with the raw pulsatility scores, the t‐values that survived the FDR correction were then projected on the cortical layer of the Colin27 template based on the anatomical locations of the corresponding channels. This projection was performed using the open‐source toolbox Atlas Viewer (Aasted et al., 2015). These individual values were then spatially interpolated to generate cortical contrast maps. Channel‐wise analysis was performed with Atlas Viewer, HOMER2 (Huppert et al., 2009) and some in‐house scripts.
FIGURE 5.

Spatial distribution of NIRS channels included in the channel‐wise analysis of pulsatility parameters and the corresponding cortical sensitivity matrix, frontal view. Red numbers indicate near‐infrared light sources and blue numbers indicate near‐infrared light detectors. Yellow lines connecting sources to detectors represent NIRS channels. This figure shows that the 38 channels included in the channels‐wise analysis had reasonable sampling sensitivity in most of the prefrontal areas and in bilateral supplementary motor cortices. NIRS, near‐infrared spectroscopy
3. RESULTS
On average, a walking block consisted of a standing rest period (15.20 ± 6.39 s) followed by free walking (29 ± 9.2 s) and another standing rest AW (15.77 ± 7.3 s). We analyzed the data for the standing rest BW and AW. To assess the reliability of pulsatility indices, the correlation between Block 1 and Block 2 was calculated: BW: r = .88, p <.001 AW: r = .83, p <.001 for cerebral pulse amplitude and BW: r = .44, p <.01, AW: r = .39, p = .007 for PRF. For the rest of the analysis, each pulsatility index was averaged across Blocks 1 and 2.
Figures 6a and 8a show the boxplots of global pulsatility index (averaged across all the channels in each individual) for cerebral pulse amplitude and PRF, for the three groups, for BW and AW. Regression analysis determined a statistically significant association between sex and cerebral pulse amplitude for both BW and AW: BW: F (1,58) = 12.583, p = .001 and AW: F (1,58) = 6.64, p = .013. Hence, for the rest of the analysis the effect of sex was regressed from the cerebral pulse amplitude for BW and AW. The association between PRF and sex was not statistically significant (p >.1). In addition, regression analysis did not determine a statistically significant association between age and cerebral pulse amplitude nor with PRF (p >.1) in all three groups.
FIGURE 6.

(a) Boxplots of global cerebral pulse amplitude for the three groups, the LCVRF, the HCVRF, and CAD for both before walking (before W) and after walking (after W). (b) Scatter plot for the global cerebral pulse amplitude versus Framingham 10‐year CHD risk prediction after regressing sex with linear regression. (c) Channel‐wise spatial distribution of the cerebral pulse amplitude on the Colin27 template. The mean cerebral pulse amplitude in every channel across all the participants is projected onto the cortex for before walking and after walking, separately. Red regions indicating higher pulsatility and yellow regions indicating lower pulsatility. (a) and (c) are illustrations of the input data for statistical analysis. BW, before walking; CAD, coronary artery disease; CHD, coronary heart disease; HCVRF, high cardiovascular risk factor; LCVRF, low cardiovascular risk factors; NIRS, near‐infrared spectroscopy; SD, standard deviation
FIGURE 8.

(a) Boxplots of global PRF for the three groups before walking (before W) and after walking (after W). (b) Scatter plot for global PRF versus Framingham 10‐year CHD risk prediction of LCVRF, HCVRF, and CAD. (c) Channel‐wise spatial distribution for PRF on the Colin27 template. PRF is projected onto the brain surface before walking and after walking. Blue areas indicate higher wave reflection or lower pulsatility, and green areas indicate higher pulsatility. PRF: pulse relaxation function; NIRS: near‐infrared spectroscopy; BW, before walking; CAD, coronary artery disease; CHD, coronary heart disease; HCVRF, high cardiovascular risk factors; LCVRF, low cardiovascular risk factors; SD, standard deviation
3.1. Impact of cardiovascular status on cerebral pulsatility BW while standing
3.1.1. Cerebral pulse amplitude
For global cerebral pulse amplitude BW, a one‐way ANOVA determined a statistically significant difference between groups (F (2,56) = 5.413, p = .006). A multiple comparison with Bonferroni correction revealed that the global cerebral pulse amplitude was significantly higher in the CAD group (BW: 0.75 ± 0.079) in comparison to HCVRF (BW: 0.68 ± 0.086, p = .036) or LCVRF (BW: 0.67 ± 0.079, p = .001) groups. While the global cerebral pulse amplitude was slightly higher in the HCVRF group in comparison with the LCVRF group, the difference did not reach statistical significance (p >.1).
Figure 6c illustrates input data for channel‐wise analysis of cerebral pulse amplitude. Figure 7 shows channel‐wise comparison of cerebral pulse amplitude across the three groups. In Figure 7‐(BW), the difference of cerebral pulse amplitude across the groups was shown to be statistically significant in the supplementary motor cortices, especially on the left side (contralateral to the preferred hand) for the three groups (albeit with lower t‐values for HCVRF versus LCVRF). These results indicate that despite the result that global cerebral pulse amplitude (BW) did not show a statistically significant difference between LCVRF and HCVRF, the channel‐wise analysis of cerebral pulse amplitude (BW) revealed statistically significant regions in supplementary motor cortices for LCVRF versus HCVRF groups.
FIGURE 7.

t‐statistics topographic contrast maps (p <.05) for channel‐wise comparison of cerebral pulse amplitude for before walking and after walking, respectively. The channel‐wise comparisons were determined the channel‐wise contrast for CAD versus LCVRF, CAD versus HCVRF, and LCVRF versus HCVRF (maps are FDR‐corrected). CAD, coronary artery disease; FDR, false discovery rate; HCVRF, high cardiovascular risk factor; LCVRF, low cardiovascular risk factors
3.1.2. Pulse relaxation function
For global PRF (BW), one‐way ANOVA did not indicate a statistically significant difference across the three groups (F (2,57) = 1.595, p = .212).
Figure 8c illustrates input data for channel‐wise analysis of PRF. Figure 9‐(BW) indicates channel‐wise comparison of the PRF across the groups for BW where there was statistically significant difference mostly in the bilateral supplementary motor area in CAD compared with LCVRF group. For HCVRF versus HCVRF groups, this difference was limited to the left sensorimotor area, contralateral to preferred hand. These results indicate that despite the result that global PRF (BW) did not show a statistically significant difference between the three groups, the channel‐wise analysis of PRF (BW) showed statistically significant regions in the sensorimotor area for CAD versus LCVRF and for HCVRF versus LCVRF.
FIGURE 9.

t‐statistics topographic contrast maps for before walking and after walking. PRF contrast results are presented across the groups. The maps are FDR‐corrected (p <.05) for CAD versus LCVRF, CAD versus HCVRF, and HCVRF versus LCVRF. CAD, coronary artery disease; FDR, false discovery rate; HCVRF, high cardiovascular risk factors; LCVRF, low cardiovascular risk factors
3.2. Impact of short‐duration walking on cerebral pulsatility parameters
3.2.1. Cerebral pulse amplitude
We have explored the effect of short‐duration walking on cerebral pulse amplitude within each group. A paired student t‐test indicated a statistically significant difference between global cerebral pulse amplitude AW versus BW within each group. Descriptive statistics showed a statistically significant reduction for cerebral pulse amplitude within each group: LCVRF group (BW: 0.663 ± 0.078 to AW: 0.577 ± 0.098, p BWAW = .0104), HCVRF (BW: 0.699 ± 0.087, AW: 0.645 ± 0.093, p BWAW = .035 and CAD (BW: 0.793 ± 0.082 to AW: 0.7409 ± 0.059, p BWAW = .043). Despite this significant reduction of global cerebral pulse amplitude within each group, repeated measure ANOVA (RM‐ANOVA) indicated that this reduction is not statistically significant across the groups F (2,57) = 0.51, p >.1. These results indicate that short‐duration walking did not exaggerate the changes of global cerebral pulse amplitude across the groups. Notably, channel‐wise comparison of cerebral pulse amplitude after short‐duration walking across the groups (Figure 7‐AW) showed statistically significant changes of cerebral pulse amplitude in sensorimotor cortices and prefrontal areas when CAD was compared with LCVRF. Also, similar pattern but with a smaller spatial extent was observed in the comparisons of CAD versus HCVRF. As we can see in the Figure 7‐(AW), for the HCVRF versus LCVRF groups, the channel‐wise difference was located in bilateral supplementary motor areas.
3.2.2. Pulse relaxation function
For global PRF, paired t‐tests within each of groups indicated a statistically significant difference between AW and BW for all groups. Descriptive statistics show that this reduction is statistically significant within each group as follows: LCVRF group (BW: 0.133 ± 0.032 to AW = 0.102 ± 0.033, p BWAW = .031), HCVRF (BW: 0.129 ± 0.057, AW: 0.093 ± 0.046, p BWAW = .0058) and CAD (BW: 0.111 ± 0.032 to AW: 0.0720 ± 0.020, p BWAW <.001). However, despite this significant reduction of global PRF within each group, repeated measure ANOVA (RM‐ANOVA) indicated that this reduction is not statistically significant across the groups F (2,57) = 0.73, p >.1. These results indicate that walking did not amplify the changes of global PRF (for BW vs. AW) across the groups. However, channel‐wise comparison of PRF AW (Figure 9‐AW) across the groups shows that with short‐duration walking the difference in channel‐wise comparison of PRF appears with broader spatial extents for LCVRF versus CAD and LCVRF versus HCVRF groups.
In short, our data indicated that short‐duration walking expanded the spatial area of channel‐wise difference of pulsatility indices (for cerebral pulse amplitude and PRF) across the groups. The effect was not seen in global changes in pulsatility indices.
3.3. Cerebral pulsatility parameters and heart rate
We explored the association between indices of cerebral pulsatility and heart rate. First, we estimated heart rate from the number of detected heartbeats in the given time. Next, for each individual, we computed the cumulated cerebral pulse amplitude per minute by multiplying the global cerebral pulse amplitude by the corresponding heart rate (an index of blood volume changes in the region probed by NIRS source and detector). The cumulated cerebral pulse amplitude was calculated and was compared between BW and AW. Descriptive statistics showed the increased cumulated cerebral pulse amplitude AW compared to BW within each group and the paired t‐test indicated that this effect is statically significant: LCVRF (BW: 45.421 ± 12.76 to AW = 51.617 ± 7.45, p BWAW = .001), HCVRF (BW: 47.56 ± 12.031, AW: 56.12 ± 13.265, p BWAW = .003) and CAD (BW: 7.184 ± 130 to AW: 7.76 ± 1.20, p BWAW = .03) groups. We performed the same calculation for PRF, but the p‐value did not reach statistical significance (p >.1).
3.4. Correlation between cerebral pulsatility parameters and pulse pressure or METs
BW, global cerebral pulse amplitude was significantly associated with pulse pressure in the CAD (r = .418, p = .004), HCVRF (r = .391, p = .03), and LCVRF (r = .381, p = .008) groups. Global cerebral pulse amplitude was not statistically significantly associated with METs (p = .09) for both BW and AW. PRF was not statistically significantly associated with these parameters neither BW nor AW (p >.1).
3.5. Correlation between pulsatility parameters and Framingham score
BW global cerebral pulse amplitude (after regressing sex) indicated that the Framingham 10‐year CHD risk predictions are positively correlated for the HCVRF group (r = .419, p = .041) but not for the LCVRF group (Figure 6b). For AW, this association was significant in HCVRF (r = .504, p = .005) but not for the LCVRF group (p >.1).
PRF did not correlate with Framingham score (Figure 8b) for both the LCVRF and HCVRF groups, and such neither BW nor AW (p >.05).
4. DISCUSSION
This study noninvasively assessed cerebral pulsatility indices extracted from the pulsatile component of NIRS data in three groups of older adults with LCVRF, HCVRF, and CAD. The main result showed that CAD patients have higher global cerebral pulse amplitude (BW ~0.75) than those with LCVRF or HCVRF (BW ~0.67). This result was in agreement with Tan et al. (2017) who reported that aging from young to middle and old age corresponds with a higher global cerebral pulse amplitude as indexed with NIRS data. This result also agrees with other studies reporting that excessive pulsatility in the central arteries (measured with PWV) can be used to diagnose the presence and also the extent of CAD (Alarhabi et al., 2009; Danchin et al., 2004; Nishijima et al., 2001).
We suggest that a higher global cerebral pulse amplitude seen in the CAD participants in our study is likely due to (a) higher central systolic pressure (Khoueiry et al., 2012; Song‐Tao, Yan‐Yan, & Li‐Xia, 2010) and (b) greater vascular stiffness and higher accumulated damage on the vascular walls (Prskalo et al., 2016; Song‐Tao et al., 2010). In such conditions, the damping of the pulsatile fluctuations in the central arteries is impaired and flow with a higher pulsatility travels toward the brain (Mitchell, 2015). Hypothetically, the principle of wave reflection is the reason why higher cerebral pulse amplitude is seen in the pulsatile component of NIRS data. With aging, the velocity of transmission of both forward traveling waves (originated from the left ventricle) and reflected waves to central arteries (returning from peripheral circulation) increases. The reflected waves arrive earlier in the late systole, rather than in early diastole (Mitchell, 2008, 2015). This early arrival could augment the pressure at the end of systole (Mitchell, 2008) that is seen as a higher pulse amplitude. It could also diminish the ability to sustain blood flow during diastole which is seen as lower PRF. This interpretation is in agreement with part of our result indicating that cerebral pulse amplitude and pulse pressure are statistically significantly correlated in all groups. This result is important as literature suggests that pulse pressure (as a surrogate marker of arterial stiffness) is moderately correlated to PWV (a measure of arterial stiffness; Laurent et al., 2006; Waldstein et al., 2008). Also, pulse pressure is a risk component for CHD (Franklin, Khan, Wong, Larson, & Levy, 1999).
Higher cerebral pulsatility in large and small cerebral arteries as a consequence of aging and age‐related diseases was reported in previously studies. Hashimoto, Westerhof, and Ito (2018) reported that while aging, the carotid flow augmentation is enhanced by aortic stiffening and higher‐pressure wave reflection. They suggested that this may damage cerebral microcirculation potentially through higher cerebral flow pulsations. For small cerebral arteries, Geurts, Zwanenburg, Klijn, Luijten, and Biessels (2019) reported that cerebral small vessel disease could be identified by an increased flow pulsation in the perforating arteries of the basal ganglia and the semioval center. Importantly, the downstream impact of higher pulsatility on the cerebrovascular system at least in part is discussed in studies linking age‐related cognitive decline to higher PWV (Scuteri & Wang, 2014), hypotension and cerebral microvascular damage (Scuteri et al., 2013). Scuteri et al. (2020) discussed the relationship between higher PWV and organ deterioration. They proposed that these could be related by evolution in the interaction between the heart and the vessels in the organs (Scuteri et al., 2001). They proposed that vascular remodeling as an adaptation to a chronically higher arterial pulsatility could eventually cause greater endothelial damage, which in turn leads to even higher arterial stiffness (Rizzoni & Agabiti‐Rosei, 2017; Scuteri et al., 2016) and greater detriment to the arterial walls (Scuteri et al., 2003).
Statistical analysis of the pulsatile component of the data did not yield a significant difference between cerebral pulse amplitude for the LCVRF (BW ~0.67) versus the HCVRF (AW ~0.68) groups. Literature suggests that treatment with antihypertension medication can reduce arterial stiffness (for review: Dudenbostel & Glasser, 2012). The results of conduit artery function evaluation (CAFE study, Williams et al., 2006) showed that administration of a calcium channel blocker and ACE‐inhibitors to older adults with hypertension can reduce central aortic pulse pressure and may influence future cardiovascular events. Another study reported that long‐term treatment with antihypertensive medications such as calcium channel blockers reduced dementia severity by approximately 50% (Forette et al., 2002). Linking these pieces of evidence, we suggest that it is likely that the use of vasoactive medications by the majority of individuals in the HCVRF group (see Table 1) may have attenuated their cerebral pulse amplitudes as measured with NIRS, thereby approaching the LCVRF group.
We used the Framingham 10‐year CHD risk score for the quantification of total cardiovascular risk for individuals with LCVRF and HCVRF. Data indicated that higher Framingham scores in the HCVRF group predict higher cerebral pulse amplitude (BW and AW), but not so for LCVRF. This result is in accordance with Pase et al. (2012), who reported that in the older adults with a higher Framingham score (a result of higher cumulative effect of CVRF), a higher blood flow pulsatility is seen in the MCA. In this regard, diabetes mellitus (Kozakova & Palombo, 2016) and hypertension (Martinez‐Quinones et al., 2018) are linked to the functional and structural modifications of the vasculature (Ecobici & Stoicescu, 2017; Hwang et al., 2010; Prenner & Chirinos, 2015) which can lead to accelerated and pathological aging of the arterial walls (Lee & Park, 2013; Wang, Monticone, & McGraw, 2018). Notably, despite use of vasoactive drugs by all CAD participants, they still had the highest global cerebral pulse amplitude when compared to both HCVRF and LCVRF. This result emphasizes the importance of heart function on cerebral hemodynamics (Anazodo et al., 2016; Xing et al., 2017). Also, this result agrees with the results of a meta‐analysis that reports that even treated CHD is associated with higher risk for cognitive impairment (Deckers et al., 2017).
Data in the present study indicate a reduction in the global cerebral pulse amplitude and PRF following short‐duration walking within all three groups. The experimental setting used in the present study does not conclusively demonstrate the mechanism by which pulsatility indices are reduced with low‐intensity walking. Cerebral pulsatility indices could be affected by many hemodynamic parameters such as those that influence vascular wall behavior (Iulita, Noriega de la Colina, & Girouard, 2018). For instance, it is possible that low‐intensity walking induces vasodilation (Wethal, Roysland, Torbjorn, & Kjekshus, 2015) which in turn leads to reduction of cerebral pulse amplitude. This explanation is in agreement with part of our results that indicate a higher cumulative cerebral pulse amplitude (index of blood volume changes) AW compared with BW within each group.
Our data indicate that low‐intensity, short‐duration walking did not increase the changes of global pulsatility indices across the three groups. This result was not in agreement with our second hypothesis. We expected that at least in the CAD group, the higher impairment in the vascular walls impairs responses to pulsatility and leads to smaller apparent changes in pulsatility indices, and that the LCVRF group would show the greatest change. Considering that the duration of low‐intensity walking for our participants was about 30 s, further research is needed to determine walking durations and intensities appropriate for exaggerating global pulsatility differences across groups. Nevertheless, channel‐wise spatial comparison of cerebral pulse amplitude for BW reveals that cerebral pulse amplitude was slightly higher in the collateral supplementary motor cortices in all three groups. AW, this effect was extended to more anterior prefrontal areas for the CAD versus LCVRF and CAD versus HCVRF groups. These results indicate that short‐duration walking extended the channel‐wise contrast of cerebral pulse amplitude to the anterior prefrontal areas and lead to a spatial distribution that may be used as a marker to differentiate CAD from LCVRF and HCVRF (Figure 7‐AW).
The results of the present study did not show a statistically significant difference for PRF across our clinical groups. We suggest that this result is due to the relatively low reliability of this index as assessed by correlation between Block 1 and Block 2, shorter recording periods, and the smaller number of recording channels compared with other pulsatility literature such as Chiarelli et al. (2017) and Tan et al. (2017). Also, literature suggests that the reliability of the PRF is higher when the data is reconstructed in 3D (three dimensional: Chiarelli et al., 2017; Tan et al., 2019), which is not the case in the present study. In addition, as part of preprocessing, we tagged and removed movement artifacts from the analysis; it is possible that with the development of motion correction algorithms targeted for pulsatility, we could correct for motion artifacts in the pulsatile component of NIRS data and reduce the data loss, thereby potentially increasing reliability.
Our data did not show a statistically significant association between global cerebral pulse amplitude and METs. This part of the results was in line with Tan et al. (2017). However, our data did not indicate a meaningful association between PRF and METs as well. This part of the results was not in agreement with Tan et al. (2017). One reason for this could be the difference in type of participant and a difference in method of obtaining cardiorespiratory fitness. More precisely, Tan et al. (2017) used a linear equation with weighted variables such as sex, age, and body mass to estimate cardiorespiratory fitness in the three groups of healthy young, middle aged, and older individuals. In our study, we obtained METs by an individualized ramp protocol on the treadmill and calculated the ratio of the METs to the theoretical METs. Further research is needed to explore to what extent using a linear equation for estimating cardiorespiratory fitness can predict it accurately, especially in the CAD participants.
Finally, there are several limitations to the present study. (a) We discussed that higher pulsatility in the CAD patients is likely due to their higher arterial stiffness and to travel of the higher pulsatile flow to downstream microcirculation in the brain. With this context, a measure of cerebral arterial stiffness such as transcranial Doppler or PC‐MRI could help to emphasize our findings. (b) By reviewing the sensitivity map presented in Figure 5, one could argue that pulsatility indices can differ due to different sensitivities to the NIRS signals. Also, other factors such as skull thickness, volume of the cerebrospinal fluid (CSF), or hair density can influence this index and are not directly related to differences in brain pulsatility index between the regions. The anatomical MRI of the participant, which was not available in this study, could help to refine our results and their interpretation. (c) Regarding our data sample, the number of participants (n = 60) for three groups including LCVRF, HCVRF, and CAD is relatively small. Also, the groups were heterogenous in terms of number of participants, distribution between women and men, and the type of medication that the participants were using. In the CAD group there was a large sex heterogeneity (1 woman vs. 17 men) which could dissimulate the potential impact of sex on pulsatility index in the CAD group. Further studies are needed to explore whether sex can have a significant impact on changes of cerebral pulsatility parameters in CAD patients.
5. CONCLUSION
Functional NIRS provides indices of cerebral pulsatility even in mobility‐based experiments. Our data indicated that global cerebral pulse amplitude is sensitive to cardiovascular status by discriminating the CAD group (BW ~0.75) from the LCVRF and HCVRF groups (BW ~0.67).
After short‐duration walking, cerebral pulse amplitude and PRF decreased within all three groups. Short‐duration and low‐intensity walking for about 30 s did not increase the difference of global pulsatility index across the groups. However, walking extended channel‐wise contrast of cerebral pulse amplitude for LCVRF and HCVRF versus CAD to the anterior prefrontal areas.
Considering the low cost, noninvasiveness and simplicity of NIRS to index pulsatility, further predictive analysis is required to explore whether the magnitude of this index can be linked to actual cerebrovascular damage. Such research may determine the usefulness of this index as a detection tool for individuals who may benefit from selective health management and intervention strategies.
CONFLICT OF INTEREST
The authors declare no conflict of interest.
Mohammadi, H. , Vincent, T. , Peng, K. , Nigam, A. , Gayda, M. , Fraser, S. , Joanette, Y. , Lesage, F. , & Bherer, L. (2021). Coronary artery disease and its impact on the pulsatile brain: A functional NIRS study. Human Brain Mapping, 42(12), 3760–3776. 10.1002/hbm.25463
Funding information Canadian Institutes of Health Research, Grant/Award Numbers: 120304, IOP‐271115, MOP‐191272
DATA AVAILABILITY STATEMENT
Data sharing is not applicable. A limited version of the code is available upon request to corresponding author.
REFERENCES
- Aasted, C. M. , Yücel, M. A. , Cooper, R. J. , Dubb, J. , Tsuzuki, D. , Becerra, L. , … Boas, D. A. (2015). Anatomical guidance for functional near‐infrared spectroscopy: AtlasViewer tutorial. Neurophotonics, 2(2), 020801. 10.1117/1.nph.2.2.020801 [DOI] [PMC free article] [PubMed] [Google Scholar]
- Agbangla, N. F. , Audiffren, M. , & Albinet, C. T. (2017). Use of near‐infrared spectroscopy in the investigation of brain activation during cognitive aging: A systematic review of an emerging area of research. Ageing Research Reviews, 38, 52–66. 10.1016/j.arr.2017.07.003 [DOI] [PubMed] [Google Scholar]
- Alarhabi, A. Y. , Mohamed, M. S. , Ibrahim, S. , Hun, T. M. , Musa, K. I. , & Yusof, Z. (2009). Pulse wave velocity as a marker of severity of coronary artery disease. Journal of Clinical Hypertension (Greenwich, Conn.), 11(1), 17–21. 10.1111/j.1751-7176.2008.00061.x [DOI] [PMC free article] [PubMed] [Google Scholar]
- Al‐Jehani, H. (2014). The use of transcranial doppler pulsatility index to guide intracranial pressure monitoring in intoxicated traumatic brain injury patients. Saudi Journal of Medicine and Medical Sciences, 2(3), 162. 10.4103/1658-631x.142506 [DOI] [Google Scholar]
- Anazodo U. C., Shoemaker J. K., Suskin N, Ssali T, Wang D. J. J., & St. Lawrence K. S. (2016). Impaired Cerebrovascular Function in Coronary Artery Disease Patients and Recovery Following Cardiac Rehabilitation. Frontiers in Aging Neuroscience, 7, 10.3389/fnagi.2015.00224. [DOI] [PMC free article] [PubMed] [Google Scholar]
- Barić, D. (2014). Why pulsatility still matters: A review of current knowledge. Croatian Medical Journal, 55(6), 609–620. 10.3325/cmj.2014.55.609 [DOI] [PMC free article] [PubMed] [Google Scholar]
- Benjamini, Y. , & Hochberg, Y. (1995). Controlling the false discovery rate: A practical and powerful approach to multiple testing. Journal of the Royal Statistical Society: Series B (Methodological), 57(1), 289–300. 10.1111/j.2517-6161.1995.tb02031.x [DOI] [Google Scholar]
- Beurskens, R. , Helmich, I. , Rein, R. , & Bock, O. (2014). Age‐related changes in prefrontal activity during walking in dual‐task situations: A fNIRS study. International Journal of Psychophysiology, 92(3), 122–128. 10.1016/j.ijpsycho.2014.03.005 [DOI] [PubMed] [Google Scholar]
- Boidin, M. , Lapierre, G. , Paquette Tanir, L. , Nigam, A. , Juneau, M. , Guilbeault, V. , … Gayda, M. (2015). Effect of aquatic interval training with Mediterranean diet counseling in obese patients: Results of a preliminary study. Annals of Physical and Rehabilitation Medicine, 58(5), 269–275. 10.1016/j.rehab.2015.07.002 [DOI] [PubMed] [Google Scholar]
- Chiarelli, A. M. , Fletcher, M. A. , Tan, C. H. , Low, K. A. , Maclin, E. L. , Zimmerman, B. , … Fabiani, M. (2017). Individual differences in regional cortical volumes across the life span are associated with regional optical measures of arterial elasticity. NeuroImage, 162, 199–213. 10.1016/j.neuroimage.2017.08.064 [DOI] [PMC free article] [PubMed] [Google Scholar]
- Chuang, S. Y. , Cheng, H. M. , Bai, C. H. , Yeh, W. T. , Chen, J. R. , & Pan, W. H. (2016). Blood pressure, carotid flow Pulsatility, and the risk of stroke: A community‐based study. Stroke, 47(9), 2262–2268. 10.1161/STROKEAHA.116.013207 [DOI] [PubMed] [Google Scholar]
- Cook, L. B. (2001). Extracting arterial flow waveforms from pulse oximeter waveforms apparatus. Anaesthesia, 56(6), 551–555. 10.1046/j.1365-2044.2001.01986.x [DOI] [PubMed] [Google Scholar]
- Danchin, N. , Benetos, A. , Lopez‐Sublet, M. , Demicheli, T. , Safar, M. , & Mourad, J. J. (2004). Aortic pulse pressure is related to the presence and extent of coronary artery disease in men undergoing diagnostic coronary angiography: A multicenter study. American Journal of Hypertension, 17(2), 129–133. 10.1016/j.amjhyper.2003.09.010 [DOI] [PubMed] [Google Scholar]
- Deckers, K. , Schievink, S. H. J. , Rodriquez, M. M. F. , Van Oostenbrugge, R. J. , Van Boxtel, M. P. J. , Verhey, F. R. J. , & Köhler, S. (2017). Coronary heart disease and risk for cognitive impairment or dementia: Systematic review and meta‐analysis. PLoS One, 12(9), e0184244. 10.1371/journal.pone.0184244 [DOI] [PMC free article] [PubMed] [Google Scholar]
- Desjardins, M. (2015). Vascular correlates of aging in the brain: Evidence from imaging data. IRBM, 36, 158–165. 10.1016/j.irbm.2015.01.016 [DOI] [Google Scholar]
- Dudenbostel, T. , & Glasser, S. P. (2012). Effects of antihypertensive drugs on arterial stiffness. Cardiology in Review, 20, 259–263. 10.1097/CRD.0b013e31825d0a44 [DOI] [PMC free article] [PubMed] [Google Scholar]
- Ecobici, M. , & Stoicescu, C. (2017). Arterial stiffness and hypertension ‐ which comes first? Maedica, 12(3), 184–190. [PMC free article] [PubMed] [Google Scholar]
- Elgendi, M. (2012). On the analysis of fingertip Photoplethysmogram signals. Current Cardiology Reviews, 8(1), 14–25. 10.2174/157340312801215782 [DOI] [PMC free article] [PubMed] [Google Scholar]
- Fabiani, M. , Low, K. A. , Tan, C. H. , Zimmerman, B. , Fletcher, M. A. , Schneider‐Garces, N. , … Gratton, G. (2014). Taking the pulse of aging: Mapping pulse pressure and elasticity in cerebral arteries with optical methods. Psychophysiology, 51(11), 1072–1088. 10.1111/psyp.12288 [DOI] [PMC free article] [PubMed] [Google Scholar]
- Forette, F. , Seux, M. L. , Staessen, J. A. , Thijs, L. , Babarskiene, M. R. , Babeanu, S. , … Birkenhäger, W. H. (2002). The prevention of dementia with antihypertensive treatment: New evidence from the systolic hypertension in Europe (syst‐eur) study. Archives of Internal Medicine, 162(18), 2046–2052. 10.1001/archinte.162.18.2046 [DOI] [PubMed] [Google Scholar]
- Franklin, S. S. , Khan, S. A. , Wong, N. D. , Larson, M. G. , & Levy, D. (1999). Is pulse pressure useful in predicting risk for coronary heart disease? The Framingham heart study. Circulation, 100(4), 354–360. 10.1161/01.CIR.100.4.354 [DOI] [PubMed] [Google Scholar]
- Fraser, S. A. , Dupuy, O. , Pouliot, P. , Lesage, F. , & Bherer, L. (2016). Comparable cerebral oxygenation patterns in younger and older adults during dual‐task walking with increasing load. Frontiers in Aging Neuroscience, 8(OCT), 240. 10.3389/fnagi.2016.00240 [DOI] [PMC free article] [PubMed] [Google Scholar]
- Gayda, M. , Brun, C. , Juneau, M. , Levesque, S. , & Nigam, A. (2008). Long‐term cardiac rehabilitation and exercise training programs improve metabolic parameters in metabolic syndrome patients with and without coronary heart disease. Nutrition, Metabolism and Cardiovascular Diseases, 18(2), 142–151. 10.1016/j.numecd.2006.07.003 [DOI] [PubMed] [Google Scholar]
- Geurts, L. J. , Zwanenburg, J. J. M. , Klijn, C. J. M. , Luijten, P. R. , & Biessels, G. J. (2019). Higher Pulsatility in cerebral perforating arteries in patients with small vessel disease related stroke, a 7T MRI study. Stroke, 50(1), 62–68. 10.1161/strokeaha.118.022516 [DOI] [PMC free article] [PubMed] [Google Scholar]
- Ghorbani, A. , Ahmadi, M. , & Shemshaki, H. (2015). The value of transcranial Doppler derived pulsatility index for diagnosing cerebral small‐vessel disease. Advanced Biomedical Research, 4(1), 54. 10.4103/2277-9175.151574 [DOI] [PMC free article] [PubMed] [Google Scholar]
- Greenwood, P. M. (2007). Functional plasticity in cognitive aging: Review and hypothesis. Neuropsychology, 21(6), 657–673. 10.1037/0894-4105.21.6.657 [DOI] [PubMed] [Google Scholar]
- Gupta, P. , Lyons, S. , & Hedgire, S. (2019). Ultrasound imaging of the arterial system. Cardiovascular Diagnosis and Therapy, 9(S1), S2–S13. 10.21037/cdt.2019.02.05 [DOI] [PMC free article] [PubMed] [Google Scholar]
- Hashimoto, J. , Westerhof, B. E. , & Ito, S. (2018). Carotid flow augmentation, arterial aging, and cerebral white matter hyperintensities: Comparison with pressure augmentation. Arteriosclerosis, Thrombosis, and Vascular Biology, 38(12), 2843–2853. 10.1161/ATVBAHA.118.311873 [DOI] [PubMed] [Google Scholar]
- Huppert, T. J. , Diamond, S. G. , Franceschini, M. A. , & Boas, D. A. (2009). HomER: A review of time‐series analysis methods for near‐infrared spectroscopy of the brain. Applied Optics, 48(10), D280–D298. 10.1364/AO.48.00D280 [DOI] [PMC free article] [PubMed] [Google Scholar]
- Hwang, S.‐J. , Vasan, R. S. , Larson, M. G. , Pencina, M. J. , Hamburg, N. M. , Levy, D. , & Benjamin, E. J. (2010). Arterial stiffness and cardiovascular events: The Framingham heart study. Circulation, 121(4), 505–511. 10.1161/CIRCULATIONAHA.109.886655.Arterial [DOI] [PMC free article] [PubMed] [Google Scholar]
- Iulita, M. F. , Noriega de la Colina, A. , & Girouard, H. (2018). Arterial stiffness, cognitive impairment and dementia: Confounding factor or real risk? Journal of Neurochemistry, 144, 527–548. 10.1111/jnc.14235 [DOI] [PubMed] [Google Scholar]
- Khoueiry, G. , Azab, B. , Torbey, E. , Abi Rafeh, N. , Atallah, J. P. , Ahern, K. , … Chemaly, E. R. (2012). Aortic pulse pressure is associated with the localization of coronary artery disease based on coronary flow lateralization. American Journal of Hypertension, 25(10), 1055–1063. 10.1038/ajh.2012.87 [DOI] [PMC free article] [PubMed] [Google Scholar]
- Klem, G. H. , Lüders, H. O. , Jasper, H. H. , & Elger, C. (1999). The ten‐twenty electrode system of the international federation. The International Federation of Clinical Neurophysiology. Electroencephalography and Clinical Neurophysiology. Supplement, 52, 3–6. [PubMed] [Google Scholar]
- Koike, A. , Nagayama, O. , Hoshimoto‐Iwamoto, M. , Suzuki, T. , Tajima, A. , Uejima, T. , & Aizawa, T. (2008). Clinical significance of cerebral oxygenation during exercise in patients with coronary artery disease. Circulation Journal, 72(11), 1852–1858. 10.1253/circj.CJ-08-0376 [DOI] [PubMed] [Google Scholar]
- Kozakova, M. , & Palombo, C. (2016). Diabetes mellitus, Arterialwall, and cardiovascular risk assessment. International Journal of Environmental Research and Public Health, 13. 10.3390/ijerph13020201 [DOI] [PMC free article] [PubMed] [Google Scholar]
- Lareau, E. , Lesage, F. , Pouliot, P. , Nguyen, D. , Le Lan, J. , & Sawan, M. (2011). Multichannel wearable system dedicated for simultaneous electroencephalography∕near‐infrared spectroscopy real‐time data acquisitions. Journal of Biomedical Optics, 16(9), 096014. 10.1117/1.3625575 [DOI] [PubMed] [Google Scholar]
- Laurent, S. , Cockcroft, J. , Van Bortel, L. , Boutouyrie, P. , Giannattasio, C. , Hayoz, D. , … Struijker‐Boudier, H. (2006). Expert consensus document on arterial stiffness: Methodological issues and clinical applications. European Heart Journal, 27, 2588–2605. 10.1093/eurheartj/ehl254 [DOI] [PubMed] [Google Scholar]
- Lee, S. J. , & Park, S. H. (2013). Arterial ageing. Korean Circulation Journal, 43, 73–79. 10.4070/kcj.2013.43.2.73 [DOI] [PMC free article] [PubMed] [Google Scholar]
- Lutski, M. , Haratz, S. , Weinstein, G. , Goldbourt, U. , & Tanne, D. (2018). Impaired cerebral hemodynamics and frailty in patients with cardiovascular disease. Journals of Gerontology—Series A Biological Sciences and Medical Sciences, 73(12), 1714–1721. 10.1093/gerona/glx253 [DOI] [PubMed] [Google Scholar]
- Maidan, I. , Nieuwhof, F. , Bernad‐Elazari, H. , Reelick, M. F. , Bloem, B. R. , Giladi, N. , … Mirelman, A. (2016). The role of the frontal lobe in complex walking among patients with Parkinson's disease and healthy older adults: An fNIRS study. Neurorehabilitation and Neural Repair, 30(10), 963–971. 10.1177/1545968316650426 [DOI] [PubMed] [Google Scholar]
- Martinez‐Quinones, P. , McCarthy, C. G. , Watts, S. W. , Klee, N. S. , Komic, A. , Calmasini, F. B. , … Wenceslau, C. F. (2018). Hypertension induced morphological and physiological changes in cells of the arterial wall. American Journal of Hypertension, 31, 1067–1078. 10.1093/ajh/hpy083 [DOI] [PMC free article] [PubMed] [Google Scholar]
- McDonald, D. A. (2011). Blood flow in arteries. Annual Review of Fluid Mechanics, 29, 399–434. 10.1146/annurev.fluid.29.1.399 [DOI] [Google Scholar]
- Mirelman, A. , Maidan, I. , Bernad‐Elazari, H. , Nieuwhof, F. , Reelick, M. , Giladi, N. , & Hausdorff, J. M. (2014). Increased frontal brain activation during walking while dual tasking: An fNIRS study in healthy young adults. Journal of Neuroengineering and Rehabilitation, 11(1), 85. 10.1186/1743-0003-11-85 [DOI] [PMC free article] [PubMed] [Google Scholar]
- Mitchell, G. F. (2008). Effects of central arterial aging on the structure and function of the peripheral vasculature: Implications for end‐organ damage. Journal of Applied Physiology, 105, 1652–1660. 10.1152/japplphysiol.90549.2008 [DOI] [PMC free article] [PubMed] [Google Scholar]
- Mitchell, G. F. (2015). Cerebral small vessel disease: Role of aortic stiffness and pulsatile hemodynamics. Journal of Hypertension, 33, 2025–2028. 10.1097/HJH.0000000000000717 [DOI] [PubMed] [Google Scholar]
- Myers, J. , Buchanan, N. , Smith, D. , Neutel, J. , Bowes, E. , Walsh, D. , & Froelicher, V. F. (1992). Individualized ramp treadmill; observations on a new protocol. Chest, 101(5 SUPPL), 236S–241S. 10.1378/chest.101.5.236S [DOI] [PubMed] [Google Scholar]
- Nayak, K. S. , Nielsen, J. F. , Bernstein, M. A. , Markl, M. , Gatehouse, P. D. , Botnar, R. M. , … Raman, S. V. (2015). Cardiovascular magnetic resonance phase contrast imaging. Journal of Cardiovascular Magnetic Resonance, 17, 71. 10.1186/s12968-015-0172-7 [DOI] [PMC free article] [PubMed] [Google Scholar]
- Nishijima, T. , Nakayama, Y. , Tsumura, K. , Yamashita, N. , Yoshimaru, K. , Ueda, H. , … Yoshikawa, J. (2001). Pulsatility of ascending aortic blood pressure waveform is associated with an increased risk of coronary heart disease. American Journal of Hypertension, 14(5), 469–473. 10.1016/S0895-7061(00)01288-7 [DOI] [PubMed] [Google Scholar]
- O'Rourke, M. F. , & Jiang, A. P. X. J. (2001). Pulse wave analysis. British Journal of Clinical Pharmacology, 51, 507–522. 10.1046/j.0306-5251.2001.01400.x [DOI] [PMC free article] [PubMed] [Google Scholar]
- Oh, J. E. , Shin, J. W. , Sohn, E. H. , Jung, J. O. , Jeong, S. H. , Song, H. J. , … Lee, A. Y. (2012). Effect of cardiac function on cognition and brain structural changes in dementia. Journal of Clinical Neurology (Korea), 8(2), 123–129. 10.3988/jcn.2012.8.2.123 [DOI] [PMC free article] [PubMed] [Google Scholar]
- Ozari, H. O. , Oktenli, C. , Celik, S. , Tangi, F. , Ipcioglu, O. , Terekeci, H. M. , … Nalbant, S. (2012). Are increased carotid artery pulsatility and resistance indexes early signs of vascular abnormalities in young obese males? Journal of Clinical Ultrasound, 40(6), 335–340. 10.1002/jcu.21927 [DOI] [PubMed] [Google Scholar]
- Pase, M. P. , Grima, N. A. , Stough, C. K. , Scholey, A. , & Pipingas, A. (2012). Cardiovascular disease risk and cerebral blood flow velocity. Stroke, 43(10), 2803–2805. 10.1161/STROKEAHA.112.666727 [DOI] [PubMed] [Google Scholar]
- Pollonini, L. , Olds, C. , Abaya, H. , Bortfeld, H. , Beauchamp, M. S. , & Oghalai, J. S. (2014). Auditory cortex activation to natural speech and simulated cochlear implant speech measured with functional near‐infrared spectroscopy. Hearing Research, 309, 84–93. 10.1016/j.heares.2013.11.007 [DOI] [PMC free article] [PubMed] [Google Scholar]
- Prenner, S. B. , & Chirinos, J. A. (2015). Arterial stiffness in diabetes mellitus. Atherosclerosis, 238(2), 370–379. 10.1016/j.atherosclerosis.2014.12.023 [DOI] [PubMed] [Google Scholar]
- Prskalo, Z. , Brizić, I. , Markota, D. , Markota, I. , Boban, M. , Tomic, M. , & Starcevic, B. (2016). Arterial stiffness in patients with coronary artery disease: Relation with in‐stent restenosis following percutaneous coronary intervention. BMC Cardiovascular Disorders, 16(1), 128. 10.1186/s12872-016-0305-4 [DOI] [PMC free article] [PubMed] [Google Scholar]
- Ritz, K. , van Buchem, M. A. , & Daemen, M. J. (2013). The heart‐brain connection: Mechanistic insights and models. Netherlands Heart Journal, 21(2), 55–57. 10.1007/s12471-012-0348-9 [DOI] [PMC free article] [PubMed] [Google Scholar]
- Rizzoni, D. , & Agabiti‐Rosei, C. (2017). Relationships between blood pressure variability and indices of large artery stiffness: Does the microvasculature play a role. Hypertension Research, 40, 348–350. 10.1038/hr.2016.174 [DOI] [PubMed] [Google Scholar]
- Saha, M. , Muppala, M. R. , Castaldo, J. E. , Gee, W. , Reed, J. F. , & Lynn Morris, D. (1993). The impact of cardiac index on cerebral hemodynamics. Stroke, 24(11), 1686–1690. 10.1161/01.STR.24.11.1686 [DOI] [PubMed] [Google Scholar]
- Satish, M. , & Tadi, P. (2020). Physiology, vascular. In StatPearls. Treasure Island (FL): StatPearls Publishing. [PubMed] [Google Scholar]
- Scuteri, A. , Chen, C. H. , Yin, F. C. P. , Chih‐Tai, T. , Spurgeon, H. A. , & Lakatta, E. G. (2001). Functional correlates of central arterial geometric phenotypes. Hypertension, 38(6), 1471–1475. 10.1161/hy1201.099291 [DOI] [PubMed] [Google Scholar]
- Scuteri, A. , Morrell, C. H. , Fegatelli, D. A. , Fiorillo, E. , Delitala, A. , Orru', M. , … Cucca, F. (2020). Arterial stiffness and multiple organ damage: A longitudinal study in population. Aging Clinical and Experimental Research, 32(5), 781–788. 10.1007/s40520-019-01260-0 [DOI] [PMC free article] [PubMed] [Google Scholar]
- Scuteri, A. , Morrell, C. H. , Orru', M. , Alghatrif, M. , Saba, P. S. , Terracciano, A. , … Lakatta, E. G. (2016). Gender specific profiles of white coat and masked hypertension impacts on arterial structure and function in the SardiNIA study. International Journal of Cardiology, 217, 92–98. 10.1016/j.ijcard.2016.04.172 [DOI] [PMC free article] [PubMed] [Google Scholar]
- Scuteri, A. , Stuehlinger, M. C. , Cooke, J. P. , Wright, J. G. , Lakatta, E. G. , Anderson, D. E. , & Fleg, J. L. (2003). Nitric oxide inhibition as a mechanism for blood pressure increase during salt loading in normotensive postmenopausal women. Journal of Hypertension, 21(7), 1339–1346. 10.1097/00004872-200307000-00023 [DOI] [PubMed] [Google Scholar]
- Scuteri, A. , Tesauro, M. , Guglini, L. , Lauro, D. , Fini, M. , & Di Daniele, N. (2013). Aortic stiffness and hypotension episodes are associated with impaired cognitive function in older subjects with subjective complaints of memory loss. International Journal of Cardiology, 169(5), 371–377. 10.1016/j.ijcard.2013.09.009 [DOI] [PubMed] [Google Scholar]
- Scuteri, A. , Wang, H. Y. (2014). Pulse wave velocity as a marker of cognitive impairment in the elderly. Journal of Alzheimer's Disease, 42(s4), S401–S410. 10.3233/jad-141416. [DOI] [PubMed] [Google Scholar]
- Segers, P. , Rietzschel, E. R. , De Buyzere, M. L. , Stergiopulos, N. , Westerhof, N. , Van Bortel, L. M. , … Verdonck, P. R. (2008). Three‐and‐four‐element Windkessel models: Assessment of their fitting performance in a large cohort of healthy middle‐aged individuals. Proceedings of the Institution of Mechanical Engineers, Part H: Journal of Engineering in Medicine, 222(4), 417–428. 10.1243/09544119JEIM287 [DOI] [PubMed] [Google Scholar]
- Song‐Tao, A. , Yan‐Yan, Q. , & Li‐Xia, W. (2010). The severity of coronary artery disease evaluated by central systolic pressure and fractional diastolic pressure. North American Journal of Medical Sciences, 2(5), 218–21820. 10.4297/najms.2010.2218 [DOI] [PMC free article] [PubMed] [Google Scholar]
- Tan, C. H. , Low, K. A. , Chiarelli, A. M. , Fletcher, M. A. , Navarra, R. , Burzynska, A. Z. , … Fabiani, M. (2019). Optical measures of cerebral arterial stiffness are associated with white matter signal abnormalities and cognitive performance in normal aging. Neurobiology of Aging, 84, 200–207. 10.1016/j.neurobiolaging.2019.08.004 [DOI] [PMC free article] [PubMed] [Google Scholar]
- Tan, C. H. , Low, K. A. , Kong, T. , Fletcher, M. A. , Zimmerman, B. , MacLin, E. L. , … Fabiani, M. (2017). Mapping cerebral pulse pressure and arterial compliance over the adult lifespan with optical imaging. PLoS One, 12(2), e0171305. 10.1371/journal.pone.0171305 [DOI] [PMC free article] [PubMed] [Google Scholar]
- Tan, C. H. , Low, K. A. , Schneider‐Garces, N. , Zimmerman, B. , Fletcher, M. A. , Maclin, E. L. , … Fabiani, M. (2016). Optical measures of changes in cerebral vascular tone during voluntary breath holding and a Sternberg memory task. Biological Psychology, 118, 184–194. 10.1016/j.biopsycho.2016.05.008 [DOI] [PMC free article] [PubMed] [Google Scholar]
- Themelis, G. , D'Arceuil, H. , Diamond, S. G. , Thaker, S. , Huppert, T. J. , Boas, D. A. , & Franceschini, M. A. (2007). Near‐infrared spectroscopy measurement of the pulsatile component of cerebral blood flow and volume from arterial oscillations. Journal of Biomedical Optics, 12(1), 014033. 10.1117/1.2710250 [DOI] [PMC free article] [PubMed] [Google Scholar]
- Vitorio, R. , Stuart, S. , Rochester, L. , Alcock, L. , & Pantall, A. (2017). fNIRS response during walking — Artefact or cortical activity? A systematic review. Neuroscience and Biobehavioral Reviews, 83, 160–172. 10.1016/j.neubiorev.2017.10.002 [DOI] [PubMed] [Google Scholar]
- Wåhlin, A. , Ambarki, K. , Birgander, R. , Malm, J. , & Eklund, A. (2014). Intracranial pulsatility is associated with regional brain volume in elderly individuals. Neurobiology of Aging, 35(2), 365–372. 10.1016/j.neurobiolaging.2013.08.026 [DOI] [PubMed] [Google Scholar]
- Wåhlin, A. , Ambarki, K. , Hauksson, J. , Birgander, R. , Malm, J. , & Eklund, A. (2012). Phase contrast MRI quantification of pulsatile volumes of brain arteries, veins, and cerebrospinal fluids compartments: Repeatability and physiological interactions. Journal of Magnetic Resonance Imaging, 35(5), 1055–1062. 10.1002/jmri.23527 [DOI] [PubMed] [Google Scholar]
- Waldstein, S. , Rice, S. , Thayer, J. , Najjar, S. , Scuteri, A. , & Zonderman, A. (2008). Pulse pressure and pulse wave velocity are related to cognitive decline in the Baltimore longitudinal study of aging. Hypertension, 51(1), 99–104. [DOI] [PubMed] [Google Scholar]
- Wang, M. , Monticone, R. E. , & McGraw, K. R. (2018). Proinflammatory arterial stiffness syndrome: A signature of large arterial aging. Journal of Vascular Research, 55, 210–223. 10.1159/000490244 [DOI] [PMC free article] [PubMed] [Google Scholar]
- Wasserman, K. , Hansen, J. E. , Sue, D. Y. , Stringer, W. W. , & Whipp, B. J. (2004). Principles of exercise testing and interpretation. Philadelphia, PA: Lippincott Williams & Wilkins. [Google Scholar]
- Wethal, T. , Roysland, R. , Torbjorn, O. , & Kjekshus, J. (2015). Exercise‐induced vasodilation in healthy males: A marker of reduced endothelial function. Scandinavian Cardiovascular Journal, 49(3), 123–129. 10.3109/14017431.2015.1021708 [DOI] [PubMed] [Google Scholar]
- Wielemborek‐Musial, K. , Szmigielska, K. , Leszczynska, J. , & Jegier, A. (2016). Blood pressure response to submaximal exercise test in adults. BioMed Research International, 2016, 2016, 1–8. 10.1155/2016/5607507 [DOI] [PMC free article] [PubMed] [Google Scholar]
- Williams, B. , Lacy, P. S. , Thurston, H. , Thom, S. , Hughes, A. , Cruickshank, K. , … O'Rourke, M. (2006). Response to letters regarding article, “differential impact of blood pressure‐lowering drugs on central aortic pressure and clinical outcomes: Principal results of the conduit artery function evaluation (CAFE) study”. Circulation, 114, e540–e541. 10.1161/CIRCULATIONAHA.106.640870 [DOI] [PubMed] [Google Scholar]
- Wilson, P. W. F. , D'Agostino, R. B. , Levy, D. , Belanger, A. M. , Silbershatz, H. , & Kannel, W. B. (1998). Prediction of coronary heart disease using risk factor categories. Circulation, 97(18), 1837–1847. 10.1161/01.CIR.97.18.1837 [DOI] [PubMed] [Google Scholar]
- Wisely, N. A. , & Cook, L. B. (2001). Arterial flow waveforms from pulse oximetry compared with measured Doppler flow waveforms apparatus. Anaesthesia, 56(6), 556–561. 10.1046/j.1365-2044.2001.01987.x [DOI] [PubMed] [Google Scholar]
- Xing, C. Y. , Tarumi, T. , Liu, J. , Zhang, Y. , Turner, M. , Riley, J. , … Zhang, R. (2017). Distribution of cardiac output to the brain across the adult lifespan. Journal of Cerebral Blood Flow and Metabolism, 37(8), 2848–2856. 10.1177/0271678X16676826 [DOI] [PMC free article] [PubMed] [Google Scholar]
- Zarrinkoob, L. , Ambarki, K. , Wahlin, A. , Birgander, R. , Carlberg, B. , Eklund, A. , & Malm, J. (2016). Aging alters the dampening of pulsatile blood flow in cerebral arteries. Journal of Cerebral Blood Flow and Metabolism, 36(9), 1519–1527. 10.1177/0271678X16629486 [DOI] [PMC free article] [PubMed] [Google Scholar]
- Zheng, L. , MacK, W. J. , Chui, H. C. , Heflin, L. , Mungas, D. , Reed, B. , … Kramer, J. H. (2012). Coronary artery disease is associated with cognitive decline independent of changes on magnetic resonance imaging in cognitively normal elderly adults. Journal of the American Geriatrics Society, 60(3), 499–504. 10.1111/j.1532-5415.2011.03839.x [DOI] [PMC free article] [PubMed] [Google Scholar]
Associated Data
This section collects any data citations, data availability statements, or supplementary materials included in this article.
Data Availability Statement
Data sharing is not applicable. A limited version of the code is available upon request to corresponding author.