Abstract
Trans-Pacific transport of enhanced ozone plumes has been mainly attributed to fossil fuel combustion in Asia in spring, but less attention has been paid to vegetation fires in Asia. Here we show that the El Niño-Southern Oscillation (ENSO)-modulated fires in Southeast Asia, rather than Asian fossil fuel plumes, dominate the interannual variability of springtime trans-Pacific transport of ozone across the entire North Pacific Ocean. During El Niño springs, the intensified fires from both the Indochinese Peninsula and Indonesia, together with large-scale circulation anomalies, result in enhanced ozone plumes that stretch over 15 000 km in both the lower-middle and upper troposphere. This enhancement is also observed in the in situ measurements of ozone concentration, with an almost 10% increase at Mauna Loa Observatory, Hawaii, a unique site to monitor the long-distance transport over the North Pacific. This study reports an unexpectedly strong influence of vegetation fires, linked with climate variability, on global tropospheric chemistry and proves once more how complex the interactions in the climate system are.
Keywords: El Niño-Southern Oscillation (ENSO), climate, biomass burning, tropospheric ozone, long-range transport, Southeast Asia
INTRODUCTION
Ozone (O3), together with the hydroxyl radical (OH), dominates the atmospheric oxidizing capacity and cycling of reactive trace gases in the troposphere, and thereby plays a key role in atmospheric chemistry and climate change [1–6]. As a result of its lifetime of a few weeks in the free troposphere, O3 can be transported on regional to intercontinental scales [2,7–11]. Previous studies of long-range transport of O3 and its precursors from Asia have mainly focused on anthropogenic fossil fuel (FF) combustion sources [7,10–14]. Intercontinental transport from Asia to North America at mid-latitudes is particularly strong in spring because of frequent cold fronts related to a favorable position of the jet stream [5,8,9,15,16]. Here we instead focus on the subtropics and show that the springtime biomass burning (BB) emissions in Southeast Asia, including the Indochinese Peninsula and Indonesia, dominate the O3 interannual variability across the subtropical North Pacific Ocean under the influence of the El Niño-Southern Oscillation (ENSO).
RESULTS
Interannual variability of O3 over the subtropical North Pacific Ocean
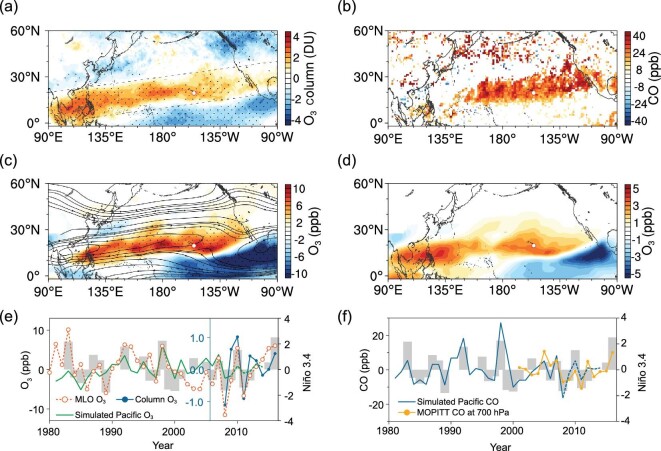
Figure 1 shows how the springtime distribution of O3 and its precursors across the subtropical North Pacific Ocean are linked to ENSO. The IASI satellite retrievals show that during El Niño, a positive anomaly of tropospheric O3 (below 6 km) extends in spring from the South China Sea northeastward to southwestern North America and the Gulf of Mexico (Fig. 1a). This belt of O3 anomalies, with an average value of 1.7 DU, has a width of about 1500 km and a length of over 15 000 km, far longer than the mid-latitude intercontinental transport pathways from East Asia to North America and from eastern North America to Europe [17,18]. As a precursor of O3 and a tracer for combustion sources [19], carbon monoxide (CO) from MOPITT satellite retrievals also shows an anomalous distribution during El Niño springs (Fig. 1b).
Figure 1.
ENSO-induced O3 and CO enhancements over the subtropical North Pacific Ocean in spring. (a) Difference of IASI retrieved 0–6 km O3 column in El Niño and La Niña springs. (b) Difference of MOPITT retrieved 700 hPa CO between El Niño and La Niña springs. Only statistically significant data (P < 0.1) are shown. (c) Simulated climatological streamlines and ENSO-induced O3 difference at 680 hPa (the results were deduced based on ElNino_BASE and LaNina_BASE runs given in Supplementary Table 1). (d) The first EOF mode of spring O3 at 680 hPa in 1981–2008 (from the FSDSMAM-hist Experiment). (e) Simulated O3 over the subtropical Pacific (averaged for the dashed box in (a)), observed O3 at Mauna Loa Observatory (MLO), satellite retrieved O3 column in spring, and Niño 3.4 index averaged in the preceding December–February (DJF) (gray bars). (f) Simulated and MOPITT observed CO over the subtropical Pacific in spring and Niño 3.4 index averaged in the preceding DJF. The dotted areas in (a) and (c) indicate statistical significance with 90% confidence.
Simulations using the Community Earth System Model (CESM) CAM-Chem [20] in specified dynamics mode based on the MERRA reanalysis for the period 1981–2015 capture well the positive O3 anomaly (Fig. 1c). By applying Empirical Orthogonal Function (EOF) analysis, we find that the first principal component (PC1) of the simulated springtime O3 given in Fig. 1d is consistent with the O3 distributions in Fig. 1a and c, and can explain 25% of the O3 variability in the subtropical North Pacific (Supplementary Fig. 1). The time series of O3 and CO from satellite retrievals and model simulations in the marked region across the northern subtropical Pacific (defined in Fig. 1a), as well as the EOF results, all consistently show in-phase fluctuations with the pre-spring (December–February) ENSO index Niño 3.4 [21] (Fig. 1e and f, Supplementary Fig. 1).
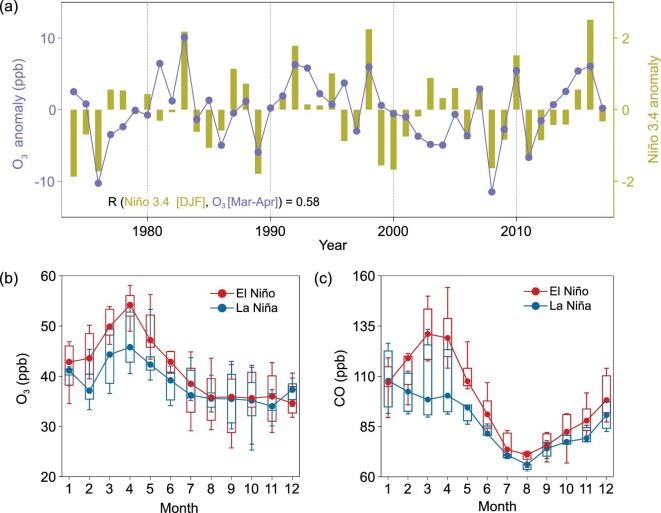
Figure 1a–d shows that the belts of O3 and CO anomalies intersect Mauna Loa Observatory (MLO), Hawaii, a well-known Global Atmosphere Watch (GAW) station with long continuous records of ambient baseline carbon dioxide and O3 [12,22]. The boreal spring (March and April) O3 concentrations at MLO correlate with the pre-spring Niño 3.4 index (Fig. 1e). A comparison of the mean seasonal cycles of O3 and CO between selected El Niño and La Niña years clearly shows that the ENSO-induced anomalies in O3 and CO occur mainly in spring, with particularly large differences in March and April of about 7 ppb and 30 ppb, respectively (Fig. 2).
Figure 2.
Impact of ENSO on O3 and CO at Mauna Loa Observatory. (a) Springtime (March–April) O3 anomaly at MLO and Niño 3.4 anomaly of the preceding winter (December–February). Local time 0:00–8:00 data are averaged to represent the ozone level of free tropospheric air. Seasonal variations of MLO O3 (b) and CO (c) in El Niño and La Niña years (defined by the 10 highest and 10 lowest years in the Niño 3.4 index, respectively). Whiskers in (b) and (c) show the 25–75% data range and bars give the 10th and 90th percentiles.
Sea surface temperature (SST) anomalies shift atmospheric circulations and modulate spring O3
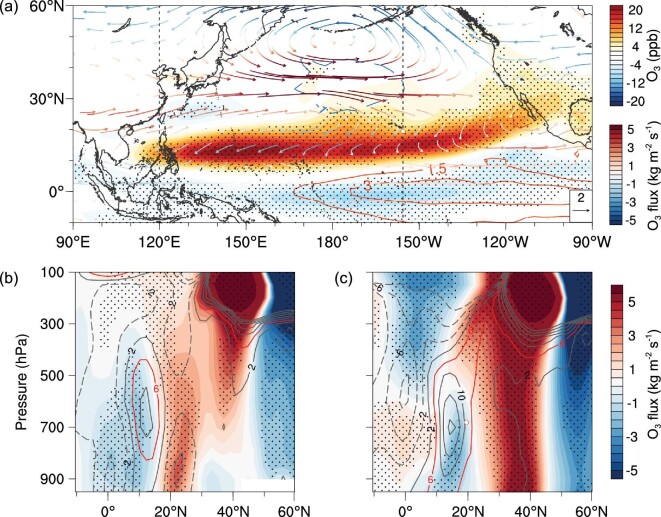
ENSO is known to be one of the main processes that regulates the interannual variability of the atmospheric circulation [23–26], and has been found to exert a strong impact on tropospheric ozone and other chemical constituents in tropical regions and in the Northern Hemisphere mid-latitudes [27–29]. To further isolate the impact of ENSO on the O3 enhancement, we conducted two sensitivity runs of CAM-Chem forced with composite typical ENSO SST with climatological emissions [21,30] (Supplementary Table 1). The O3 differences between the two runs (Fig. 3a) are consistent with the satellite measurements and the simulations nudged with the MERRA data (Fig. 1a and c), indicating that the ENSO SST anomaly is the main driver of the shifting circulation patterns that influence the inter-annual variability of lower tropospheric O3 across the subtropical North Pacific Ocean. The ENSO-induced wind-vector anomalies clearly indicate enhanced continental outflow from the Asian subtropics and mid-latitudes (20°N–40°N) to the central Pacific (Fig. 3). Figure 3a also suggests an ENSO-induced enhancement of anti-cyclonic circulation in the subtropical western Pacific, which may cause more descending motion and stronger solar radiation and hence enhanced chemical production of O3, despite a relatively weak CO anomaly in the western Pacific (Fig. 3a, Supplementary Fig. 2a).
Figure 3.
ENSO-induced anomalies in O3 and its flux simulated by SST-driven CESM. (a) Simulated springtime O3 difference at 680 hPa between ElNino_SST and LaNina_SST runs. Isolines show prescribed SST difference in the preceding DJF. Vectors are horizontal wind anomalies, colored by O3 flux difference at 680 hPa. Latitude cross-section of the difference in O3 (contours) and its flux (in isolines by 1 kg m−2 s−1) between ElNino_SST and LaNina_SST runs at 120°E (b) and 155°W (c), indicated by the dashed line in (a). The dotted areas indicate statistical significance with 90% confidence.
The vertical cross-section of the differences in O3 fluxes along 120°E between the two runs clearly shows two isolated centers of outflow anomalies from Asia (Fig. 3b and Supplementary Fig. 2b). In the lower troposphere, the dominant O3 and CO fluxes in the western Pacific exist around 26°N (Fig. 3b), corresponding to the anomaly of northeastward transport in the coastal region of southern China (Fig. 3a, Supplementary Fig. 2a). Further south, near 10°N–15°N, the O3 enhancement in El Niño spring is associated with stronger westward transport (i.e. negative flux) of the recirculated aged plume. In the central-eastern Pacific (i.e. along 155°W), the ENSO induced tropospheric O3 enhancement has a maximum value around 700 hPa between 10°N and 25°N, associated with stronger westward transport of aged continental flows recirculated from Asia (Fig. 3a and c). Interestingly, MLO is located at the key location where the flow bifurcates to the west and the east horizontally, and where the enhancement reaches its maximum vertically, making it a key site for monitoring the ENSO-induced long-range transport of Asian pollutants.
Stronger biomass burning in ENSO years dominates spring O3 enhancement
Previous studies [7,12,31,32] revealed transport pathways of Asian FF pollutants across the North Pacific Ocean. In our study, the enhanced transport flux of O3 and CO plumes from tropical and subtropical Asia are consistent with the previously reported pathways of Southeast Asia BB plumes [8,9], which are particularly strong in spring [8]. In addition, the BB emission intensity in this region is also linked with ENSO because of reduced precipitation during El Niño years [27,33]. As shown in Supplementary Fig. 3 and Supplementary Table 2, the BB emission intensity can be up to 57% higher in El Niño years. Lagrangian backward dispersion modelling indicates that during the El Niño springs, air masses at MLO experience a greater residence time above South and Southeast Asia (Supplementary Fig. 4). Accordingly, measurements at MLO in spring show a good correlation between O3 and CH3Cl, an effective BB tracer, and the Lagrangian modelling results clearly establish a link to the main BB source regions in tropical and subtropical Asia (Supplementary Fig. 5). The springtime maxima of O3 and CO at MLO (Fig. 2b and c) also indicate a ΔO3/ΔCO ratio of about 0.3, which is quite typical of aged BB plumes [34,35].
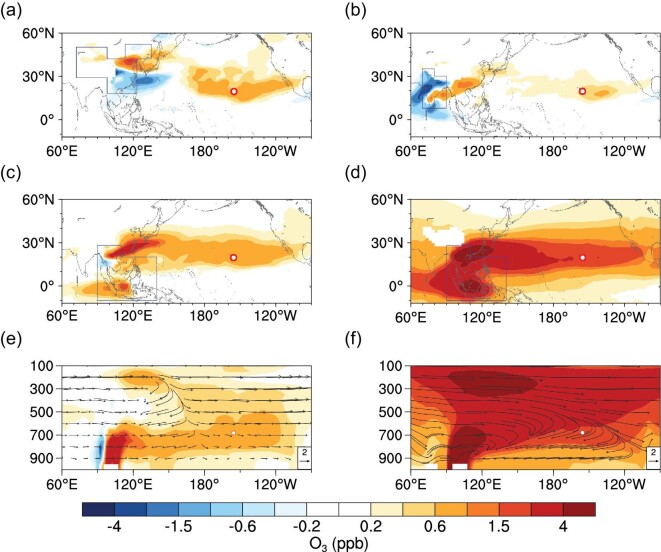
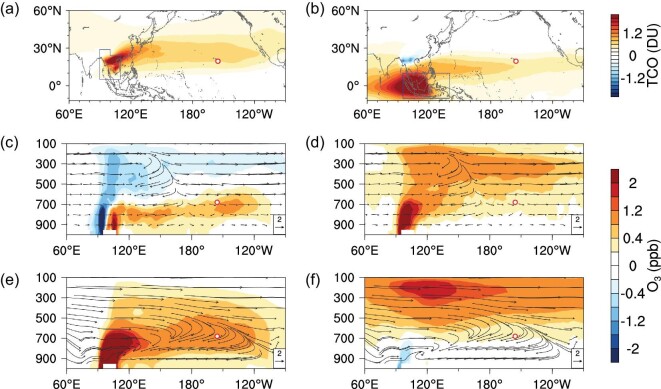
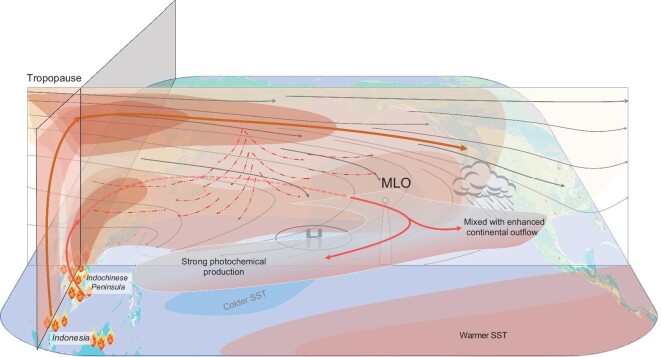
We further conducted a series of CAM-Chem simulations (Supplementary Table 1) to quantify the relative contributions from major source regions in Asia. The FF emissions in China mainly cause a positive O3 anomaly in the eastern Pacific (Fig. 4a), consistent with the wind anomaly shown in Fig. 3a, while those from India cause a weak anomaly in the eastern Pacific, but a stronger anomaly over southern China and southern India (Fig. 4b). However, for BB emissions in Southeast Asia, both the ENSO-induced anomalies in circulation and enhanced BB emissions make stronger contributions to the O3 and CO anomalies stretching from subtropical Asia to North America (Fig. 4c and d, Supplementary Figs 6 and 7). The ENSO-induced circulation anomaly causes enhancements of O3 and CO in the lower-middle troposphere (between 600 and 800 hPa), with a bifurcated wind flow anomaly in the central Pacific (Fig. 4e, Supplementary Fig. 6e). However, the difference in BB emissions produces a stronger impact over the subtropical Pacific, with two isolated strong vertical anomalies in the lower troposphere and the upper troposphere, for both O3 and CO (Fig. 4f and Supplementary Fig. 6f). The enhanced BB emissions from the Indochinese Peninsula and Indonesia in El Niño springs control the O3 anomalies in lower-middle troposphere and the upper troposphere, respectively, over the entire subtropical North Pacific Ocean (Fig. 5). These results are consistent with the vertical O3 anomalies revealed by ozonesonde profiles from Hilo, Hawaii (close to MLO) (Supplementary Fig. 8), located between the two belts of tropospheric O3 column enhancements from Indonesia and the central-eastern Pacific, respectively (Fig. 5a and b). The detailed transport mechanism and key processes of the BB smoke transport from the Indochinese Peninsula and Indonesia that influence the O3 enhancement over the subtropical Pacific are illustrated in Fig. 6.
Figure 4.
Contributions of ENSO-induced O3 anomalies from main Asian emission sources in spring. Averaged O3 response to anthropogenic emissions over China (a) and India (b) in El Niño and La Niña springs (March and April) at 680 hPa. (c) Averaged O3 response to climatological BB emissions over SE Asia under ENSO circulations in El Niño and La Niña springs at 680 hPa. (d) Averaged O3 response to ENSO-induced emission intensity variability over SE in El Niño and La Niña springs at 680 hPa. (e, f) Cross-sections of O3 anomalies over 15°N–25°N, corresponding to (c) and (d). The vectors are climatological springtime winds in (f) and wind anomalies between El Niño and La Niña springs in (e). Note that the vertical components of wind are scaled 1000 times for better illustration. Source regions in (a–d) are denoted by blue polygons. Red circles mark the location of MLO.
Figure 5.
Comparison of ENSO-induced O3 anomalies from biomass burning in the Indochinese Peninsula and Indonesia in spring. Averaged response of the total column O3 (TCO) below 200 hPa to averaged BB emissions from the Indochinese Peninsula (a) and Indonesia (b) in El Niño and La Niña springs. (c–e) Cross-section of O3 anomalies averaged over 15°N–25°N caused by ENSO-induced circulation differences (with climatologically averaged BB emission intensity). (d–f) Cross-section of averaged O3 anomalies by ENSO-related BB emission differences over the Indochinese Peninsula (d) and Indonesia (f). Source regions are denoted by blue polygons. Red circles mark the location of MLO. Source contributions were calculated as listed in Supplementary Table 1.
Figure 6.
Conceptual schematic of the trans-Pacific O3 enhancement induced by ENSO and ENSO-mediated vegetation fires in Southeast Asia in spring. The vertical cross-section shows the O3 plumes and wind flows (gray lines for climatological average and red dashed ones for the anomaly in El Niño spring). Red and brown bold lines show the main transport pathways of biomass burning plumes from the Indochinese Peninsula, and Indonesia, respectively. The red dashed lines present the ENSO-induced wind anomalies along the cross-section. Blue and pink areas over the Pacific indicate the SST anomaly between the El Niño and La Niña years.
CONCLUSION
Our results have expanded understanding of the intercontinental-scale transport of Asian pollutants to North America [7,12,31,32] and of the roles of interannual variability in emissions and meteorology on tropospheric O3 [14,27,36]. We find that ENSO plays a greater role than previously thought as a driver of the interannual variability of both lower-tropospheric and upper-tropospheric O3 over the subtropical North Pacific Ocean and its subsequent transport to North America. In particular, our work shows that the year-to-year difference in BB emissions modulated by ENSO makes a stronger contribution than the anomalies because of meteorological variability alone. It proves once more how complex the interactions in the climate system are. This study highlights the importance of continuous measurements in the remote North Pacific Ocean for characterizing the impacts from both natural climate variability and human activity, and also suggests that better ENSO forecasting could improve modelling of continental-scale long-range transport of air pollutants.
MATERIALS AND METHODS
Observations, data and ENSO events definition
Ambient ozone mixing ratios have been measured at MLO since 1973 [37] and the MLO CO record covers 1989 to the present [38]. To exclude possible influences from daytime upslope winds [22], our analysis is restricted to nighttime (0:00–8:00 local time) observations.
We use the monthly 0–6 km column O3 dataset retrieved by Infrared Atmospheric Sounding Interferometer (IASI) [39] from 2008 to 2017 to compute the springtime column O3 composites in different ENSO phases. Daytime CO profiles from the Measurements of Pollution in the Troposphere (MOPITT) [8,40] are used to compute the CO composite maps under El Niño and La Niña conditions during 2000–2014.
We use the Empirical Orthogonal Function (EOF) analysis to objectively identify the dominant modes of variability of springtime (Mar–Apr) tropospheric O3. This technique is applied on model-simulated O3 at 680 hPa from 1981 to 2008 over 20°S–60°N, 60°E–90°W.
Niño 3.4 index is used to represent the ENSO evolution. Ten El Niño events and 10 La Niña events are identified in this study. The definition of ENSO events is described in the Supplementary data.
Simulations with CESM model
We use the Community Atmosphere Model Version 5 with Chemistry (CAM5-Chem) [41] of the National Center for Atmospheric Research (NCAR) Community Earth System Model (CESM) version 1.2.2 to examine the response of the atmospheric circulation and chemical processes to ENSO events. Two sensitivity experiments, with SSTs prescribed to El Niño and La Niña conditions, and a series of simulations in specified dynamics mode, with meteorological fields nudged to the Modern Era-Retrospective Analysis for Research and Applications (MERRA) reanalysis dataset [42], have been conducted in this study. Detailed information of model description, experiments configurations and emission scenarios of these experiments are described in the Supplementary data.
Lagrangian particle dispersion modeling
Lagrangian particle dispersion modeling is applied to demonstrate the transport pathways and track the potential sources of air masses recorded at MLO based on the Hybrid Single Particle Lagrangian Integrated Trajectory (HYSPLIT) model [43]. Three-thousand particles were released every hour at 3400 m above sea level over MLO, which are then tracked backward in time for 20 days. The footprint of the retroplume, which is represented by the residence time of particles below 100 m [44], is used to identify potential emissions source regions and to gauge the relative impact of the emissions at MLO.
Data and materials availability
The observations, met data and modeling codes are freely available. Measurements from MLO are available from the NOAA Global Monitoring Division (GMD). Methyl chloride data from MLO were provided by S. Montzka, NOAA.
Supplementary Material
Acknowledgements
We thank Steve Montzka and Gaby Montzka at NOAA for providing methyl chloride and CO data at MLO. We thank M.Y. Lin at NOAA for helpful discussions.
Contributor Information
Lian Xue, Joint International Research Laboratory of Atmospheric and Earth System Sciences, School of Atmospheric Sciences, Nanjing University, Nanjing 210023, China; Jiangsu Provincial Collaborative Innovation Center for Climate Change, Nanjing 210023, China.
Aijun Ding, Joint International Research Laboratory of Atmospheric and Earth System Sciences, School of Atmospheric Sciences, Nanjing University, Nanjing 210023, China; Jiangsu Provincial Collaborative Innovation Center for Climate Change, Nanjing 210023, China.
Owen Cooper, Cooperative Institute for Research in Environmental Sciences, University of Colorado, Boulder, CO 80305, USA; Chemical Sciences Division, NOAA Earth System Research Laboratory, Boulder, CO 80305, USA.
Xin Huang, Joint International Research Laboratory of Atmospheric and Earth System Sciences, School of Atmospheric Sciences, Nanjing University, Nanjing 210023, China; Jiangsu Provincial Collaborative Innovation Center for Climate Change, Nanjing 210023, China.
Wuke Wang, Joint International Research Laboratory of Atmospheric and Earth System Sciences, School of Atmospheric Sciences, Nanjing University, Nanjing 210023, China; Jiangsu Provincial Collaborative Innovation Center for Climate Change, Nanjing 210023, China.
Derong Zhou, Joint International Research Laboratory of Atmospheric and Earth System Sciences, School of Atmospheric Sciences, Nanjing University, Nanjing 210023, China; Jiangsu Provincial Collaborative Innovation Center for Climate Change, Nanjing 210023, China.
Zhaohua Wu, Joint International Research Laboratory of Atmospheric and Earth System Sciences, School of Atmospheric Sciences, Nanjing University, Nanjing 210023, China; Department of Earth, Ocean and Atmospheric Sciences, Florida State University, Tallahassee, FL 32306, USA.
Audra McClure-Begley, Cooperative Institute for Research in Environmental Sciences, University of Colorado, Boulder, CO 80305, USA; Global Monitoring Division, NOAA Earth System Research Laboratory, Boulder, CO 80305, USA.
Irina Petropavlovskikh, Cooperative Institute for Research in Environmental Sciences, University of Colorado, Boulder, CO 80305, USA; Global Monitoring Division, NOAA Earth System Research Laboratory, Boulder, CO 80305, USA.
Meinrat O Andreae, Max Planck Institute for Chemistry, Mainz 55128, Germany; Scripps Institution of Oceanography, University of California, San Diego, La Jolla, CA 92093, USA.
Congbin Fu, Joint International Research Laboratory of Atmospheric and Earth System Sciences, School of Atmospheric Sciences, Nanjing University, Nanjing 210023, China; Jiangsu Provincial Collaborative Innovation Center for Climate Change, Nanjing 210023, China.
FUNDING
The work was supported by the National Natural Science Foundation of China (41725020 and 41621005).
AUTHOR CONTRIBUTIONS
A.D. conceived the overall idea. L.X., A.D., X.H. and W.W. carried out the data analysis and model simulations. A.D., L.X. and X.H. wrote the manuscript with input from all co-authors.
Conflict of interest statement . None declared.
References
- 1. Crutzen PJ. Photochemical reactions initiated by and influencing ozone in unpolluted tropospheric air. Tellus 1974; 26: 47– 57. [Google Scholar]
- 2. Liu SC, Trainer M, Fehsenfeld FCet al. . Ozone production in the rural troposphere and the implications for regional and global ozone distributions. J Geophys Res-Atmos 1987; 92: 4191– 207. [Google Scholar]
- 3. Lelieveld J, Dentener FJ. What controls tropospheric ozone? J Geophys Res-Atmos 2000; 105: 3531– 51. [Google Scholar]
- 4. IPCC . Climate Change 2013: the Physical Science Basis. Cambridge: Cambridge University Press, 2013. [Google Scholar]
- 5. Monks PS, Archibald AT, Colette Aet al. . Tropospheric ozone and its precursors from the urban to the global scale from air quality to short-lived climate forcer. Atmos Chem Phys 2015; 15: 8889– 973. [Google Scholar]
- 6. Gaudel A, Cooper OR, Ancellet Get al. . Tropospheric Ozone Assessment Report: present-day distribution and trends of tropospheric ozone relevant to climate and global atmospheric chemistry model evaluation. Elementa-Sci Anthrop 2018; 6: 39. [Google Scholar]
- 7. Jaffe D, Anderson T, Covert Det al. . Transport of Asian air pollution to North America. Geophys Res Lett 1999; 26: 711– 4. [Google Scholar]
- 8. Jacob DJ, Crawford JH, Kleb MMet al. . Transport and Chemical Evolution over the Pacific (TRACE-P) aircraft mission: design, execution, and first results. J Geophys Res-Atmos 2003; 108: 1– 19. [Google Scholar]
- 9. Liu HY, Jacob DJ, Chan LYet al. . Sources of tropospheric ozone along the Asian Pacific Rim: an analysis of ozonesonde observations. J Geophys Res-Atmos 2002; 107: 4573. [Google Scholar]
- 10. Cooper OR, Stohl A, Eckhardt Set al. . A springtime comparison of tropospheric ozone and transport pathways on the east and west coasts of the United States. J Geophys Res-Atmos 2005; 110: D05S90. [Google Scholar]
- 11. Cooper OR, Parrish DD, Stohl Aet al. . Increasing springtime ozone mixing ratios in the free troposphere over western North America. Nature 2010; 463: 344– 8. [DOI] [PubMed] [Google Scholar]
- 12. Lin MY, Horowitz LW, Oltmans SJet al. . Tropospheric ozone trends at Mauna Loa Observatory tied to decadal climate variability. Nat Geosci 2014; 7: 136– 43. [Google Scholar]
- 13. Lin MY, Horowitz LW, Payton Ret al. . US surface ozone trends and extremes from 1980 to 2014: quantifying the roles of rising Asian emissions, domestic controls, wildfires, and climate. Atmos Chem Phys 2017; 17: 2943– 70. [Google Scholar]
- 14. Ziemke JR, Chandra S. La Niña and El Niño-induced variabilities of ozone in the tropical lower atmosphere during 1970–2001. Geophys Res Lett 2003; 30: 1142. [Google Scholar]
- 15. Forster C, Cooper O, Stohl Aet al. . Lagrangian transport model forecasts and a transport climatology for the Intercontinental Transport and Chemical Transformation 2002 (ITCT 2K2) measurement campaign. J Geophys Res-Atmos 2004; 109: D07S92. [Google Scholar]
- 16. Koumoutsaris S, Bey I, Generoso Set al. . Influence of El Niño-Southern Oscillation on the interannual variability of tropospheric ozone in the northern midlatitudes. J Geophys Res-Atmos 2008; 113: D19301. [Google Scholar]
- 17. HTAP . Hemispheric Transport of Air Pollution 2010: Part A: Ozone and Particulate Matter. Geneva: United Nations Publication, 2010. [Google Scholar]
- 18. Monks PS, Granier C, Fuzzi Set al. . Atmospheric composition change—global and regional air quality. Atmos Environ 2009; 43: 5268– 350. [Google Scholar]
- 19. Parrish DD, Holloway JS, Trainer Met al. . Export of North-American ozone pollution to the North-Atlantic ocean. Science 1993; 259: 1436– 9. [DOI] [PubMed] [Google Scholar]
- 20. Tilmes S, Lamarque JF, Emmons LKet al. . Description and evaluation of tropospheric chemistry and aerosols in the Community Earth System Model (CESM1.2). Geosci Model Dev 2015; 8: 1395– 426. [Google Scholar]
- 21. Timmermann A, An S-I, Kug J-Set al. . El Niño-Southern Oscillation complexity. Nature 2018; 559: 535– 45. [DOI] [PubMed] [Google Scholar]
- 22. Price S, Pales JC. Mauna Loa Observatory: the first five years. Mon Wea Rev 1963; 91: 665– 80. [Google Scholar]
- 23. McPhaden MJ, Zebiak SE, Glantz MH. ENSO as an integrating concept in Earth science. Science 2006; 314: 1740– 5. [DOI] [PubMed] [Google Scholar]
- 24. Fu CB, Diaz HF, Fletcher JO. Characteristics of the response of sea-surface temperature in the central pacific associated with warm episodes of the southern oscillation. Mon Weather Rev 1986; 114: 1716– 38. [Google Scholar]
- 25. Wang B, Wu RG, Fu XH. Pacific-East Asian teleconnection: how does ENSO affect East Asian climate? J Clim 2000; 13: 1517– 36. [Google Scholar]
- 26. Chen DK, Lian T, Fu CBet al. . Strong influence of westerly wind bursts on El Niño diversity. Nat Geosci 2015; 8: 339– 45. [Google Scholar]
- 27. Chandra S, Ziemke JR, Min Wet al. . Effects of 1997–1998 El Niño on tropospheric ozone and water vapor. Geophys Res Lett 1998; 25: 3867– 70. [Google Scholar]
- 28. Ziemke JR, Chandra S, Oman LDet al. . A new ENSO index derived from satellite measurements of column ozone. Atmos Chem Phys 2010; 10: 3711– 21. [Google Scholar]
- 29. Oman LD, Ziemke JR, Douglass ARet al. . The response of tropical tropospheric ozone to ENSO. Geophys Res Lett 2011; 38: L13706. [Google Scholar]
- 30. Deser C, Alexander MA, Xie S-Pet al. . Sea surface temperature variability: patterns and mechanisms. Annu Rev Mar Sci 2010; 2: 115– 43. [DOI] [PubMed] [Google Scholar]
- 31. Sekiya T, Sudo K. Roles of transport and chemistry processes in global ozone change on interannual and multidecadal time scales. J Geophys Res-Atmos 2014; 119: 4903– 21. [Google Scholar]
- 32. Sudo K, Takahashi M. Simulation of tropospheric ozone changes during 1997–1998 El Niño: meteorological impact on tropospheric photochemistry. Geophys Res Lett 2001; 28: 4091– 4. [Google Scholar]
- 33. Logan JA, Megretskaia I, Nassar Ret al. . Effects of the 2006 El Niño on tropospheric composition as revealed by data from the Tropospheric Emission Spectrometer (TES). Geophys Res Lett 2008; 35: L03816. [Google Scholar]
- 34. Jaffe DA, Wigder NL. Ozone production from wildfires: a critical review. Atmos Environ 2012; 51: 1–10. [Google Scholar]
- 35. Parrington M, Palmer PI, Lewis ACet al. . Ozone photochemistry in boreal biomass burning plumes. Atmos Chem Phys 2013; 13: 7321– 41. [Google Scholar]
- 36. Voulgarakis A, Savage NH, Wild Oet al. . Interannual variability of tropospheric composition: the influence of changes in emissions, meteorology and clouds. Atmos Chem Phys 2010; 10: 2491– 506. [Google Scholar]
- 37. McClure-Begley A, Petropavlovskikh I, Oltmans Set al. Earth System Research Laboratory Ozone Water Vapor Group Surface Ozone Measurements, Version 1. NOAA National Centers for Environmental Information 2013. DOI:10.7289/V57P8WBF. Data accessible at https://www.esrl.noaa.gov/gmd/ozwv/surfoz/data.html (29 July, date last accessed) [Google Scholar]
- 38. Novelli PC, Elkins JW, Steele LP. The development and evaluation of a gravimetric reference scale for measurements of atmospheric carbon-monoxide. J Geophys Res-Atmos 1991; 96: 13109– 21. [Google Scholar]
- 39. Boynard A, Hurtmans D, Koukouli MEet al. . Seven years of IASI ozone retrievals from FORLI: validation with independent total column and vertical profile measurements. Atmos Meas Tech 2016; 9: 4327– 53. [Google Scholar]
- 40. Deeter MN, Worden HM, Edwards DPet al. . Evaluation of MOPITT retrievals of lower-tropospheric carbon monoxide over the United States. J Geophys Res-Atmos 2012; 117: D13306. [Google Scholar]
- 41. Lamarque JF, Emmons LK, Hess PGet al. . CAM-chem: description and evaluation of interactive atmospheric chemistry in the Community Earth System Model. Geosci Model Dev 2012; 5: 369– 411. [Google Scholar]
- 42. Rienecker MM, Suarez MJ, Gelaro Ret al. . MERRA: NASA’s Modern-Era Retrospective Analysis for Research and Applications. J Clim 2011; 24: 3624– 48. [DOI] [PMC free article] [PubMed] [Google Scholar]
- 43. Stein AF, Draxler RR, Rolph GDet al. . NOAA’s HYSPLIT atmospheric transport and dispersion modeling system. Bull Amer Meteorol Soc 2015; 96: 2059– 77. [Google Scholar]
- 44. Ding AJ, Wang T, Fu CB. Transport characteristics and origins of carbon monoxide and ozone in Hong Kong, South China. J Geophys Res-Atmos 2013; 118: 9475– 88. [Google Scholar]
Associated Data
This section collects any data citations, data availability statements, or supplementary materials included in this article.


