

Abstract
Background:
Total knee replacement (TKR) is an effective and cost-effective strategy for treating end-stage knee osteoarthritis. Greater risk of complications among TKR recipients with BMI≥40kg/m2 has raised concerns regarding the value of TKR in this population.
Objective:
To assess the value of TKR in recipients with BMI≥40kg/m2 using a cost-effectiveness analysis.
Design:
Osteoarthritis Policy Model (OAPol) to assess long-term clinical benefits, costs, and cost-effectiveness of TKR in patients with BMI≥40kg/m2.
Data Sources:
Longitudinal studies and published literature to obtain TKR parameters, costs from Medicare Physician Fee Schedules, the Health Care Utilization Project, and published data.
Target Population:
TKR recipients with BMI≥40kg/m2 in the US
Time Horizon:
Lifetime
Perspective:
Healthcare Sector
Intervention:
TKR
Outcome Measures:
Cost, quality-adjusted life-years (QALYs), incremental cost-effectiveness ratios (ICERs), discounted at 3%/year
Results of Base-Case Analysis:
TKR increased QALYs by 0.71 and lifetime medical costs by $25,200 among patients with BMI≥40kg/m2 aged 50–65, resulting in an ICER of $35,200. TKR in patients aged >65 with BMI≥40kg/m2 increased QALYs by 0.39 and costs by $21,100, resulting in an ICER of $54,100.
Results of Sensitivity Analysis:
In TKR recipients with BMI≥40kg/m2 and diabetes and cardiovascular disease, ICERs were below $75,000/QALY. Results were most sensitive to complication rates and preoperative pain levels. In the probabilistic sensitivity analysis at a $55,000/QALY willingness-to-pay threshold, TKR had a 100% and 90% likelihood of being a cost-effective strategy for patients aged 50–65 and >65, respectively.
Limitations:
Data are derived from multiple sources.
Conclusion:
From a cost-effectiveness perspective, TKR offers good value in patients with BMI≥40kg/m2, including those with multiple comorbid conditions.
Introduction
Obesity is a major risk factor for knee osteoarthritis [1], which affects over 14 million adults in the United States [2]. As no structure-modifying treatments exist, adults with advanced knee osteoarthritis often consider total knee replacement (TKR). In the U.S., over 680,000 TKRs were performed in 2014, and the number continues to rise [3–5]. A growing proportion of patients receiving TKR are obese (BMI≥30kg/m2) [6–8]. In fact, 45.5% of TKR recipients in 2006–2010 had BMI between 30 to <40kg/m2, and 14.8% had BMI≥40kg/m2 [9].
Yet, many surgeons remain hesitant to operate on patients with morbid obesity (BMI≥40kg/m2), which is associated with increased risks of perioperative deep tissue infection, poor wound healing, venous thromboembolism, and implant failure [10–13]. In 2013, the American Association of Hip and Knee Surgeons (AAHKS) reported that “the morbidly obese (BMI>40kg/m2) and the super obese (BMI>50) have complication profiles that may outweigh the functional benefits of TKR” [14]. Despite these increased risks, prior studies suggest that patient-reported TKR outcomes are similar between non-obese patients and patients with BMI≥40kg/m2 [15, 16]. Thus, although patients with BMI≥40kg/m2 face greater perioperative risks than patients with lower BMI, they may also experience substantial pain reduction and large quality of life gains after TKR.
TKR has been shown to be cost-effective in a general population of knee osteoarthritis patients [17–21]. In the only prior study of the cost-effectiveness of TKR in recipients with BMI>30kg/m2, Ponnusamy et al. provided evidence suggesting TKR is cost-effective in persons with BMI 40–50kg/m2 and >50kg/m2 [22]. However, their work did not consider differences in perioperative primary TKR mortality or other surgery-associated adverse events by obesity level. We aim to evaluate the cost-effectiveness of TKR in individuals with BMI≥40kg/m2, accounting for increased complication rates and mortality among these patients.
Methods
Analytic overview
In two patient populations (ages 50–65 and ages >65) with BMI≥40kg/m2, end-stage symptomatic knee osteoarthritis, and the prevalence and incidence of five prognostically-important groups of comorbid conditions (see Appendix, 2.4 for more detail), we used the Osteoarthritis Policy (OAPol) Model to evaluate the incremental cost-effectiveness ratio (ICER) of TKR. We calculated the ICER as the ratio of the difference in costs (lifetime medical costs in 2018 USD with and without TKR) to the corresponding difference in quality-adjusted life years (QALYs), discounting both outcomes at 3% annually [23]. We conducted analyses from the healthcare sector’s perspective since cost-effectiveness considerations may inform TKR recommendations made by hospitals and health systems.
The OAPol Model
A widely published, validated microsimulation of knee osteoarthritis [20, 24–27] (Figure 1), the OAPol model simulates the natural history and treatment of one million individuals one at a time with each individual assigned demographic (age, sex, race/ethnicity) and clinical characteristics (BMI, preoperative pain, cardiovascular disease, diabetes mellitus, cancer, chronic obstructive pulmonary disease, and non-osteoarthritis musculoskeletal diseases) based on user-defined distributions. Over 6-month model cycles, patients pass through health states and accumulate osteoarthritis-related and non-osteoarthritis related, quality-adjusted life expectancy and medical costs. Quality of life (QOL) is expressed as a utility – with value 0.0 assigned to death and value 1.0 assigned to perfect health – stratified by obesity, knee pain, age, number of comorbidities, and treatment-related complications. Pain relief from TKR leads to higher QOL, and TKR-related complications reduce QOL and increase cost. Centers for Disease Control and Prevention (CDC) Life Tables, modified by comorbidities, determined the risk of mortality [28–30]. Documentation for OAPol Model Version 4.1.0 is available upon request.
Figure 1.

Health states and treatment sequence in the OAPol Model among TKR recipients.
Patients may spend several cycles in the same state or transition to another health state. The arrows specify transitions between health states, defined as probabilities in the input parameters of the OAPol Model. “sufficient” pain relief refers to a post-TKR health state associated with quality-of-life improvement. Death may occur from every health state. BMI = body mass index; OAPol = Osteoarthritis Policy; TKR = total knee replacement.
Treatment strategies
Our model examined two strategies: 1) all patients accepted and underwent TKR, and 2) all patients did not undergo TKR.
Model inputs
OAPol model inputs are stratified by three domains: 1) population characteristics, 2) TKR-related treatment characteristics, and 3) treatment modalities in the absence of TKR. Table 1 lists key input parameters (see other parameters in the Appendix).
Table 1.
Key model inputs for cohort persons with end-stage knee osteoarthritis and BMI>40kg/m2
| Ages 50–65 | Ages >65 | Source | |
|---|---|---|---|
| Mean (SD*) | Mean (SD) | ||
| Population Characteristics | |||
| Age | 58.8 (4.5) | 72.0 (5.3) | [32–34] |
| Female (%) | 75.0 | 75.0 | [31] |
| Race/Ethnicity | [31] | ||
| White (%) | 88.0 | 88.0 | |
| Black (%) | 4.5 | 4.5 | |
| Hispanic (%) | 3.0 | 3.0 | |
| BMI | [59] | ||
| White, Male | 45.0 (5.2) | 43.1 (1.8) | |
| White, Female | 43.0 (4.9) | 44.8 (4.7) | |
| Black, Male | 45.1 (4.9) | 44.5 (3.3) | |
| Black, Female | 44.3 (5.2) | 46.3 (6.7) | |
| Hispanic, Male | 42.9 (2.6) | 42.9 (1.9) | |
| Hispanic, Female | 46.5 (5.2) | 42.8 (2.8) | |
| Preoperative Pain† | 54.2 (15.3) | 47.5 (12.0) | [32–34] |
| Both Age Groups | |||
| TKR‡ Characteristics | Mean (SD) | ||
| Primary TKR Pain Decrement | [32–34] | ||
| Moderate Preoperative Pain§ | 16.5 (16.4) | ||
| Severe Preoperative Pain‖ | 38.1 (18.0) | ||
| Revision TKR Pain Decrement | [32–34] | ||
| Moderate Preoperative Pain | 13.1 (16.4) | ||
| Severe Preoperative Pain | 30.2 (18.0) | ||
| Costs | |||
| TKR Cost | $18,955 | [40] | |
| Revision TKR Cost | $26,687 | [40] | |
| Additional non-OA¶ related medical costs due to obesity (per year) | $3,573 | [43] | |
SD: Standard Deviation
Preoperative pain according to the Western Ontario and McMaster Universities Osteoarthritis Index (WOMAC) pain scale (0 = best, 100 = worst). Among patients aged 50–65 with BMI≥40kg/m2, 17% had moderate preoperative pain, and 82% had severe preoperative pain. In the group aged >65 with BMI≥40kg/m2, 26% were in moderate preoperative pain, and 73% were in severe pain.
TKR: Total Knee Replacement
Moderate Pain: WOMAC pain 15–40
Severe Pain: WOMAC pain greater than 40
OA: osteoarthritis of the knee
Population characteristics
Patients were 75% female and 88% white [31] with mean age 59(5) and 72(5) in the cohorts aged 50–65 and >65, respectively [32–34] with BMI distributions stratified by age, sex and race/ethnicity (Table 1). On the Western Ontario and McMaster Universities Osteoarthritis Index (WOMAC) pain scale (0 = best, 100 = worst; severe pain is >40), patients aged 50–65 had an average preoperative pain of 54(15), and patients aged >65 had an average preoperative pain of 48(12) (Table 1). Each patient with BMI≥40kg/m2 received an additional QOL utility decrement of 0.07 (Appendix, 2.3.2).
TKR Treatment
Benefits:
We derived average improvements in WOMAC pain after primary TKR from previously reported studies [32–34] (Table 1; Appendix, 3.3.1). We used published data on failure probabilities, stratified by BMI, to estimate the probability of implant survival in the first 6 months after TKR [35–37] (Appendix, 3.2.1).
Harms:
We derived probabilities of the following TKR complications: pulmonary embolism, pneumonia, readmission, renal failure, deep vein thrombosis, wound dehiscence, and periprosthetic joint infection [35] (Appendix, 3.1.1). All complications increased costs and decreased QOL (Appendix, 3.1.2 and 3.1.3); periprosthetic joint infection always led to revision TKR. After the first six months, TKR had a 0.48% annual probability of failure to provide pain relief (Appendix 3.3.1). In the event of a surgical failure, we modeled an increase in WOMAC pain based on pain scores for primary and revision TKR (Appendix, 3.3.2) [38]. Furthermore, revision TKR recipients experienced worse pain outcomes and more surgical complications than primary TKR recipients [38, 39] (Appendix, 3.1.1, 3.2.2 and 3.3.3).
Costs:
BMI>40 kg/m2 has been shown to be associated with an increase in TKR procedure costs [40], reflecting greater resource consumption, such as longer operative times, greater anesthesia costs, and longer length of stay. We used data from multiple sources to determine a one-time primary TKR cost of $18,955 for patients with BMI≥40kg/m2 [40–42]; the cost of revision TKR for patients with BMI≥40kg/m2 was $7,732 more than primary TKR (Table 1; Appendix, 3.4.1). Patients had a 28% likelihood of visiting a physician’s office every six months post TKR at $169/visit, sustained for the duration of their life (Appendix, 3.4.2) [5, 18], and each complication was associated with an additional cost (Appendix, 3.1.3). To account for the effects of obesity on non-osteoarthritis medical costs and QOL, patients incurred medical costs that were not related to osteoarthritis and a decrement in QOL annually [43] (Appendix, 2.3).
Treatment modalities in the absence of TKR
We assumed that in the absence of TKR, knee osteoarthritis patients with BMI≥40kg/m2 exhausted all available conservative treatment regimens and resorted to occasional analgesic pain management, which incurred costs but did not provide sustained pain relief.
Sensitivity analyses
Varying cohort characteristics
Comorbid conditions:
As TKR outcomes have been shown to be worse for patients with comorbidities such as diabetes mellitus (DM) and cardiovascular disease (CVD) [44, 45], we examined how these comorbidities impact TKR cost-effectiveness among persons with BMI≥40kg/m2. In addition to our base case analysis for the overall population of TKR recipients with BMI≥40kg/m2, we conducted four analyses stratified by presence/absence of DM and/or CVD: 1) no DM or CVD, 2) DM only, 3) CVD only, and 4) both DM and CVD. Comorbid conditions decreased QOL and increased background medical costs and patients’ risk for incurring TKR complications (Appendix, 3.1.4) [41, 46–49].
Cohorts with BMI<40kg/m2:
For comparison, we examined populations with BMI<30kg/m2 and BMI 30 to <40kg/m2. Parameters that varied by BMI included pre-TKR pain, non-osteoarthritis medical costs, and TKR complication probabilities. Input values for these cohorts are provided in Appendix section 4.1.
One-way deterministic sensitivity analyses
We varied pre-TKR pain levels, TKR treatment efficacy, pain failure probabilities, and complication probabilities in one-way deterministic sensitivity analyses. We increased and decreased pre-TKR pain by 50% in 10% increments (from 150%−50% of base case pain). We varied TKR treatment efficacy similarly, from 50% (worst case) to 150% of base case efficacy. Annual late pain failure probabilities were tested at 0.25%, 1.0%, 2.0%, and 3.0% (base case probability was 0.48%). Complication rates ranged from 50% of base case probabilities to 700%.
Probabilistic sensitivity analyses
Probabilistic sensitivity analysis assigns a distribution to multiple parameters simultaneously where point estimates carry substantial uncertainty [50]. We conducted a probabilistic sensitivity analysis focused on the effectiveness of TKR in each age group by simultaneously varying: the QOL utility decrement due to obesity, late pain failure probabilities, TKR implant survival probabilities (primary and revision), and complication probabilities (primary and revision). We focused on parameters depicting TKR effectiveness because these are the TKR-related parameters that carry sizable uncertainty in this population. We used a normal distribution for the utility decrement and a beta distribution for the remaining parameters (Appendix Tables 25 and 26). We created 1000 scenarios with parameters repeatedly drawn from each distribution. Each unique set of inputs produces a unique set of model outputs. We aggregated these results in a cost-effectiveness acceptability curve, which shows the percentage of simulations for which TKR was cost-effective across a range of willingness-to-pay (WTP) thresholds.
Role of the funding source
This project was supported by the National Institute of Arthritis and Musculoskeletal and Skin Diseases (NIH) grants R01AR074290, K24AR057827, K24AR070892, P30AR072571, and P30AR072577. The funding sources played no role in the design, conduct, or reporting of the study.
IRB approval
This study was approved by the Partners IRB, protocol 2006P001290.
Results
Base case analysis
Table 2 presents discounted quality-adjusted life expectancies (QALEs), discounted lifetime costs, and incremental cost-effectiveness ratios (ICERs) of the base case analysis. TKR in patients with BMI≥40kg/m2 aged 50–65 resulted in an estimated discounted QALE of 10.1, compared to 9.3 for patients without TKR. TKR patients accrued an additional $25,200 in costs over age-matched patients without TKR (ICER = $35,200/QALY). Of this younger cohort, 0.45% experienced a periprosthetic joint infection.
Table 2.
Cost-effectiveness analysis results for persons with BMI ≥40kg/m2 and end-stage knee osteoarthritis
| Base Case | |||||
|---|---|---|---|---|---|
| Age Group | TKR* | PJI (%)† | QALE‡ | COST§ | ICER‖ |
| 50 – 64.9 | No | --- | 9.34 | $ 224,100 | $35,200 |
| Yes | 0.45% | 10.05 | $ 249,300 | ||
| >65 | No | --- | 6.32 | $ 176,400 | $54,100 |
| Yes | 0.61% | 6.71 | $ 197,500 | ||
| No Prevalent Comorbidities | |||||
| Age Group | TKR | PJI (%) | QALE | COST | ICER |
| 50 – 64.9 | No | --- | 9.55 | $ 192,600 | $34,500 |
| Yes | 0.44% | 10.29 | $ 217,900 | ||
| >65 | No | --- | 6.40 | $ 153,000 | $46,900 |
| Yes | 0.60% | 6.85 | $ 174,100 | ||
| Prevalent Diabetes Mellitus (DM) | |||||
| Age Group | TKR | PJI (%) | QALE | COST | ICER |
| 50 – 64.9 | No | --- | 9.26 | $ 235,500 | $39,000 |
| Yes | 0.77% | 9.96 | $ 263,100 | ||
| >65 | No | --- | 6.30 | $ 181,000 | $63,000 |
| Yes | 0.87% | 6.67 | $ 204,100 | ||
| Prevalent Cardiovascular Disease (CVD) | |||||
| Age Group | TKR | PJI (%) | QALE | COST | ICER |
| 50 – 64.9 | No | --- | 9.21 | $ 238,100 | $39,000 |
| Yes | 0.52% | 9.94 | $ 266,500 | ||
| >65 | No | --- | 6.31 | $ 181,400 | $64,400 |
| Yes | 0.68% | 6.68 | $ 205,400 | ||
| Both Diabetes Mellitus and Cardiovascular Disease Prevalent (DM + CVD) | |||||
| Age Group | TKR | PJI (%) | QALE | COST | ICER |
| 50 – 64.9 | No | --- | 9.16 | $ 247,000 | $41,200 |
| Yes | 0.77% | 9.89 | $ 277,300 | ||
| >65 | No | --- | 6.30 | $ 185,100 | $71,100 |
| Yes | 0.87% | 6.66 | $ 210,500 | ||
TKR: total knee replacement
Percent of cohort that experienced a periprosthetic joint infection
QALE: quality-adjusted life expectancy
All costs are in 2018 USD
ICER: incremental cost-effectiveness ratio
Patients aged >65 with TKR had a QALE of 6.7 versus 6.3 for age-matched patients without TKR; TKR increased costs by $21,100, resulting in an ICER of $54,100/QALY. 0.61% experienced a periprosthetic joint infection.
Additionally, TKR improved patient pain (Appendix Figures 1–3). Over 50% of patients aged >65 with BMI≥40kg/m2 had WOMAC pain scores of 15 or below over the first five years after surgery, compared to less than 1% of patients who did not have TKR (Appendix Figure 3). On average, these patients’ pain decreased 34.4 WOMAC points after TKR; those without TKR did not experience significant changes in pain over time.
Sensitivity analyses
Varying cohort characteristics
Stratified analysis by presence of DM/CVD:
Table 2 also shows results for knee osteoarthritis patients with no comorbidities, DM, CVD, and DM+CVD. In the absence of DM or CVD, we estimated the incremental cost-effectiveness ratio for TKR at $34,500/QALY for those aged 50–65, and $46,900/QALY for those aged >65. ICERs were higher than base case for the comorbidity cohorts; for the >65 age group, ICERs for the DM, CVD, and DM+CVD groups were $63,000/QALY, $64,400/QALY, and $71,100/QALY, respectively.
Cohorts with BMI<30kg/m2 and BMI 30 to <40kg/m2:
ICERs for the cohort with BMI<30kg/m2 were $27,500/QALY for those aged 50–65 and $34,400/QALY for those aged >65. Corresponding ICERs for the cohort with BMI 30 to <40kg/m2 were $37,200/QALY and $49,400/QALY. As compared with lifetime medical costs of $249,300 for TKR patients with BMI≥40kg/m2 and aged 50–65, the lifetime costs of patients of the same age were $199,800 in those with BMI 30 to <40kg/m2 and $156,300 in those with BMI<30kg/m2. We present detailed results in Appendix Part V.
One-way sensitivity analyses
Figure 2 depicts results of the one-way sensitivity analyses discussed below.
Figure 2.

Deterministic sensitivity analysis results.
This figure shows the effect of varying input parameters on the cost-effectiveness of TKR in patients with a body mass index of 40 kg/m2 or greater in 2 age groups: 50 to 65 years(top) and >65 years (bottom). The x-axis reports the ICER, calculated as the ratio of the difference in costs (total medical costs with and without TKR) to the corresponding difference in QALE. In each analysis, all parameters were held at base-case values except for the parameters shown on the y-axis, which were varied according to the range of values listed. The leftmost end of each bar represents the ICER when the parameter of interest is set to the most favorable value; the rightmost side represents the ICER at the parameter’s least favorable value. The exception for this is starting pain; because of the U-shaped relationship between starting pain and outcomes of knee replacement, the minimum ICER for the group aged 50 to 65 y corresponds to a 10% increase in starting pain, and the minimum ICER for the group aged >65 y corresponds to a 20% increase in starting pain. For all parameters, the ΔQALE at the left and right of each bar indicates the respective QALE benefit per 100 persons. The black vertical line shows the base-case ICER. as reported in Table 2. Costs are reported in 2018 U.S. dollars. ICER = incremental cost-effectiveness ratio; QALE = quality-adjusted life expectancy; TKR = total knee replacement.
Varying pre-TKR pain levels:
TKR recipients with higher preoperative pain experienced a greater pain improvement after TKR, e.g., in patients aged 50–65 with BMI≥40kg/m2 and preoperative WOMAC pain set to 28 (50% below the base case of 54 and no longer severe), the average post-TKR decrease in WOMAC pain score was 19 points in contrast to a 48-point decrease in those starting with pain set of 82 (50% above the base case). Costs remained approximately constant: average lifetime medical costs of the group were $247,900 with 50% less pain and $249,500 with 50% more pain. The ICERs for these two groups were $90,700/QALY and $42,800/QALY, respectively. Similar results were observed in the >65 age group, with decreasing pre-TKR pain leading to a higher $148,000/QALY ICERs, and increasing pre-TKR pain to lower $57,800/QALY ICERs.
TKR pain efficacy:
Among patients aged >65 with BMI≥40kg/m2, neither decreasing TKR effectiveness by 50% nor increasing effectiveness by 50% substantially affected lifetime medical costs ($197,500 vs. $197,600). However, increasing effectiveness 50% increased the incremental QALYs gained after TKR to 0.48 (ICER $44,600/QALY), while decreasing effectiveness 50% decreased the incremental QALYs gained to 0.34 (ICER $62,000/QALY). Similarly, among patients aged 50–65, decreasing TKR pain efficacy by 50% led to a higher $41,100/QALY ICER, while increasing TKR pain efficacy resulted in a lower ICER.
TKR late pain failure:
In patients aged >65 with BMI≥40kg/m2, increasing the probability of annual late pain failure from 0.48% to 3.0% decreased QALYs gained post-TKR to 0.31 (0.39 in the base case), but across all pain failure levels considered, ICERs never exceeded $70,000/QALY.
Complications:
ICERs remained below the $100,000/QALY WTP threshold for all patients with BMI≥40kg/m2 aged 50–65, even with a 7-fold increase in all complication probabilities ($92,700/QALY). Furthermore, ICERs remained below $71,000/QALY with a 3-fold increase in complications ($45,500/QALY for ages 50–65; $70,300/QALY for ages >65). For patients aged >65, all ICERs remained below the $100,000/QALY WTP threshold except when complication probabilities increased 7-fold (ICER = $128,800/QALY).
Probabilistic sensitivity analysis (focused on effectiveness of TKR)
Figure 3 displays cost-effectiveness acceptability curves for patients aged 50–65 and >65 with BMI≥40kg/m2, presenting the proportion of model simulations for which each strategy was cost-effective at a given WTP threshold. Across 1000 runs, QALE was 10.06 (95% CI: 9.01 – 11.11) for patients aged 50–65 with TKR, and 9.28 (95% CI: 8.23 – 10.33) for those not receiving TKR in the same age range. Corresponding costs were $247,437 (95% CI: $245,384 - $249,489) and $224,040 (95% CI: $223,836 - $224,243), respectively. For patients aged >65, QALE for cohorts with and without TKR were 6.72 (95% CI: 6.04 – 7.40) and 6.31 (95% CI: 5.63 – 7.00). Corresponding costs for this age group were $197,087 (95% CI: $196,376 - $197,799) and $176,256 (95% CI: $176,057 - $176,454). The probability that TKR is cost-effective is 90% for a WTP threshold of $55,000/QALY in patients >65 years and 100% in patients 50–65 years old.
Figure 3.
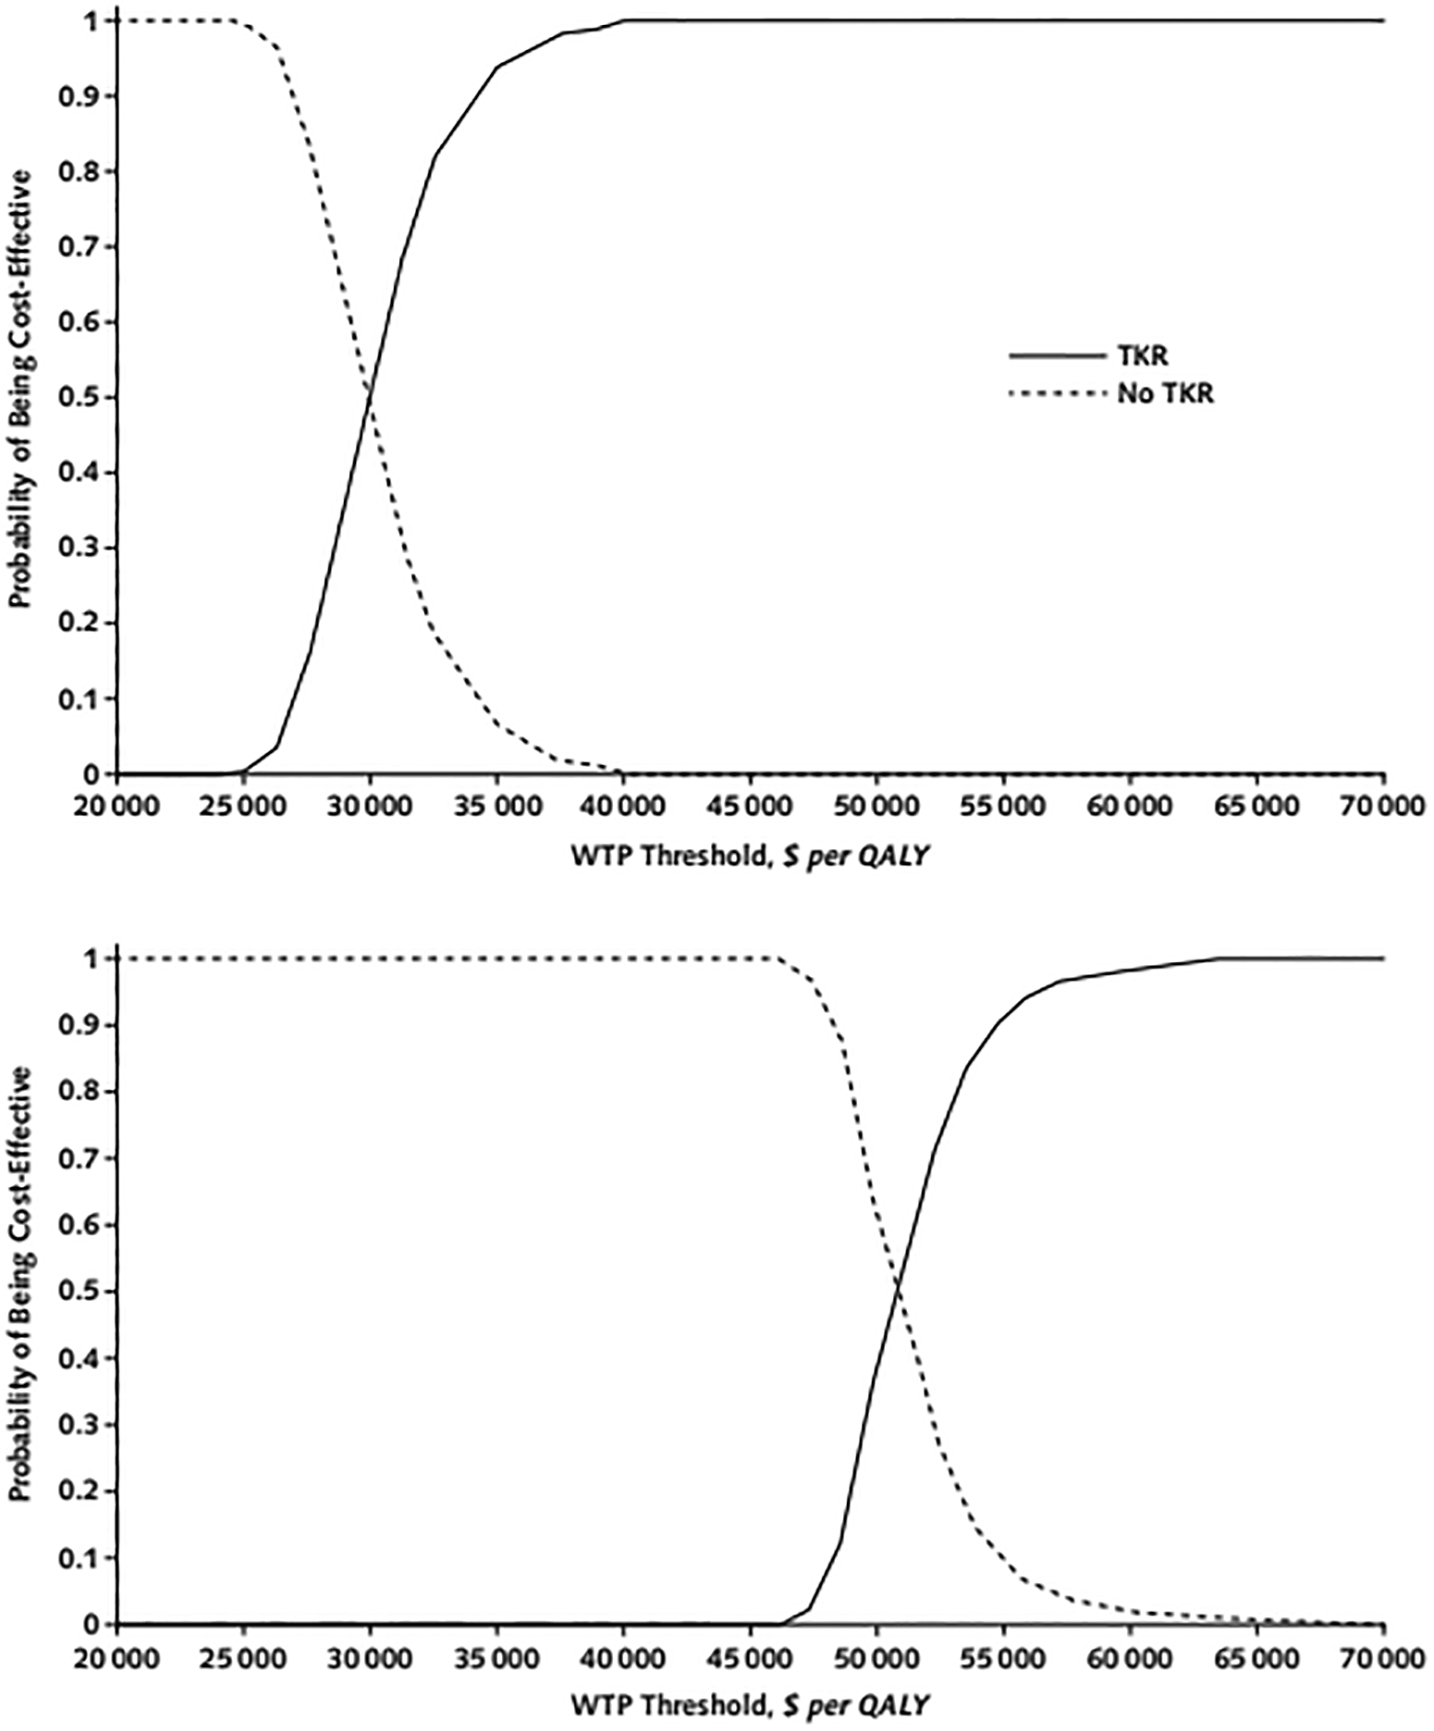
Probabilistic sensitivity analysis results for patients with a body mass index of 40 kg/m2 or greater and aged 50 to 65 years (top) or older than 65 years (bottom).
The curves show the proportion of simulations (out of 1000) for which TKR was cost-effective at a given WTP threshold. The WTP thresholds, measured in 2018 U.S. dollars per QALY, are listed along the x-axis. Each of the 1000 analyses are independently sampled model input parameters from the distributions specified in Supplement Tables 25 and 26. QALY = quality-adjusted life-year; TKR = total knee replacement; WTP = willingness-to-pay.
Discussion
We used the OAPol model to quantify the trade-offs in cost and quality of life of TKR versus no TKR for patients with BMI≥40kg/m2 across two age strata. Our base case results suggest TKR is cost-effective for patients with BMI≥40kg/m2 and aged 50–65 years for any WTP threshold greater than $35,200/QALY, and cost-effective in patients aged >65 years at all WTP values above $54,100/QALY. In higher-risk cohorts of TKR recipients with BMI≥40kg/m2 and diabetes (DM), cardiovascular disease (CVD), or both (DM+CVD), the ICERs for patients aged >65 were $63,000/QALY, $64,400/QALY, and $71,100/QALY, respectively.
In this cost-effectiveness analysis of TKR, we incorporated higher pain levels and increased complication and mortality rates in TKR recipients with BMI≥40kg/m2 to reflect the association between perioperative risk and BMI. We also varied these parameters by age. While there is no widely accepted WTP threshold, the ICER of $35,200 is substantially lower than ICERs for many generally accepted medical interventions [51, 52]. Assuming a conservative WTP threshold of $50K/QALY, even a 40% increase in TKR costs for the younger age group would lead to ICERs below $50K/QALY. TKR also offers a good value in patients with BMI≥40kg/m2 aged 65 years and older, with an ICER of $54,100/QALY. That said, fewer TKR patients with BMI≥40kg/m2 fall in the older demographic; of 585,127 primary TKR patients analyzed by Meller et al., 32,994 patients (5.64%) were older than 65 years with BMI≥40kg/m2 [31].
Our results should be interpreted in the context of certain limitations. We assumed that sex and race/ethnicity distributions did not differ across age groups and derived these data from a sample of TKR recipients >65 years of age [31]. We also assumed that patients who are considering TKR have similar demographic and clinical characteristics as those who underwent TKR but recognize that selection bias may occur in clinical practice. We derived pre- and post-TKR pain data from longitudinal cohort studies [32–34], but only 9% of patients in those studies had BMI≥40kg/m2 [53]. To address this limitation, we conducted extensive sensitivity analyses to examine the effects of uncertainty in our input parameters related to effectiveness of TKR in this population, which showed that our cost-effectiveness conclusions remained robust within the wide ranges of effectiveness input parameter variability. Additionally, despite large variability, we drew pain decrements from a normal distribution due to limited options for distribution choice in the OAPol model.
We based rates of complications on published data, which limited our ability to stratify complications rates by age. This uncertainty was examined with a sensitivity analysis; increasing complication rates three-fold for patients aged >65 yielded an ICER below $71,000/QALY. There are few estimates of TKR outcomes in patients with CVD, so we estimated complication rates for the CVD cohort using data from a paper that focused on patients with congestive heart failure [48]. We assumed no additional mortality attributable to TKR for those with CVD, DM and both CVD and DM. In the model, we account for excess mortality due to comorbidities in two ways: 1) increased risk of ‘chronic’ death due to comorbidities and 2) increased risk of major postoperative complications with accompanying risk of death. We felt that these two sources of increased mortality due to comorbidity capture additional risk of death during the 6- months post TKR not related to postoperative complications.
While we compared TKR to nonsurgical management, including intermittent pain management with analgesics, we did not examine physical activity or health modification programs, which have been shown to be efficacious in short-term studies [54]. We assumed that all patients eligible and willing to have TKR completed prior rounds of physical therapy and lifestyle modification without receiving meaningful benefits. Though TKR leads to substantial pain relief in patients with and without morbid obesity, it does not lead to appreciable weight loss or changes in physical activity levels [55]. Additional interventions focused on weight loss post-TKR could further improve the value of TKR.
We acknowledge that clinicians may have practical concerns that we did not factor into our analysis: high BMI creates additional surgical difficulty, and operating room and surgical equipment is not always designed to accommodate patients with BMI≥40kg/m2 [56]. In deciding whether to operate, patients and physicians should be fully informed and carefully weigh the potential improvements in patient’s quality of life against possible surgical risks. Patient safety concerns should take precedence over our cost-effectiveness findings, as the cost-effectiveness of a procedure does not imply reduced risk of perioperative complications.
This study has important clinical care, policy, and research implications. Currently, instead of performing TKR on patients with BMI≥40kg/m2, many surgeons recommend weight-loss interventions, such as exercise or bariatric surgery [57]. However, published data indicate that fewer than 15% of patients lose 5% or more of their body weight before TKR [58]. Additionally, bundled payment models that reward positive outcomes and efficiency may further dissuade surgeons from operating on patients with BMI≥40kg/m2 who are perceived as higher-risk cases. Our analysis suggests that withholding TKR from individuals with BMI≥40kg/m2 may not be justified from an effectiveness or a cost-effectiveness perspective. Even under unfavorable conditions (such as multiple comorbid conditions, TKR efficacy decreased by 50%, or complication probabilities increased seven-fold), the procedure remained quality-adjusted life prolonging, on average, and a cost-effective ratio that never exceeded $128,800/QALY. TKR in patients with BMI≥40kg/m2 appears to be a valuable treatment strategy.
Supplementary Material
Acknowledgments:
The authors sincerely acknowledge Ms. Aleksandra Kostic for assistance with the final rounds of analysis.
Funding Source:
This project was supported by the National Institute of Arthritis and Musculoskeletal and Skin Diseases of the National Institutes of Health grants R01 AR074290, K24 AR057827, K24 AR070892, P30 AR072571, and P30 AR072577.
Footnotes
Reproducible Research Statement:
Protocol: N/A; OAPol model overview and strategies are described in the main body of the manuscript.
Statistical Code: We encourage collaborations upon special request to Dr. Elena Losina (elosina@bwh.harvard.edu).
Data: Most of the input data used in the current analysis are reported in the main body of the manuscript or in supplementary materials.
References
- (1).King LK, March L, Anandacoomarasamy A. Obesity & osteoarthritis. Indian J Med Res. 2013;138:185–93. [PMC free article] [PubMed] [Google Scholar]
- (2).Deshpande BR, Katz JN, Solomon DH, Yelin EH, Hunter DJ, Messier SP, et al. Number of Persons With Symptomatic Knee Osteoarthritis in the US: Impact of Race and Ethnicity, Age, Sex, and Obesity. Arthritis Care Res (Hoboken). 2016;68(12):1743–50. [DOI] [PMC free article] [PubMed] [Google Scholar]
- (3).Inacio MCS, Paxton EW, Graves SE, Namba RS, Nemes S. Projected increase in total knee arthroplasty in the United States - an alternative projection model. Osteoarthritis Cartilage. 2017;25(11):1797–803. [DOI] [PubMed] [Google Scholar]
- (4).Losina E, Thornhill TS, Rome BN, Wright J, Katz JN. The dramatic increase in total knee replacement utilization rates in the United States cannot be fully explained by growth in population size and the obesity epidemic. J Bone Joint Surg Am. 2012;94(3):201–7. [DOI] [PMC free article] [PubMed] [Google Scholar]
- (5).Agency for Healthcare Research and Quality 2019. Accessed at https://hcupnet.ahrq.gov/#setup on January 4, 2021. [DOI] [PubMed]
- (6).Fehring TK, Odum SM, Griffin WL, Mason JB, McCoy TH. The obesity epidemic: its effect on total joint arthroplasty. J Arthroplasty. 2007;22(6 Suppl 2):71–6. [DOI] [PubMed] [Google Scholar]
- (7).Odum SM, Springer BD, Dennos AC, Fehring TK. National Obesity Trends in Total Knee Arthroplasty. The Journal of Arthroplasty. 2013;28(8, Supplement):148–51. [DOI] [PubMed] [Google Scholar]
- (8).Woon CYL, Piponov H, Schwartz BE, Moretti VM, Schraut NB, Shah RR, et al. Total Knee Arthroplasty in Obesity: In-Hospital Outcomes and National Trends. The Journal of Arthroplasty. 2016;31(11):2408–14. [DOI] [PubMed] [Google Scholar]
- (9).Belmont PJJ, Goodman GP, Waterman BR, Bader JO, Schoenfeld AJ. Thirty-Day Postoperative Complications and Mortality Following Total Knee Arthroplasty: Incidence and Risk Factors Among a National Sample of 15,321 Patients. JBJS. 2014;96(1):20–6. [DOI] [PubMed] [Google Scholar]
- (10).Amin AK, Clayton RA, Patton JT, Gaston M, Cook RE, Brenkel IJ. Total knee replacement in morbidly obese patients. Results of a prospective, matched study. J Bone Joint Surg Br. 2006;88(10):1321–6. [DOI] [PubMed] [Google Scholar]
- (11).Issa K, McElroy MJ, Pourtaheri S, Patel S, Jauregui J, Mont MA. Outcomes of primary total knee arthroplasty in the morbidly obese patients. J Long Term Eff Med Implants. 2013;23(4):301–7. [DOI] [PubMed] [Google Scholar]
- (12).Martin JR, Jennings JM, Dennis DA. Morbid Obesity and Total Knee Arthroplasty: A Growing Problem. J Am Acad Orthop Surg. 2017;25(3):188–94. [DOI] [PubMed] [Google Scholar]
- (13).Jarvenpaa J, Kettunen J, Kroger H, Miettinen H. Obesity may impair the early outcome of total knee arthroplasty. Scand J Surg. 2010;99(1):45–9. [DOI] [PubMed] [Google Scholar]
- (14).Obesity and Total Joint Arthroplasty: A Literature Based Review. The Journal of Arthroplasty. 2013;28(5):714–21. [DOI] [PubMed] [Google Scholar]
- (15).Li W, Ayers DC, Lewis CG, Bowen TR, Allison JJ, Franklin PD. Functional Gain and Pain Relief After Total Joint Replacement According to Obesity Status. J Bone Joint Surg Am. 2017;99(14):1183–9. [DOI] [PMC free article] [PubMed] [Google Scholar]
- (16).Turki AS, Dakhil YA, Turki AA, Ferwana MS. Total knee arthroplasty: Effect of obesity and other patients’ characteristics on operative duration and outcome. World J Orthop. 2015;6(2):284–9. [DOI] [PMC free article] [PubMed] [Google Scholar]
- (17).Dakin H, Gray A, Fitzpatrick R, Maclennan G, Murray D. Rationing of total knee replacement: a cost-effectiveness analysis on a large trial data set. BMJ Open. 2012;2(1):e000332. [DOI] [PMC free article] [PubMed] [Google Scholar]
- (18).Juni P, Reichenbach S, Dieppe P. Osteoarthritis: rational approach to treating the individual. Best Pract Res Clin Rheumatol. 2006;20(4):721–40. [DOI] [PubMed] [Google Scholar]
- (19).Kamaruzaman H, Kinghorn P, Oppong R. Cost-effectiveness of surgical interventions for the management of osteoarthritis: a systematic review of the literature. BMC Musculoskelet Disord. 2017;18(1):183. [DOI] [PMC free article] [PubMed] [Google Scholar]
- (20).Losina E, Walensky RP, Kessler CL, Emrani PS, Reichmann WM, Wright EA, et al. Cost-effectiveness of total knee arthroplasty in the United States: patient risk and hospital volume. Arch Intern Med. 2009;169(12):1113–21; discussion 21–2. [DOI] [PMC free article] [PubMed] [Google Scholar]
- (21).Waimann CA, Fernandez-Mazarambroz RJ, Cantor SB, Lopez-Olivo MA, Zhang H, Landon GC, et al. Cost-effectiveness of total knee replacement: a prospective cohort study. Arthritis Care Res (Hoboken). 2014;66(4):592–9. [DOI] [PubMed] [Google Scholar]
- (22).Ponnusamy KE, Vasarhelyi EM, Somerville L, McCalden RW, Marsh JD. Cost-Effectiveness of Total Knee Arthroplasty vs Nonoperative Management in Normal, Overweight, Obese, Severely Obese, Morbidly Obese, and Super-Obese Patients: A Markov Model. J Arthroplasty. 2018;33(7s):S32–s8. [DOI] [PubMed] [Google Scholar]
- (23).Neumann PJ, Sanders GD, Russell LB, Siegel JE, Ganiats TG. Cost-effectiveness in Health and Medicine. 2nd ed. Oxford: Oxford University Press; 2016. [Google Scholar]
- (24).Katz JN, Smith SR, Collins JE, Solomon DH, Jordan JM, Hunter DJ, et al. Cost-effectiveness of nonsteroidal anti-inflammatory drugs and opioids in the treatment of knee osteoarthritis in older patients with multiple comorbidities. Osteoarthritis Cartilage. 2016;24(3):409–18. [DOI] [PMC free article] [PubMed] [Google Scholar]
- (25).Losina E, Paltiel AD, Weinstein AM, Yelin E, Hunter DJ, Chen SP, et al. Lifetime medical costs of knee osteoarthritis management in the United States: impact of extending indications for total knee arthroplasty. Arthritis Care Res (Hoboken). 2015;67(2):203–15. [DOI] [PMC free article] [PubMed] [Google Scholar]
- (26).Smith SR, Katz JN, Collins JE, Solomon DH, Jordan JM, Suter LG, et al. Cost-Effectiveness of Tramadol and Oxycodone in the Treatment of Knee Osteoarthritis. Arthritis Care Res (Hoboken). 2017;69(2):234–42. [DOI] [PMC free article] [PubMed] [Google Scholar]
- (27).Weinstein AM, Rome BN, Reichmann WM, Collins JE, Burbine SA, Thornhill TS, et al. Estimating the burden of total knee replacement in the United States. J Bone Joint Surg Am. 2013;95(5):385–92. [DOI] [PMC free article] [PubMed] [Google Scholar]
- (28).Arias E, Heron M, Xu J United States Life Tables, 2014. National Vital Statistics Reports. 2017;66(4). [PubMed] [Google Scholar]
- (29).Di Angelantonio E, Bhupathiraju SN, Wormser D, Gao P, Kaptoge S, de Gonzalez AB, et al. Body-mass index and all-cause mortality: individual-participant-data meta-analysis of 239 prospective studies in four continents. The Lancet. 2016;388(10046):776–86. [DOI] [PMC free article] [PubMed] [Google Scholar]
- (30).NHIS: National Center for Health Statistics (NCHS). National Vital Statistics Survey 2014–2016. Centers for Disease Control and Prevention, U.S. Department of Health and Human Services. Hyattsville, MD. [Google Scholar]
- (31).Meller MM, Toossi N, Johanson NA, Gonzalez MH, Son M-S, Lau EC. Risk and Cost of 90-Day Complications in Morbidly and Superobese Patients After Total Knee Arthroplasty. The Journal of Arthroplasty. 2016;31(10):2091–8. [DOI] [PubMed] [Google Scholar]
- (32).Dave AJ, Selzer F, Losina E, Klara KM, Collins JE, Usiskin I, et al. Is there an association between whole-body pain with osteoarthritis-related knee pain, pain catastrophizing, and mental health? Clin Orthop Relat Res. 2015;473(12):3894–902. [DOI] [PMC free article] [PubMed] [Google Scholar]
- (33).Losina E, Collins JE, Daigle ME, Donnell-Fink LA, Prokopetz JJ, Strnad D, et al. The AViKA (Adding Value in Knee Arthroplasty) postoperative care navigation trial: rationale and design features. BMC Musculoskelet Disord. 2013;14:290. [DOI] [PMC free article] [PubMed] [Google Scholar]
- (34).Losina E, Collins JE, Wright J, Daigle ME, Donnell-Fink LA, Strnad D, et al. Postoperative Care Navigation for Total Knee Arthroplasty Patients: A Randomized Controlled Trial. Arthritis Care Res (Hoboken). 2016;68(9):1252–9. [DOI] [PMC free article] [PubMed] [Google Scholar]
- (35).George J, Piuzzi NS, Ng M, Sodhi N, Khlopas AA, Mont MA. Association Between Body Mass Index and Thirty-Day Complications After Total Knee Arthroplasty. J Arthroplasty. 2018;33(3):865–71. [DOI] [PubMed] [Google Scholar]
- (36).Bordini B, Stea S, Cremonini S, Viceconti M, De Palma R, Toni A. Relationship between obesity and early failure of total knee prostheses. BMC Musculoskeletal Disorders. 2009;10(1):29. [DOI] [PMC free article] [PubMed] [Google Scholar]
- (37).Paxton EW, Namba RS, Maletis GB, Khatod M, Yue EJ, Davies M, et al. A prospective study of 80,000 total joint and 5,000 anterior cruciate ligament reconstruction procedures in a community-based registry in the United States. J Bone Joint Surg Am. 2010;92 Suppl 2:117–32. [DOI] [PubMed] [Google Scholar]
- (38).Greidanus NV, Peterson RC, Masri BA, Garbuz DS. Quality of life outcomes in revision versus primary total knee arthroplasty. J Arthroplasty. 2011;26(4):615–20. [DOI] [PubMed] [Google Scholar]
- (39).Liang H, Bae JK, Park CH, Kim KI, Bae DK, Song SJ. Comparison of mode of failure between primary and revision total knee arthroplasties. Orthop Traumatol Surg Res. 2018;104(2):171–6. [DOI] [PubMed] [Google Scholar]
- (40).Kim SH. Morbid obesity and excessive hospital resource consumption for unilateral primary hip and knee arthroplasty. J Arthroplasty. 2010;25(8):1258–66. [DOI] [PubMed] [Google Scholar]
- (41).Bozic KJ, Lau E, Kurtz S, Ong K, Berry DJ. Patient-related risk factors for postoperative mortality and periprosthetic joint infection in medicare patients undergoing TKA. Clin Orthop Relat Res. 2012;470(1):130–7. [DOI] [PMC free article] [PubMed] [Google Scholar]
- (42).Centers for Medicare and Medicaid Services 2018. Accessed at https://www.cms.gov/Medicare/Medicare-Fee-for-Service-Payment/PhysicianFeeSched on January 4, 2021.
- (43).Tsai AG, Williamson DF, Glick HA. Direct medical cost of overweight and obesity in the USA: a quantitative systematic review. Obes Rev. 2011;12(1):50–61. [DOI] [PMC free article] [PubMed] [Google Scholar]
- (44).Meding JB, Reddleman K, Keating ME, Klay A, Ritter MA, Faris PM, et al. Total knee replacement in patients with diabetes mellitus. Clin Orthop Relat Res. 2003(416):208–16. [DOI] [PubMed] [Google Scholar]
- (45).Podmore B, Hutchings A, van der Meulen J, Aggarwal A, Konan S. Impact of comorbid conditions on outcomes of hip and knee replacement surgery: a systematic review and meta-analysis. BMJ Open. 2018;8(7):e021784. [DOI] [PMC free article] [PubMed] [Google Scholar]
- (46).Bozic KJ, Lau E, Ong K, Chan V, Kurtz S, Vail TP, et al. Risk factors for early revision after primary TKA in Medicare patients. Clin Orthop Relat Res. 2014;472(1):232–7. [DOI] [PMC free article] [PubMed] [Google Scholar]
- (47).Chen J, Cui Y, Li X, Miao X, Wen Z, Xue Y, et al. Risk factors for deep infection after total knee arthroplasty: a meta-analysis. Arch Orthop Trauma Surg. 2013;133(5):675–87. [DOI] [PubMed] [Google Scholar]
- (48).Curtis GL, Newman JM, George J, Klika AK, Barsoum WK, Higuera CA. Perioperative Outcomes and Complications in Patients With Heart Failure Following Total Knee Arthroplasty. J Arthroplasty. 2018;33(1):36–40. [DOI] [PubMed] [Google Scholar]
- (49).Webb ML, Golinvaux NS, Ibe IK, Bovonratwet P, Ellman MS, Grauer JN. Comparison of Perioperative Adverse Event Rates After Total Knee Arthroplasty in Patients With Diabetes: Insulin Dependence Makes a Difference. J Arthroplasty. 2017;32(10):2947–51. [DOI] [PubMed] [Google Scholar]
- (50).Briggs A, Schulpher M, Claxton K. Decision modelling for health economic evaluation. Oxford: Oxford University Press; 2006. [Google Scholar]
- (51).Howell M, Walker RC, Howard K. Cost Effectiveness of Dialysis Modalities: A Systematic Review of Economic Evaluations. Appl Health Econ Health Policy. 2019;17(3):315–30. [DOI] [PubMed] [Google Scholar]
- (52).Ian M, Michael OB, Christopher A, Chessie R, Thomas E, David WP, et al. Incremental cost-effectiveness of adult spinal deformity surgery: observed quality-adjusted life years with surgery compared with predicted quality-adjusted life years without surgery. Neurosurgical Focus. 2014;36(5):E3. [DOI] [PubMed] [Google Scholar]
- (53).Collins JE, Donnell-Fink LA, Yang HY, Usiskin IM, Lape EC, Wright J, et al. Effect of Obesity on Pain and Functional Recovery Following Total Knee Arthroplasty. J Bone Joint Surg Am. 2017;99(21):1812–8. [DOI] [PMC free article] [PubMed] [Google Scholar]
- (54).Skou ST, Roos EM, Laursen MB, Rathleff MS, Arendt-Nielsen L, Simonsen O, et al. A Randomized, Controlled Trial of Total Knee Replacement. N Engl J Med. 2015;373(17):1597–606. [DOI] [PubMed] [Google Scholar]
- (55).Dowsey M, Liew D, Stoney J, Choong P. The impact of pre-operative obesity on weight change and outcome in total knee replacement. The Journal of Bone and Joint Surgery. British volume 2010;92-B(4):513–20. [DOI] [PubMed] [Google Scholar]
- (56).Hammond KL. Practical issues in the surgical care of the obese patient. The Ochsner journal. 2013;13(2):224–7. [PMC free article] [PubMed] [Google Scholar]
- (57).Pellegrini CA, Ledford G, Hoffman SA, Chang RW, Cameron KA. Preferences and motivation for weight loss among knee replacement patients: implications for a patient-centered weight loss intervention. BMC Musculoskeletal Disorders. 2017;18(1):327. [DOI] [PMC free article] [PubMed] [Google Scholar]
- (58).Inacio MCS, Kritz-Silverstein D, Raman R, Macera CA, Nichols JF, Shaffer RA, et al. The Impact of Pre-Operative Weight Loss on Incidence of Surgical Site Infection and Readmission Rates After Total Joint Arthroplasty. The Journal of Arthroplasty. 2014;29(3):458–64.e1. [DOI] [PubMed] [Google Scholar]
- (59).Centers for Disease Control and Prevention (CDC). National Health and Nutrition Examination Survey Data. US Department of Health and Human Services. Hyattsville, MD, https://www.cdc.gov/nchs/nhanes/index.htm, 2016. [Google Scholar]
Associated Data
This section collects any data citations, data availability statements, or supplementary materials included in this article.