Abstract
Objectives:
To evaluate the test-retest reliability of three types of facial expression tasks using three-dimensional (3D) facial topography.
Materials and Methods:
Twelve adult volunteers were enrolled in this study. They were instructed to perform three different facial expression tasks: rest posture, posed smile, and maximum effort smile. Each task was recorded using a 3D image-capturing device on two separate occasions with an interval of 1 week between sessions. The images of two sessions were superimposed based on the forehead. For each participant and for each facial expression, a wire mesh fitting was conducted. This method generated 6,017 points on the wire mesh. Intraindividual reliability between sessions for each task was statistically tested by intraclass correlation coefficients (ICCs) and the 95% confidence interval minimal detectable change (MDC95).
Results:
The MDC95 for the repeated measures of the rest posture, posed smile, and maximum effort smile exhibited means of 0.8, 1.5, and 1.3 mm, respectively, on the z-axis. The ICCs ranged from substantial to almost perfect agreement for repeated measures for the rest posture and maximum effort smile (0.60 < ICC ≤ 1.00). The right corner of the mouth in the posed smile showed moderate agreement (0.40 < ICC ≤ 0.60).
Conclusions:
The overall test-retest reliability of the maximum effort smile and rest posture showed substantial to almost perfect agreement, and this was clinically acceptable.
Keywords: 3D, Smile, Intermediate precision, Maximum effort smile, Social smile
INTRODUCTION
Clinically, it is important to understand the test-retest reliability of the facial topography of a smile over multiple days because clinical diagnostics involve morphologic changes before and after treatment. After Hulsey1 first showed that the social posed smile was more repeatable than the Duchenne (present) smile, the most commonly used smile in orthodontic diagnostics has been the posed or social smile.2 The Duchenne smile is defined as lifting of the muscles at the corners of the mouth and the muscles orbiting the eyes, whereas non-Duchenne smiles, or masking smiles, are defined as lifting of only the muscles at the corners of the mouth. These terms are generally used in psychological research. The former reflects a positive effect and the latter indicates the absence of a positive effect.3 Ackerman et al.4 mentioned the variability of the posed smile in adolescents, but found that it was more stable after pubertal growth. Burstone and Melsen5 and Zachrisson,6 however, claimed that the posed smile was clinically unstable even in adults. To overcome the variability of the posed social smile, Ackerman and Ackerman7 reported a technique to capture speech and smiles using digital video clips. Another study8 reported the repeatability of the three-dimensional (3D) configurations of the face for the posed smile, with repeated measures of a 3-minute interval. This study, however, evaluated only the perioral area during the performance of social, voluntary smiles.
In general, three terms represent the validity of the measurement method: repeatability, reproducibility, and intermediate precision. For repeatability to be established, all of the following conditions must be in place: the same location, measurement procedure, observers, and measuring instruments used under the same conditions, with repetition over a short period of time, such as 3 minutes. Reproducibility refers to the degree of agreement between the results of experiments conducted under different conditions, such as by different individuals or at different locations.9 Intermediate precision refers to the degree of agreement between the results of experiments conducted by different operators at the same location with the same equipment on multiple days. To date, there is no information available regarding the intermediate precision and reproducibility of smiling performance.
A previous study10 documented that the individual maximum voluntary contraction force is highly reliable over multiple days and is used as the gold standard for normalizing electromyography data. It was hypothesized that the maximum effort smile could be used as a suitable method to examine the smile. Thus, the present study aimed to evaluate the intermediate precision of three types of facial expression tasks: rest posture, posed/social smile, and maximum effort smile using 3D facial topography with surface-based analysis.
MATERIALS AND METHODS
Twelve adult volunteers (6 men and 6 women) were selected from among Osaka University students. The inclusion criteria were as follows: age range 20–30 years; no congenital facial deformities, including cleft lip or palate; no facial paralysis; no noticeable scars or skin diseases of the neck or dentofacial regions (or history thereof); no history of any psychiatric disorder; no subjectively or objectively discernible jaw dysfunction; a body mass index ranging from 18.50 to 24.9911; overbite ranging from 1.0 to 5.0 mm; overjet ranging from 0.0 to 7.0 mm; and a straight-type soft tissue facial profile. A written informed consent form was distributed to and signed by all participants prior to involvement in the study. Institutional ethical committee approval was obtained to conduct this study (H25-E37-1).
Data Acquisition
The participants were instructed to sit on a fixed chair and maintain a natural head position without head support. They were then asked to perform the tasks stated in Table 1 (rest posture, posed smile, and maximum effort smile12). The participants were instructed vocally for each task and asked to maintain the expressions for approximately 2 seconds. After several rehearsals, each expression was recorded once with a 3D image-capturing device (3dMDcranial System, 3dMD, Atlanta, Ga). Each recording was made with a resting interval of approximately 20 seconds between each expression. The investigator operated the system from a position out of the participants' view. These measurements were repeated on two separate occasions, session 1 and session 2, with an interval of 1 week between the sessions by two different operators.
Table 1.
Definitions of the Three Facial Postures Used in the Present Study11
| Facial Posture |
Definition |
| Rest | After swallowing saliva, subjects assumed a relaxed facial posture with the lips in repose and the teeth in light contact in the habitual maximum intercuspation position. The recording was made approximately 10 seconds after saliva swallowing commenced. |
| Maximum effort smile | Grinning effort with the corners of the mouth pulled laterally and the cheeks elevated with a maximal effort and with the teeth in the habitual maximum intercuspation position. |
| Posed smile | A smile for the camera that the subjects thought felt natural, showing as many teeth as possible, keeping the upper and lower teeth together. |
Data Processing
The images of sessions 1 and 2 for each facial expression were superimposed based on the forehead (Appendix 1). For each facial expression of each participant, a wire mesh13 was fitted to each 3D facial image (Appendix 2). This method generated a point cloud, that is, a set of 6,017 data points in a 3D coordinate system (Figures 1 and 2).
Figure 1.
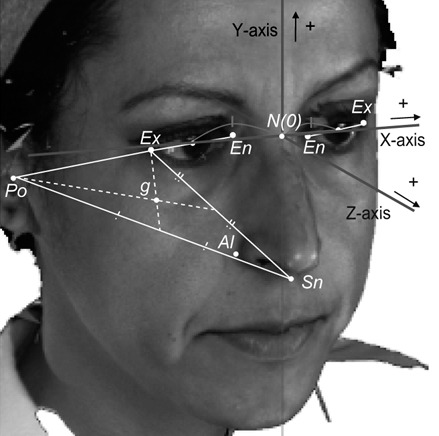
Three-dimensional coordinate system. The nasion (N) was defined as the origin (O). The sagittal plane was defined as a plane passing through the origin and perpendicular to the line through the midpoint of the right exocanthion (Ex) and endocanthion (En) and the midpoint of the left Ex and En. The axial plane was defined as a plane passing through the origin and parallel to the line connecting the porion and the geometric center (g) of porion (Po), subnasale (Sn), and Ex on the image projected onto the sagittal reference plane. The coronal plane was defined as a plane passing through the origin and perpendicular to both the axial and sagittal planes. + indicates the positive direction in each axis (Cited from Tanikawa et al.17 with permission).
Figure 2.
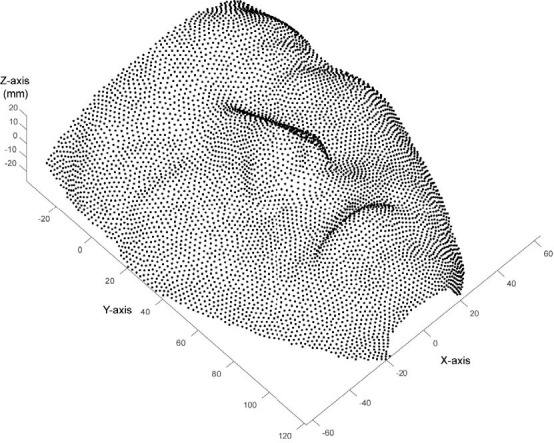
Example of the point cloud of the face.
The intermediate precision between sessions for each posture was calculated as the absolute difference of the paired points between sessions and statistically tested using an intraclass correlation coefficient (ICC). “Moderate” and “substantial” agreements were defined as 0.40 < ICC ≤ 0.60 and 0.60 < ICC ≤ 0.80, respectively, while ICC ≥ 0.81 indicated “almost perfect” agreement.14
Further, based on the Bland–Altman analysis, the 95% confidence interval minimal detectable change (MDC95) was examined.15 The MDC95 is the minimum amount of change in a measure unlikely to be due to chance variation in measurement and is interpreted in clinical studies as the minimum amount of change required to designate the change as real and beyond the bounds of measurement error.16 The MDC95 was calculated for each point using the following equations:
In equation 1, the standard error of measurements (SEM) was calculated using the following equation:
The absolute differences, ICCs, and MDC95 were presented as a color map.13,17
RESULTS
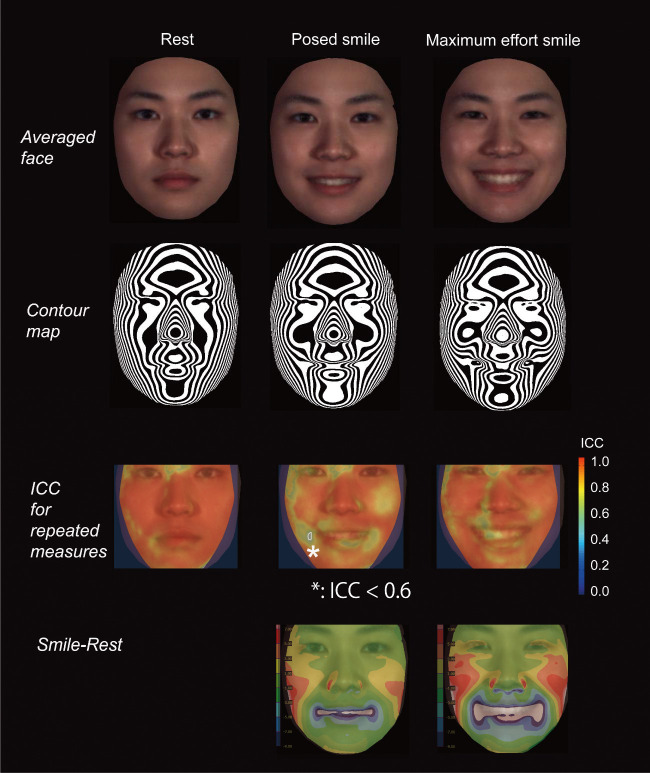
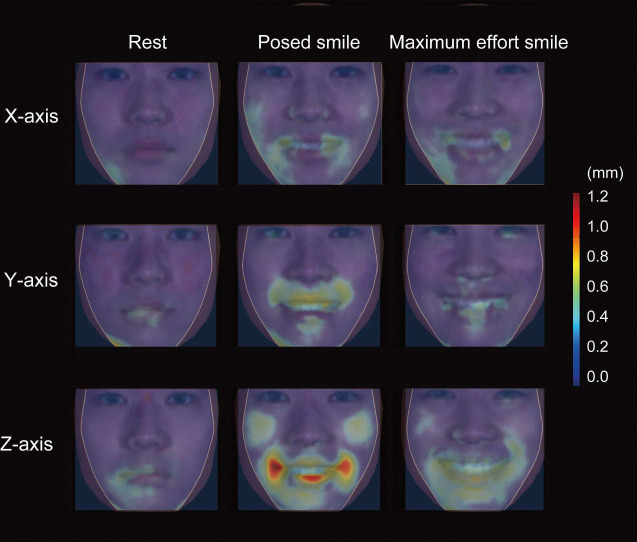
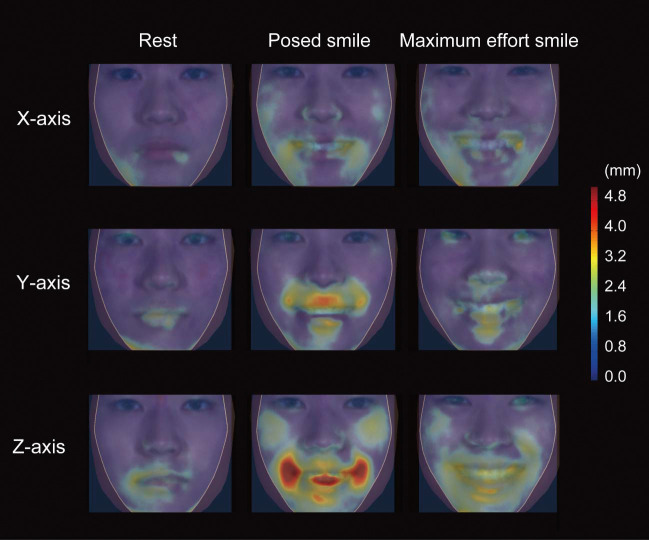
Figure 3 shows ICCs as well as the average face and contour map for each facial expression. The absolute differences and MDC95 are shown in Figures 4 and 5 and Table 2.
Figure 3.
Average faces for each facial expression (top); contour maps for each facial expression (second from the top); ICC for the repeated measures between sessions for each facial expression (second from the bottom); and distance maps between rest and each type of smile effort (bottom). In this figure, average faces were generated as the arithmetic mean of the coordinate values and the color values of each corresponding point of the point clouds. ICC indicates intraclass correlation coefficient.
Figure 4.
The absolute differences of the point clouds between sessions in the x-axis (top), y-axis (middle), and z-axis (bottom) for the rest posture (left), posed smile (middle), and maximum effort smile (right).
Figure 5.
The 95% confidence minimal detectable change (MDC95) between sessions in the x-axis (top), y-axis (middle), and z-axis (bottom) for the rest posture (left), posed smile (middle), and maximum effort smile (right).
Table 2.
Mean, SD, Minimum Value, and Maximum Value of the Absolute Differences of the Point Clouds and MDC95 Between Sessions 1 and 2 for Each Facial Posturea
| Facial Posture |
Axis |
Differences (mm) |
MDC95 (mm) |
||||||
| Mean |
SD |
Min |
Max |
Mean |
SD |
Min |
Max |
||
| Rest | X | 0.28 | 0.14 | 0.06 | 0.87 | 0.65 | 0.31 | 0.15 | 2.2 |
| Y | 0.27 | 0.16 | 0.06 | 1.59 | 0.65 | 0.37 | 0.13 | 3.04 | |
| Z | 0.35 | 0.18 | 0.03 | 1.13 | 0.84 | 0.43 | 0.05 | 2.61 | |
| Posed smile | X | 0.43 | 0.21 | 0.09 | 1.22 | 1.01 | 0.5 | 0.2 | 2.93 |
| Y | 0.43 | 0.27 | 0.09 | 1.41 | 1.05 | 0.7 | 0.23 | 3.75 | |
| Z | 0.61 | 0.4 | 0.05 | 2.61 | 1.52 | 1.08 | 0.14 | 6.86 | |
| Maximum effort smile | X | 0.40 | 0.18 | 0.08 | 1.21 | 0.98 | 0.44 | 0.21 | 3.09 |
| Y | 0.36 | 0.17 | 0.1 | 0.98 | 0.93 | 0.48 | 0.23 | 2.69 | |
| Z | 0.51 | 0.27 | 0.06 | 1.28 | 1.26 | 0.65 | 0.15 | 3.35 | |
Max indicates maximum; MDC95, 95% confidence interval minimal detectable change; Min, miminum; SD, standard deviation.
Overall, the absolute differences and MDC95 in the z-axis were greater than those in the x-axis and y-axis by approximately 0.1–0.2 mm and 0.2–0.4 mm, respectively. On the z-axis, the absolute differences for the rest posture, posed smile, and maximum effort smile were 0.4, 0.6, and 0.5 mm, respectively, while the MDC95 was 0.8, 1.5, and 1.3 mm, respectively. These results indicate that the intraindividual variation was greater in the posed smile than in the maximum effort smile. In other words, the minimal amount of change that is required to distinguish a true treatment change from a change due to variability in performance or measurement error was greatest in the posed smile at 1.5 mm, whereas that in the maximum effort smile was 1.3 mm. Further, ICCs ranged from substantial to almost perfect agreement for repeated measures for the rest posture and the maximum effort smile, and ICCs for the posed smile showed moderate agreement.
Rest Posture
The absolute differences between sessions exhibited means of 0.3 mm (x-axis and y-axis) and 0.4 mm (z-axis), respectively. The MDC95 values were approximately 0.7 mm (x-axis and y-axis) and 0.8 mm (z-axis). The maximum MDC95 value was observed at the left and right corners of the mouth with 2.6 mm in the z-axis. The mean ICC was 0.95 ± 0.05; the ICC ranged from substantial to almost perfect agreement for repeated measures of the maximum effort smile (ICC = 0.60–1.00).
Posed Smile
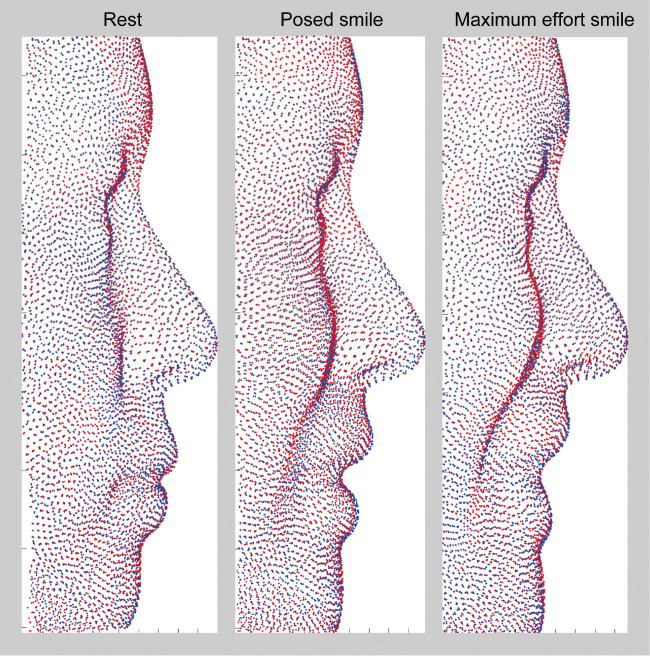
The absolute differences between sessions exhibited means of 0.4 mm (x-axis and y-axis) and 0.6 mm (z-axis), respectively. The MDC95 values exhibited means of approximately 1.0 mm (x-axis and y-axis) and 1.5 mm (z-axis), respectively. The maximum MDC95 value was observed in the right corner of the mouth in the transverse direction (x-axis, 2.9 mm) and anteroposterior direction (z-axis, 6.9 mm), and in the upper lip in the vertical direction (y-axis, 3.8 mm), indicating that upward movement of the upper lip and posterior movement of the right corner of the mouth during posed smiling showed greater variation (Figure 6). The mean ICC was 0.88 ± 0.08, and the right corner of the mouth in the posed smile showed moderate agreement (ICC = 0.41–0.60).
Figure 6.
Three-dimensional representations of the point clouds of average human faces (right lateral views) for the rest posture (left), posed smile (middle), and maximum effort smile (right). For comparisons between the two experimental sessions, session 1 is indicated by red dots and session 2 by blue dots.
Maximum Effort Smile
The absolute differences between sessions exhibited means of approximately 0.4 mm (x-axis and y-axis), and 0.5 mm (z-axis), respectively. The MDC95 for the maximum effort smile exhibited means of approximately 1.0 mm (x-axis and y-axis) and 1.3 mm (z-axis), respectively. The mean ICC was 0.91 ± 0.07, and the ICC ranged from very good to near-perfect agreement for repeated measures of the maximum effort smile (ICC = 0.60–1.00).
DISCUSSION
The present study determined the intermediate precision, measured by intervals of 1 week, of the 3D morphology of human faces during rest posture, posed smiling, and maximum effort smiling. The results demonstrated that the rest posture showed the best intermediate precision, followed by the maximum effort smile and the posed smile, when the overall face, including the malar area, was considered. Further, it was found that the MDC95 of the rest posture was 0.7, 0.7, and 0.8 mm on the x-axis, y-axis, and z-axis, respectively; that of the posed smile was 1.0, 1.0, and 1.5 mm on the x-axis, y-axis, and z-axis, respectively; and that of the maximum effort smile was 1.0, 1.0, and 1.3 mm on the x-axis, y-axis, and z-axis, respectively. Overall, the changes in the anteroposterior direction (z-axis) were unstable compared with the vertical (y-axis) or transverse (x-axis) directions. A previous study8 measured the repeatability of the short intervals for the posed smile and showed that the mean lowest limit was 0.96 ± 0.21 mm when the deviation limits were evaluated together within the same individual. This value was slightly smaller than the current results for the posed smile. It is speculated that the observed difference between the two studies is because of the ease of recalling over shorter intervals, such as 3 minutes, than over longer intervals, such as 1 week.
Areas Showing Lower Intermediate Precision
In the present study, the right corner of the mouth in posed smiles showed lower intermediate precision, such as asymmetric results, when considering the ICC, whereas the maximum effort smile showed symmetric results for precision. This result was supported by a previous study,12 which documented that displacements of the right and left corners of the mouth during the posed smile were asymmetric, whereas the maximal lip corner retraction did not show a significant difference. The authors suggested that the observed difference could be explained by a possible difference in neuronal controls between posed smiles. Facial movements are regulated by the cerebral cortex. Each side of the face is controlled by the brain hemisphere on the contralateral side.18 Displacements of the corners of the mouth during voluntary (posed) smiling are known to receive greater muscular control on the left side relative to the right.19 It is speculated that the greater variability on the right side of the mouth in the present study might be related to a lesser muscular control by the cerebral cortex on the right side. Indeed, previous studies found that the upper face is neurobiologically less voluntarily controlled than the lower face,20 and the lack of cortical control produces largely asymmetrical voluntary expressions in the lower face.21 As such, it can be said that the posed smile is assumed to be a conditioned voluntary smile that reflects brain neuronal control to simulate the imaginary natural smile, whereas the maximal lip corner retraction simulates the border retracting movements of the lip corners upon maximum voluntary effort, which reflects muscle capability and mobility.
Clinical Significance of 3D Facial Forms During Smiling
In the present study, 3D facial morphology was used to analyze the smile. A conventional smile analysis includes an esthetic evaluation of the lip–teeth relationships present in the smile. Clinicians have analyzed smile photos or videos with several variables, such as buccal corridors and smile arc.7,22 Having minimal buccal corridors is considered to be a preferred esthetic feature.23 The smile arc is defined as the relationship of the curvature of the incisal edges of the maxillary incisors to the curvature of the lower lip in the posed smile and consonant.7 There seems to be little doubt that the conventional smile analysis described here is clinically significant to achieve improved esthetics. However, recent 3D research24–26 suggested the clinical significance of 3D facial configurations. For example, 3D facial changes after a Wassmund osteotomy24 or bilateral sagittal split osteotomy25 demonstrated an increase in malar projection at rest and while smiling in concert with improvement of soft tissue descent.24–26 In the same way, it is assumed that the movement of the lip can be changed after orthodontic treatment. Thus, evaluating the soft tissue configuration of the face both at rest and during a facial expression is essential to achieve the correct diagnosis in combined surgical orthodontics. However, little is known regarding 3D facial morphologies during smiling facial characteristics or regarding 3D smile analysis. The present study evaluated the intermediate precision of three types of facial expression using 3D facial topography and provided baseline information for the 3D facial morphology during various facial expressions, which may be considered crucial for accurate orthodontic diagnosis.
In summary, in conventional smile analysis, the focus is on the esthetic evaluation between the incisor show and lip morphology during social smiles. If clinicians focus on the capability and mobility of lip movement, the maximum effort smile can be used as one of the possible tested facial expressions for the morphologic analysis of the face. When considering the intermediate precision, both the social posed smile and the maximum effort smile are clinically acceptable, but the maximum effort smile provided better intermediate precision. This suggests that the maximum effort smile would be more reliable in estimating the capability of lip movement and effects of interventions such as orthodontic treatment.
Limitations
The current study had several limitations. First, the sample size for analysis was relatively small; therefore, it is possible that the results would have differed with a larger sample. Second, the sample population had limited variation in age (20–30 years) and ethnicity (Japanese). Further studies with various facial types will be needed to clarify this initial result.
CONCLUSIONS
The MDC95 of the repeated measures for the rest posture, posed smile, and maximum effort smile were 0.8, 1.5, and 1.3 mm, respectively, on the z-axis.
The ICC ranged from substantial to almost perfect agreement for repeated measures for the rest posture and maximum effort smile.
The maximum effort smile provided better test-retest reliability compared with the posed/social smile. The maximum effort smile can be applied clinically to estimate the capability of lip movement.
ACKNOWLEDGMENTS
This work was partially supported by JSPS KAKENHI (grant nos. 22792048 and 25862008).
Appendix 1
Superimposition of the Two Session Images for Each Facial Expression
Standardization of the facial image at the peak of posed smiling with the iterative closest point algorithm. Given two three-dimensional point sets, Prest and Psmile, the task is to find the Euclidean motion that brings Psmile into the best possible alignment with Prest. The iterative closest point algorithm consists of three basic steps:
Pair each point of Psmile to the closest point in Prest.
Compute the motion that minimizes the mean square error (MSE) between the paired points,
Apply the motion to Psmile and update the MSE.
The three steps are iterated; the iterations have been proven to converge in terms of the MSE.
The three steps were continued by the mean differences of the forehead (the points above the soft-tissue glabella) in session 1 and session 2, which were less than 0.5 mm.
As a result, the intraclass correlation (ICC) of the forehead showed almost perfect agreement for repeated measures of the forehead in the three types of facial expression (ICC = 0.81–1.00).
Appendix 2
Details of the Wire Mesh Fitting and Their Intraobserver Reliability
For each facial model, fitting of high-resolution template meshes13 was performed using HBM-Rugle (Medical Engineering Inc, Kyoto, Japan) based on the landmarks assigned to each three-dimensional (3D) image. This method automatically generated a homogeneous model consisting of 6,017 points (ie, nodes of the fitted mesh) on the wire mesh for each model. This technique permits the extraction of relevant surface anatomy from 3D facial data, while removing or smoothing out nonrelevant data, yielding high-resolution 3D surface data that provide enough detail to facilitate a quantitative assessment while maintaining small data files that are easily manipulated and portable to a range of visualization technologies.13 Thus, it is considered that the reliability of the wire mesh fitting was entirely a consequence of the identification of landmarks.
The intraobserver reliability of these landmarks was confirmed in a previous study.17 Briefly, to determine the intraobserver reliability of landmark identification, The 3D facial images of 15 participants were randomly selected from the subjects of the previous study,17 and the coordinate values of the landmarks (nasion, exocanthion, endocanthion, palpebrale superius, palpebrale inferius, porion, orbitale, pronasale, alar curvature, subnasale, labiale superius, stomion, cheilion, labiale inferius, submentale, pogonion) were determined. The digitization process was then repeated a week later, and the two sets of results were compared using a paired t-test and correlations. The investigation of intraobserver reliability showed a mean absolute difference of 0.13 mm (range, 0.00 mm [pronasale] to 0.52 mm [pogonion]; P > .01) and 0.04 mm (range, 0.00 mm [pronasale] to 0.17 mm [submentale]; P > .01) for the two examiners, respectively. The correlations between the two sets of results ranged from 0.97 to 1.00 (P < .01), across the landmarks.
REFERENCES
- 1.Hulsey CM. An esthetic evaluation of lip-teeth relationships present in the smile. Am J Orthod. 1970;57:132–144. doi: 10.1016/0002-9416(70)90260-5. [DOI] [PubMed] [Google Scholar]
- 2.Duchenne de Bologne B. The mechanism of human facial expression. Cambridge, United Kingdom: Cambridge University Press; 1990. [Google Scholar]
- 3.Ekman P, Friesen WV. Felt, false, and miserable smiles. J Nonverbal Behav. 1982;6:238–252. [Google Scholar]
- 4.Ackerman JL, Ackerman MB, Brensinger CM, Landis JR. A morphometric analysis of the posed smile. Clin Orthod Res. 1998;1:2–11. doi: 10.1111/ocr.1998.1.1.2. [DOI] [PubMed] [Google Scholar]
- 5.Burstone CJ, Melsen B. Introduction to Biomechanics. Aarhus, Denmark: Syllabus;; 1989. [Google Scholar]
- 6.Zachrisson BU. Esthetic factors involved in anterior tooth display and the smile: vertical dimension. J Clin Orthod. 1998;32:432–445. [Google Scholar]
- 7.Ackerman MB, Ackerman J. Smile analysis and design in the digital era. J Clin Orthod. 2002;36:221–236. [PubMed] [Google Scholar]
- 8.Dindaroğlu F, Duran GS, Görgülü S, Yetkiner E. Social smile reproducibility using 3-D stereophotogrammetry and reverse engineering technology. Angle Orthod. 2016;86:448–455. doi: 10.2319/040915-236.1. [DOI] [PMC free article] [PubMed] [Google Scholar]
- 9.Lau A. DataPoints. American Society for Testing and Materials International; 2009. What Are repeatability and reproducibility? Part 1: A D02 Viewpoint for Laboratories. March/April. Available at: https://www.astm.org/SNEWS/MA_2009/datapoints_ma09.html Accessed January12, 2017. [Google Scholar]
- 10.Anders C, Bretschneider S, Bernsdorf A, Schneider W. Activation characteristics of shoulder muscles during maximal and submaximal efforts. Eur J Appl Physiol. 2005;93:540–546. doi: 10.1007/s00421-004-1260-9. [DOI] [PubMed] [Google Scholar]
- 11.World Health Organization. BMI classification. Available from: http://apps.who.int/bmi/index.jsp?introPage=intro_3.html Accessed June 2, 2018.
- 12.Okamoto H, Haraguchi S, Takada K. Laterality of asymmetry in movements of the corners of the mouth during voluntary smile. Angle Orthod. 2010;80:223–229. doi: 10.2319/021809-104.1. [DOI] [PMC free article] [PubMed] [Google Scholar]
- 13.Kono K, Tanikawa C, Yanagita T, Kamioka H, Yamashiro T. A novel method to detect 3D mandibular changes related to soft-diet feeding. Front Physiol. 2017;8:567. doi: 10.3389/fphys.2017.00567. [DOI] [PMC free article] [PubMed] [Google Scholar]
- 14.Landis JR, Koch GG. The measurement of observer agreement for categorical data. Biometrics. 1977;33:159–174. [PubMed] [Google Scholar]
- 15.Bland JM, Altman DG. Statistical method for assessing agreement between two methods of clinical measurement. Lancet. 1986;1(8476):307–310. [PubMed] [Google Scholar]
- 16.Haley SM, Fragala-Pinkham MA. Interpreting change scores of tests and measures used in physical therapy. Phys Ther. 2006;86:735–743. [PubMed] [Google Scholar]
- 17.Tanikawa C, Zere E, Takada K. Sexual dimorphism in the facial morphology of adult humans: a three-dimensional analysis. Homo. 2016;67:23–49. doi: 10.1016/j.jchb.2015.10.001. [DOI] [PubMed] [Google Scholar]
- 18.Morecraft RJ, Louie JL, Herrick JL, Stilwell-Morecraft KS. Cortical innervation of the facial nucleus in the non-human primate: a new interpretation of the effects of stroke and related subtotal brain trauma on the muscles of facial expression. Brain. 2001;124:176–208. doi: 10.1093/brain/124.1.176. [DOI] [PubMed] [Google Scholar]
- 19.Borod JC, Haywood CS, Koff E. Neuropsychological aspects of facial asymmetry during emotional expression: a review of the normal adult literature. Neuropsychol Rev. 1997;7:41–60. doi: 10.1007/BF02876972. [DOI] [PubMed] [Google Scholar]
- 20.Rinn WE. The neuropsychology of facial expression: a review of the neurological and psychological mechanisms for producing facial expressions. Psychol Bull. 1984;95:52–77. [PubMed] [Google Scholar]
- 21.Schmidt KL, Cohn JF. Human facial expressions as adaptations: evolutionary questions in facial expression research. Am J Phys Anthropol. 2001;33(suppl):3–24. doi: 10.1002/ajpa.2001. [DOI] [PMC free article] [PubMed] [Google Scholar]
- 22.Parekh SM, Fields HW, Beck M, Rosenstiel S. Attractiveness of variations in the smile arc and buccal corridor space as judged by orthodontists and laymen. Angle Orthod. 2006;76:557–563. doi: 10.1043/0003-3219(2006)076[0557:AOVITS]2.0.CO;2. [DOI] [PubMed] [Google Scholar]
- 23.Martin AJ, Buschang PH, Boley JC, Taylor RW, McKinney TW. The impact of buccal corridors on smile attractiveness. Eur J Orthod. 2007;29:530–537. doi: 10.1093/ejo/cjm063. [DOI] [PubMed] [Google Scholar]
- 24.Yamamoto Y, Tanikawa C, Takada K. Wassmund osteotomy for excessive gingival display: a case report with three-dimensional facial evaluation. Aust Orthod J. 2014;30:81–88. [PubMed] [Google Scholar]
- 25.Kim M, Lee DY, Lim YK, Baek SH. Three-dimensional evaluation of soft tissue changes after mandibular setback surgery in class III malocclusion patients according to extent of mandibular setback, vertical skeletal pattern, and genioplasty. Oral Surg Oral Med Oral Pathol Oral Radiol Endod. 2010;109:e20–32. doi: 10.1016/j.tripleo.2010.01.002. [DOI] [PubMed] [Google Scholar]
- 26.Frey TS. New diagnostic tenet of the esthetic midface for clinical assessment of anterior malar projection. Angle Orthod. 2013;83:790–794. doi: 10.2319/111612-881.1. [DOI] [PMC free article] [PubMed] [Google Scholar]


