

Abstract
The anti-greenhouse gas dimethylsulfide (DMS) is mainly emitted by algae and accounts for more than half of the total natural flux of gaseous sulfur to the atmosphere, strongly reducing the solar radiation and thereby the temperature on Earth. However, the relationship between phytoplankton biomass and DMS emissions is debated and inconclusive. Our study presents field observations from 100 freshwater lakes, in concert with data of global ocean DMS emissions, showing that DMS and algal biomass show a hump-shaped relationship, i.e. DMS emissions to the atmosphere increase up to a pH of about 8.1 but, at higher pH, DMS concentrations decline, likely mainly due to decomposition. Our findings from lake and ocean ecosystems worldwide were corroborated in experimental studies. This novel finding allows assessments of more accurate global patterns of DMS emissions and advances our knowledge on the negative feedback regulation of phytoplankton-driven DMS emissions on climate.
Keywords: phytoplankton, lake ecosystem, biological regulation of global climate, dimethylsulfide, global surface oceans
INTRODUCTION
Dimethylsulfide (DMS) and its precursor, Dimethylsulphoniopropionate (DMSP), are majorly produced by algae [1–3] and also by a few species of intertidal plants [4], bacteria [5], cnidarians [6] and macro-invertebrates [7]. This biogenic-driven emission of DMS accounts for more than half of the total natural flux of sulfur to the atmosphere [8–10] and can be oxidized to large amounts of cloud-condensation nuclei, thereby causing reflection of sunlight (albedo), which in turn contributes to temperature reduction on Earth. This algal regulation of the climate is referred to as the ‘CLAW’ hypothesis [1]. Since this hypothesis was proposed, the role of DMS as an anti-greenhouse gas has become an important issue in the context of global warming [8,11,12]. Besides its anti-climate warming effects, DMS, or rather its precursor DMSP, serves as antioxidant and osmolyte in algal cells [3] and is also an important infochemical affecting trophic dynamics by attracting predators, such as seabirds, feeding on, for example, herbivorous crustaceans, thereby reducing the grazing pressure on phytoplankton [13]. Moreover, it is also an important source of carbon and sulfur to marine bacterioplankton [14,15] and may aid fish larva in locating their settlement habitat [16], thereby playing multiple fundamental roles in aquatic ecosystems.
In recent years, this hypothesis has been debated based on, for example, meteorological evidence [11,17]. In addition, the algal-driven emission of DMS has been estimated to range between 29 and 39 Tg S yr−1 [8–10], however, the relationship between DMS concentrations and algal biomass from field data has shown to be inconsistent or even controversial. For example, the relationship has been reported as unclear [1], contradictory [17], positive [18–20], negative [21,22], as well as absent [23] (Supplementary Fig. 1). Such uncertain relationships affect the calculation of DMS flux based on the algal biomass. In most models, the fluxes of DMS are obtained from small- or medium-scale field observations [24,25], jeopardizing our understanding of the mechanisms controlling DMS emissions, and is thus making it difficult to accurately predict future effects of DMS on climate change and the global sulfur cycle [17].
The production and decomposition rates of DMS are critical to its concentrations in natural waters. DMS production from phytoplankton is affected by a variety of eco-physiological processes [8,26–28], such as ocean acidification [8,28,29], bacterial taxa and its decomposition pathway (lyase pathway or demethylation pathway of DMSP) [15,26,27], nitrogen-to-phosphorous ratio and nitrogen limitation [30,31], zooplankton grazing on phytoplankton [13] and also by the phytoplankton community composition [32]. It has been estimated that ∼90% of the DMS production is degraded through microbial decomposition [33,34]. Together with the degradation of photochemical oxidation [35,36], the DMS amount emitted from surface oceans to the atmosphere is <10% of the DMS production by phytoplankton in the ocean. Together, this indicates that the relationship between DMS concentration and phytoplankton is complex.
Therefore, in order to disentangle the contradiction between DMS concentrations and phytoplankton in previous studies, we have here conducted a field study using 100 shallow freshwater lakes (Supplementary Fig. 2) where we quantified DMS concentrations, phytoplankton biomass (Chlorophyll-a, Chl-a) and various environmental parameters, such as pH, transparency, dissolved oxygen, conductivity and so on. We also collected data of DMS and Chl-a simultaneously from a global sea-surface DMS database [37] (Supplementary Fig. 3), covering a wide range of phytoplankton biomasses in both oceans and freshwaters. We found a hump-shaped relationship between DMS and algal biomass due to intensive DMS degradation when the pH exceeded 8.1 (induced by active algal photosynthesis), which was furthermore validated by a series of laboratory experiments.
RESULTS
Global-scale relationships between DMS concentrations, phytoplankton and pH
We found a significant regression between log-transformed Chl-a and DMS concentrations in the 100 sampling lakes, with a breakpoint at Chl-a = 5.04 ± 0.45 mg m−3 (Fig. 1a). A similar segmented regression was also found in oceans, with a breakpoint at Chl-a = 4.91 ± 0.66 mg m−3 (Fig. 1b).
Figure 1.
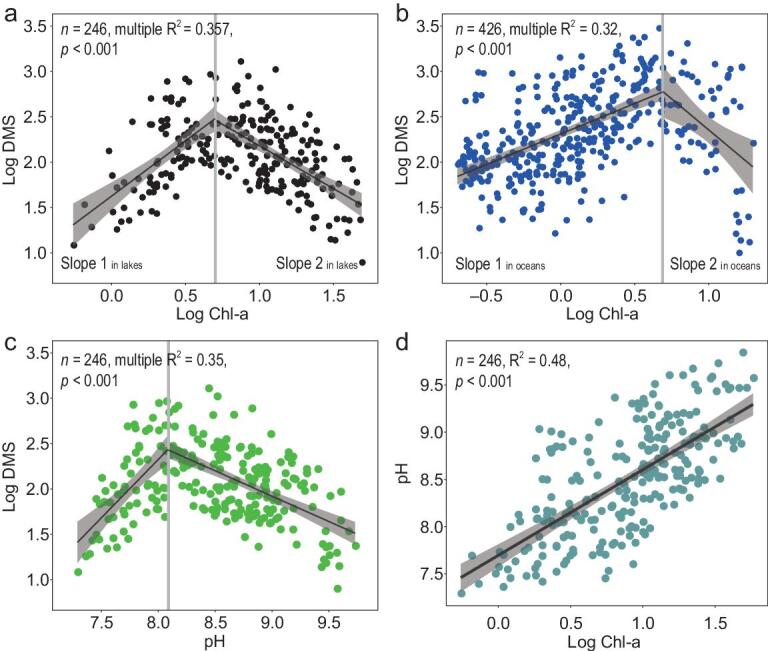
Quantitative relationships between DMS, Chl-a and pH in the 100 lakes in the eastern plain of China and the global surface oceans. (a) Relationships between LogChl-a and LogDMS in the 100 lakes, with a breakpoint of DMS at Chl-a = 5.04 ± 0.45 mg m−3, slope 1 in lakes = 1.22 and slope 2 in lakes = –1.00. (b) Relationships between LogChl-a and LogDMS in ocean surface water, with a breakpoint of DMS at Chl-a = 4.91 ± 0.66 mg m−3, slope 1 in ocean = 0.62 and slope 2 in ocean = –1.11. (c) Relationships between pH and LogDMS in the 100 lakes, with a breakpoint of DMS at pH = 8.09 ± 0.05. (d) Relationships between LogChl-a and pH in the 100 lakes.
Based on previous studies [1,19,24,25], we expected a positive linear relationship between DMS and Chl-a [1,17,38], but this hypothesis was inconsistent with our field observations (Fig. 1a and b). Similarly, previous studies have shown that ocean-surface-water DMS concentrations are positively correlated with Chl-a at levels <3.5 mg m−3 [18,19], whereas others have reported a negative correlation at Chl-a levels >6.0 mg m−3 [21]. Hence, no previous study has covered a sufficient range of algal biomasses to draw an accurate conclusion [22,23]. Our study, allowing for novel conclusions, included Chl-a concentrations from 0.55 to 58.0 mg m−3 in lakes and from 0.055 to 39.08 mg m−3 in global surface oceans (Fig. 1a and b), representing a considerable range in Chl-a across surface waters worldwide [39]. Moreover, we can, for the first time, demonstrate the strikingly similar relationships between DMS and Chl-a in both fresh and ocean waters (Fig. 1a and b), suggesting a solid and global relationship between DMS and Chl-a in aquatic environments. However, the initial increasing slope of the regression between Chl-a and DMS in freshwaters was about twice as steep as in oceans (1.22 and 0.62, respectively; Fig. 1a and b), suggesting that DMS concentration increases faster in lakes than in oceans before reaching the pH breakpoint. This indicates that DMS production per unit Chl-a was higher in lakes than in oceans, which is seemingly contrary to the average DMS concentrations in the lakes and global oceans (175 and 379 ng L−1, calculated from Supplementary Tables 1 and 2, respectively). However, the intercept of DMS was higher in oceans than in lakes, indicating that there may be more sources of DMS at low Chl-a concentration in marine than in freshwater environments.
In our study lakes, a strong relationship was found also between DMS concentrations and pH, with a breakpoint at pH = 8.09 ± 0.05 (Fig. 1c). Similarly, there was a strong positive relationship between pH and Chl-a (Fig. 1d). Since the global sea-surface DMS database lacks pH data [37], we were unable to examine the relationship between pH, DMS and Chl-a in oceans. However, it is well known that, since algal photosynthesis increases pH, there is a positive relationship between pH and Chl-a also in oceans [40]. Hence, in accordance with our findings in freshwaters, some previous ocean studies report a positive correlation between pH and DMS, showing peak DMS concentrations at a pH of ∼8.1 [8,28,41] (Supplementary Fig. 4). This strongly suggests a similar relationship between DMS and pH in oceans as in freshwaters.
DMS decomposition at increased pH
Our observations from both lakes and oceans suggest that phytoplankton biomass and DMS emission initially increase with pH, but that DMS release shows a tipping point at a pH of ∼8.1. To experimentally test whether higher pH will lead to those general results from natural environments, pure DMS standard solution was diluted to a concentration of 100 ng L−1 with eight different pH levels ranging from 7 to 10.5 in the laboratory. Accordingly, we found that DMS concentrations decreased when pH increased to >8.0 (Fig. 2a) and that the decay rate of DMS was rapid during the first 5 hours in alkaline solutions and then slowed down, with a reduction of ∼30% after 24 hours (Fig. 2b). Hence, the mechanistic laboratory test corroborates the field data by showing that DMS is decomposed or converted into other compounds in alkaline waters, with a threshold pH at ∼8.0, where DMS decomposition accelerates considerably.
Figure 2.
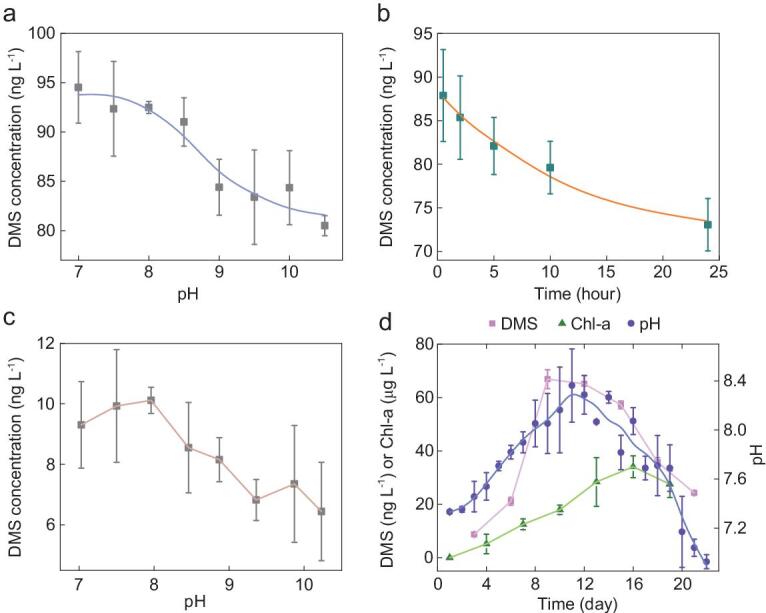
The changes in DMS concentrations in different alkaline solutions over time and in different algal cultures. (a) Changes in DMS with an initial concentration at 100 ng L−1 at eight different levels of pH solutions within 0.5 hours. (b) Continuous-integration changes in DMS with an initial concentration of 100 ng L−1 in 8 different pH solutions at 0.5, 2, 5, 10 and 24 hours. (c) The productions of DMS at eight different pH solutions (pH = 7, 7.5, 7.96, 8.46, 8.87, 9.36, 9.87 and 10.23) with similar algal biomass (Phormidium foveolarum, 1.032 × 10⁶ cells L−1) for 2 days. (d) The changes in DMS, Chl-a and pH in the verification test of Emiliania huxleyi over 22 days with axenic f/2 Medium solution.
DMS production by algae at different pH
We performed further verification tests in order to explore the relationships between algae, DMS production and pH using cultured algae. In the first experiment, an axenic freshwater alga, Phormidium foveolarum, was cultured with controlled biomass at different pH levels. DMS concentrations increased from 9.31 to 10.12 ng L−1 in the algal culture when pH increased from 7.0 to 8.0, but then decreased to 6.44 ng L−1 as pH increased further from 8.0 to 10.25 (a 36.4% decrease) (Fig. 2c). Hence, this assessment of the relationship between DMS and pH was also consistent with our field observations (Fig. 1a and b).
Moreover, in an axenic culture of the marine alga Emiliania huxleyi, which was cultured for 22 days, we found similar trends of DMS, Chl-a and pH with a breakpoint in DMS emission at pH = 8.06 (Fig. 2d), further strengthening the global and continental relationships identified in lakes and oceans (Fig. 1a and b).
Global patterns in annual mean DMS concentration in oceans
Based on the relationship between DMS and Chl-a (Supplementary Fig. 5), we depicted the spatial pattern of DMS concentration in the global oceans by using 14-year (2003–16) averaged monthly composites of MODIS Chl-a data [42]. The results showed high-level DMS concentration (7–10 nM L−1) in coastal regions and it decreased to 1.6–1.7 nM L−1 in the open oceans (Fig. 3). Accordingly, an average sea-surface DMS concentration was estimated to be 1.92 nM L−1, falling into the range of previous studies [19,43–46] (Supplementary Table 3). Generally, DMS concentrations were higher in the coastal regions than in the open oceans. Concentrations were also high at northern high latitudes, with a decreasing trend towards the equatorial and subequatorial oceans.
Figure 3.

Global pattern of annual mean DMS concentrations (nM L−1) in surface oceans based on the relationship between DMS and Chl-a in Supplementary Fig. 5 and the average MODIS Chl-a concentration from 2003 to 2016. The DMS concentrations were high in the coastal regions (7–10 nM L−1) but low in open oceans (1.6–1.7 nM L−1).
DISCUSSION
In the present study, the global pattern shows an increase in DMS concentration as phytoplankton production increases up to a pH of ∼8.1, but a decline when algal photosynthesis increases further. Undoubtedly, pH contributes greatly to the decline in DMS concentration as pH exceeds 8.1, although other environmental factors may also be involved in the decomposition of DMS. For example, as a reductive compound, DMS can be oxidized by microbes [33,34], metal ions, UV irradiation and photosensitizers [36]. Moreover, it was unclear in previous studies whether a high pH decreased DMS yields of the producers or not. In the present study, we observed DMS reductions of 30% and 36.4%, respectively, in pH-controlled solutions (Fig. 2b) and in pH-controlled freshwater algal cultures(Fig. 2c), suggesting that the reduction in DMS at a pH >8.1 was mainly caused by pH decomposition, but also due partly to lower DMS production by producers at the higher pH. Thus, our study first describes a hump-shaped relationship between DMS and phytoplankton in freshwater lakes, and then identifies a quite similar pattern in oceans, and the relationship is mainly formed by algal photosynthesis-driven DMS degradation at pH value >8.1.
Based on the hump-shaped relationship (Supplementary Fig. 5) and remote sensing data [42], the spatial pattern of global DMS was roughly similar to previous results, based either on spatial interpolation of DMS-concentration data (n = 47 000) in the global sea-surface DMS database [37] or on empirical relationships with Chl-a concentrations [43]. However, we corrected DMS concentrations at high algal biomass (Supplementary Fig. 5) and our results (estimated to be 1.92 nM L−1) rank in the middle of previous estimates (1.5–2.5 nM L−1) (Supplementary Table 3). Thus, the global pattern of DMS concentrations provided here is likely more precise than in previous studies [19,43–46].
In a broader context, our results suggest that, at higher pH, DMS is broken down, leading to a reduced DMS concentration in natural waters. In high productive waters, e.g. mainly in freshwaters and coastal areas of the oceans, high photosynthesis rates may elevate the pH far above 8.1, thus leading to a decline in DMS through pH-driven degradation (Fig. 1). Similarly, our results show that the DMS concentrations would also decrease with a decline in pH from 8.1 to 7 (Figs 1 and 2). Our results (Figs 1 and 2), together with the facts that oceans are facing anthropogenically induced acidification and that the acidity in polar oceans is changing at more than twice the global average [8,47], suggest that average DMS concentrations in the global oceans, particularly at the poles, will likely decline. Hence, further studies are needed to assess the DMS emissions from global surface oceans in the context of ocean acidification.
In addition to enhanced degradation of DMS at high pH, pH changes may also affect phytoplankton that produce DMSP, thereby altering DMS production. A few experimental studies addressing this issue have been performed, although the results are not consistent. For example, when pH declined from 8.3 to 7.49, the algal DMS production declined by ∼50%–60% [28,29,41], while the DMSP production from algae was found to be unaffected by pH [28], elevated at low pH [41] or decreased at low pH [29]. On the other hand, the effect of high pH (>8.1) on DMS/P production is unknown. It is also important to know how pH changes may affect microbial-mediated DMSP decomposition. Bacterial abundance and productivity have been found to increase at low pH, suggesting an increase in DMS and DMSP consumption [29,41], but pH-independent cases have also been reported [28]. DMSP-lyase activity showed great interspecific variations at the pH optimum, from pH 5 in a number of haptophyte Phaeocystis spp. and coccolithophore Gephyrocapsa oceanica, to pH 8 in the bacterium Ruegeria lacuscaerulensis and Pseudomonas doudoroffii and up to pH 10.5 in a Phaeocystis strain [29], which suggests that the relationship between pH and algal DMSP production or bacterial DMSP decomposition is rather complex and more comprehensive studies are needed in the future.
Another widespread role of DMS is its utilization by top predators in biological food webs, specifically among ocean-feeding seabirds when locating crustacean prey, which concentrate at sites with high algal abundances [13,48]. Hence, it is expected that, at sites where high amounts of DMS are released by phytoplankton, a high pH will lead to less exact location of crustacean prey, and thereby to less food, and likely, reproduction, by ocean birds—a notion open for further investigation. Hence, the close connection between pH and DMS demonstrated in our study may have a fundamental impact on several global-scale processes. These processes may act in concert or antagonistically and may even lead to synergistic effects as shown regarding other climate processes [49]. From this perspective, our novel data disentangle the mechanisms behind degradation of a major component of the global sulfur cycle and thereby open up for future studies on several crucial components of global-scale environmental changes.
In brief, the ‘CLAW’ hypothesis proposed an ideal scenario of how biological processes regulate global climate through affecting cloud properties via sulfur-containing aerosols [1], yet most steps in the feedback loop of this hypothesis have not been validated [17], especially the relationship between DMS emission and phytoplankton biomass, which has, for a long time, remained a controversy. Our study solved this puzzle by finding a hump-shaped relationship between DMS concentration and phytoplankton biomass in both lakes and oceans, and further revealing the pH-dependent eco-chemical mechanisms governing phytoplankton emissions of DMS. Hence, our results proved that the ‘CLAW’ hypothesis is not perfect and were also a supplement to the hypothesis (Fig. 4). Overall, our results substantially enhance our understanding of the biological regulation of global warming by providing a more complete sulfur cycle and better sulfide-related global-climate-change models. Our results will also shed more light on the research of the ecological functions of DMS/P.
Figure 4.

Schematic representation of how our study modifies and enriches the classic ‘CLAW’ hypothesis by finding the pH-dependent eco-chemical mechanisms governing phytoplankton emissions of DMS in global surface waters.
METHODS
Collection of field samples
We sampled 246 sites from 100 shallow freshwater lakes in the eastern plain of China during the summers of 2008 and 2009. Surface areas of the lakes ranged from 10.2 to 2933 km2, with a total area of ∼18 800 km2 and a longitude and latitude range of ∼10° × 10° (Supplementary Fig. 2). Water temperature, depth, pH, transparency, dissolved oxygen, conductivity, salinity, turbidity, oxidation-reduction potential and suspended solids were measured in situ by a multi-parameter water-quality sond (YSI 6600 V2, YSI Inc., Yellow Springs, USA) and Secchi disk. Physiochemical variables in the water samples, such as total nitrogen, nitrate, nitrite, ammonia, total phosphorus, phosphate, permanganate and Chl-a concentrations, were measured in the laboratory using chemical methods. The water samples for DMS detection were gravity-filtered using a replaceable film needle filter (by Glass microfiber filters, GF/C, 1.2 μm pore size, 47 mm diameter, Whatman, GE Healthcare Life Science, UK) under the same conditions in the field (a recovery test of DMS through gravity filtration is shown in the Supplementary Note), immediately, and 50 mL of filtered water of each sample were instantly frozen without bubbles and transferred to the laboratory, and then thawed at 4°C before DMS detection. We also collected 426 data sets of surface oceans, including simultaneously detected DMS and Chl-a, from the global database of sea-surface DMS from 20 contributors during 1981 and 2012 (Supplementary Fig. 3 and Supplementary Table 2). The relationships between environmental parameters and DMS concentration in lakes were analysed (Supplementary Fig. 6).
Quantification of DMS
All DMS samples were detected by Eclipse 4660 Purge and Trap Sample Concentrator (OI Analytical Company, USA) and Gas Chromatography Mass Spectrometry (QP2010Plus, Shimadzu Corporation, Japan) with a Tenax trap (OI Analytical Company, USA) and an HP-5MS UI column (30 m × 0.25 mm × 0.25 μm, J&W Scientific, USA). All parameters and run settings were identical to our previous study [50].
DMS-degradation experiments
Pure DMS standard (Tokyo Chemical Industry, purity: 99.0%) was diluted with methanol (Merck, HPLC grade) as the first DMS stock solution and then diluted with ultrapure water as the second DMS stock solution. To eliminate the possible interferences of biological or chemical factors (such as microorganisms and metal ions) on DMS degradation, tris-HCl (pH 7.1–8.9), glycine-NaOH (pH 8.6–10.6) and ultrapure water were used to modulate pH solutions. Then the second DMS stock solution was diluted to the above buffer solutions (pH 7.0, 7.5, 8.0, 8.5, 9.0, 9.5, 10.0 and 10.5, with three replicates) with a concentration of 100 ng L−1. Each solution was prepared before use and the DMS concentrations in the different pH solutions were detected at 0.5, 2.0, 5.0, 10.0 and 24.0 hours after being prepared.
Algal culture experiments
Pure P.foveolarum (a DMS-associated algae in Cyanophyta, widely distributed in natural waters with a hypersaline and alkaline tolerance range) was obtained from the Freshwater Algae Culture Collection at the Institute of Hydrobiology (a verification experiment of DMS production from P.foveolarum is shown in the Supplementary Note) and cultured with axenic Blue-Green Medium 11 solution (BG11, according to the manufacturer’s instructions). At the beginning, we adjusted the BG11 culture medium to 8-pH levels (pH 7.0–10.25) with tris-HCl and glycine-NaOH, respectively, and then the algae were inoculated in the above mediums. Each treatment had 300 mL algae with ∼1.0 × 10⁶ cells mL−1 and each pH group had three replicates. All groups were cultured in an algal incubator (25°C, 12 hours light and 12 hours dark) for 2 days, and then the DMS and pH in each group were detected. Because of buffers and short duration, the pH of each culture medium changed little at the end.
Pure E.huxleyi (Prymnesiophyceae, Chromophyta) was obtained from the Center for Collections of Marine Algae at Xiamen University and three replicates were cultured with axenic f/2 Medium (without pH modulation according to the f/2 medium formula and with an initial pH of ∼7) solution for 22 days. DMS and Chl-a were detected every 3 days and pH was detected every day.
Estimation of global sea-surface annual mean DMS concentration using MODIS data
We first established an empirical relationship between DMS and Chl-a concentrations in ocean surface water based on measured data at 426 sites from the global sea-surface DMS database [37]. The log-transformed DMS concentration showed a significant non-linear relationship with log-transformed Chl-a concentration (Supplementary Fig. 5, Adjusted R2 = 0.34, RMSE = 2.55 ng L−1) in the form of equation (1),
 |
(1) |
where y0 = 2.00, a = 0.83, b = 0.35 and x0 = 0.60. Parameter y0 represents a baseline (log-transformed) concentration throughout large areas of low-DMS waters. According to Anderson et al., the model is unable to resolve DMS variability at low log10(Chl-a) [43] and thus we estimated global sea-surface DMS concentrations based on annual mean Chl-a concentrations, which were calculated based on 14-year (2003–16) monthly composites of MODIS Chl-a data with a regridded resolution of a 1/12° grid [42].
Statistical analysis of data
We used piecewise linear regression by R version 3.2.5 (Comprehensive R Archive Network, TUNA Team, Tsinghua University) to confirm the relationship between DMS, Chl-a and pH from field data. SPSS version 20.0 (IBM corporation, Armonk, NY, USA), OriginPro 2015 (OriginLab Corporation, Northampton, MA 01060, USA), Statisticia version 6.0 (StatSoft Inc., Tulsa, OK 74104, USA) and ArcGis 10.0 (Esri China Information Technology Co. Ltd, Beijing, China) were used to analysis the data and draw the figures.
Supplementary Material
Acknowledgements
We thank Zhongqiang Li for giving very useful suggestions on our manuscript and Lu Zhang, Jun Xu and Dawen Zhang for contributing to the fieldwork and hydrochemical analysis of lake waters.
Contributor Information
Xuwei Deng, Donghu Experimental Station of Lake Ecosystems, State Key Laboratory of Freshwater Ecology and Biotechnology of China, Institute of Hydrobiology, Chinese Academy of Sciences, Wuhan 430072, China.
Jun Chen, Donghu Experimental Station of Lake Ecosystems, State Key Laboratory of Freshwater Ecology and Biotechnology of China, Institute of Hydrobiology, Chinese Academy of Sciences, Wuhan 430072, China.
Lars-Anders Hansson, Department of Biology/Aquatic Ecology, Lund University, S-223 62 Lund, Sweden.
Xia Zhao, State Key Laboratory of Vegetation and Environmental Change, Institute of Botany, Chinese Academy of Sciences, Beijing 100093, China.
Ping Xie, Donghu Experimental Station of Lake Ecosystems, State Key Laboratory of Freshwater Ecology and Biotechnology of China, Institute of Hydrobiology, Chinese Academy of Sciences, Wuhan 430072, China; Institute for Ecological Research and Pollution Control of Plateau Lakes, School of Ecology and Environmental Science, Yunnan University, Kunming 650091, China.
Funding
This work was supported by the National Natural Science Foundation of China (91951110) and the Strategic Priority Research Program of the Chinese Academy of Sciences (XDB31000000).
Conflict of interest statement. None declared.
References
- 1. Charlson RJ, Lovelock JE, Andreae MOet al. Oceanic phtoplankton, atmospheric sulphur, cloud albedo and climate. Nature 1987; 326: 655–61. [Google Scholar]
- 2. Malin G, Kirst GO. Algal production of dimethyl sulfide and its atmospheric role. J Phycol 1997; 33: 889–96. [Google Scholar]
- 3. Sunda W, Kieber DJ, Kiene RPet al. An antioxidant function for DMSP and DMS in marine algae. Nature 2002; 418: 317–20. [DOI] [PubMed] [Google Scholar]
- 4. Stefels J. Biological and environmental chemistry of DMS(P) and the role of Phaeocystis in marine biogeochemical cycles. J Sea Res 2000; 43: 179–80. [Google Scholar]
- 5. Williams BT, Cowles K, Martínez ABet al. Bacteria are important dimethylsulfoniopropionate producers in coastal sediments. Nat Microbiol 2019; 4: 1–11. [DOI] [PubMed] [Google Scholar]
- 6. Deschaseaux E, Pontasch S, Hill Ret al. Dimethylsulfonioproprionate (DMSP) content and antioxidant capacity in the host and endosymbionts of the sea anemone Entacmaea quadricolor are influenced by the host phenotype. J Exp Mar Biol Ecol 2018; 503: 41–51. [Google Scholar]
- 7. Van Alstyne KL, Puglisi MP. DMSP in marine macroalgae and macroinvertebrates: distribution, function, and ecological impacts. Aquat Sci 2007; 69: 394–402. [Google Scholar]
- 8. Six KD, Kloster S, Ilyina Tet al. Global warming amplified by reduced sulphur fluxes as a result of ocean acidification. Nat Clim Change 2013; 3: 975–8. [Google Scholar]
- 9. Lana A, Bell TG, Simó Ret al. An updated climatology of surface dimethlysulfide concentrations and emission fluxes in the global ocean. Glob Biogeochem Cycle 2011; 25: 3–25. [Google Scholar]
- 10. Kettle AJ, Andreae MO. Flux of dimethylsulfide from the oceans: a comparison of updated data seas and flux models. J Geophys Res-Atmos 2000; 105: 26793–808. [Google Scholar]
- 11. Vallina SM, Simó R. Strong relationship between DMS and the solar radiation dose over the global surface ocean. Science 2007; 315: 506–8. [DOI] [PubMed] [Google Scholar]
- 12. Liao H, Chang W. Integrated assessment of air quality and climate change for policy-making: highlights of IPCC AR5 and research challenges. Natl Sci Rev 2014; 1: 176–9. [Google Scholar]
- 13. Savoca MS, Nevitt GA. Evidence that dimethyl sulfide facilitates a tritrophic mutualism between marine primary producers and top predators. Proc Natl Acad Sci USA 2014; 111: 4157–61. [DOI] [PMC free article] [PubMed] [Google Scholar]
- 14. Amin SA, Hmelo LR, Van Tol HMet al. Interaction and signaling between a cosmopolitan phytoplankton and associated bacteria. Nature 2015; 522: 99–101. [DOI] [PubMed] [Google Scholar]
- 15. Kiene RP, Linn LJ, Bruton JA. New and important roles for DMSP in marine microbial communities. J Sea Res 2000; 43: 209–24. [Google Scholar]
- 16. Foretich MA, Paris CB, Grosell Met al. Dimethyl sulfide is a chemical attractant for reef fish larvae. Sci Rep 2017; 7: 2498. [DOI] [PMC free article] [PubMed] [Google Scholar]
- 17. Quinn PK, Bates TS. The case against climate regulation via oceanic phytoplankton sulphur emissions. Nature 2011; 480: 51–6. [DOI] [PubMed] [Google Scholar]
- 18. Andreae MO, Barnard WR. The marine chemistry of dimethylsulfide. Mar Chem 1984; 14: 267–79. [Google Scholar]
- 19. Belviso S, Moulin C, Bopp Let al. Assessment of a global climatology of oceanic dimethylsulfide (DMS) concentrations based on SeaWiFS imagery (1998-2001). Can J Fish Aquat Sci 2004; 61: 804–16. [Google Scholar]
- 20. Leck C, Larsson U, Bagander LEet al. Dimethyl sulfide in the Baltic Sea annual variability in relation to biological activity. J Geophys Res-Oceans 1990; 95: 3353–63. [Google Scholar]
- 21. Froelich PN, Kaul LW, Byrd JTet al. Arsenic, barium, germanium, tin, dimethylsulfide and nutrient biogeochemistry in Charlotte Harbor, Florida, a phosphorus-enriched estuary. Estuar Coast Shelf Sci 1985; 20: 239–64. [Google Scholar]
- 22. Watanabe S, Yamamoto H, Tsunogai S. Relation between the concentrations of DMS in surface seawater and air in the temperate North Pacific region. J Atmos Chem 1995; 22: 271–83. [Google Scholar]
- 23. Barnard WR, Andreae MO, Iverson RL. Dimethylsulfide and Phaeocystis poucheti in the southeastern Bering Sea. Cont Shelf Res 1984; 3: 103–13. [Google Scholar]
- 24. Kloster S, Feichter J, Reimer EMet al. DMS cycle in the marine ocean-atmosphere system—a global model study. Biogeosciences 2006; 3: 29–51. [Google Scholar]
- 25. Gabric AJ, Simó R, Cropp RAet al. Modeling estimates of the global emission of dimethylsulfide under enhanced greenhouse conditions. Biogeochem Cycle 2004; 18: GB2014. [Google Scholar]
- 26. Rüdiger H, Christiane D, David Ket al. (eds). Sulfur Metabolism in Phototrophic Organisms. Dordrecht: Springer, 2008. [Google Scholar]
- 27. Howard EC, Henriksen JR, Buchan Aet al. Bacterial taxa that limit sulfur flux from the ocean. Science 2006; 314: 649–52. [DOI] [PubMed] [Google Scholar]
- 28. Arnold HE, Kerrison P, Steinke M. Interacting effects of ocean acidification and warming on growth and DMS-production in the haptophyte coccolithophore Emiliania huxleyi. Global Change Biol 2013; 19: 1007–16. [DOI] [PubMed] [Google Scholar]
- 29. Webb AL, Malin G, Hopkins FEet al. Ocean acidification has different effects on the production of dimethylsulfide and dimethylsulfoniopropionate measured in cultures of Emiliania huxleyi and a mesocosm study: a comparison of laboratory monocultures and community interactions. Environ Chem 2016; 13: 314–29. [Google Scholar]
- 30. Zindler C, Marandino CA, Bange HWet al. Nutrient availability determines dimethyl sulfide and isoprene distribution in the eastern Atlantic Ocean. Geophys Res Lett 2014; 41: 3181–8. [Google Scholar]
- 31. Sunda WG, Hardison R, Kiene RPet al. The effect of nitrogen limitation on cellular DMSP and DMS release in marine phytoplankton: climate feedback implications. Aquat Sci 2007; 69: 341–51. [Google Scholar]
- 32. Franklin DJ, Poulton AJ, Steinke Met al. Dimethylsulphide, DMSP-lyase activity and microplankton community structure inside and outside of the Mauritanian upwelling. Prog Oceanogr 2009; 83: 134–42. [Google Scholar]
- 33. Kiene RP, Bates TS.. Biological removal of dimethyl sulphide from sea water. Nature 1990; 345: 702–5. [Google Scholar]
- 34. Lomans BP, van der Drift C, Pol Aet al. Microbial cycling of volatile organic sulfur compounds. Cell Mol Life Sci 2002; 59: 575–88. [DOI] [PMC free article] [PubMed] [Google Scholar]
- 35. Bouillon RC, Miller WL.. Photodegradation of dimethyl sulfide (DMS) in natural waters: laboratory assessment of the nitrate-photolysis-induced DMS oxidation. Environ Sci Technol 2005; 39: 9471–7. [DOI] [PubMed] [Google Scholar]
- 36. Brimblecombe P, Shooter D.. Photo-oxidation of dimethylsulphide in aqueous solution. Mar Chem 1986; 19: 343–53. [Google Scholar]
- 37. Global Surface Seawater Dimethylsulfide Database. http://saga.pmel.noaa.gov/dms/. [Google Scholar]
- 38. Simó R, Pedros-Alio C.. Role of vertical mixing in controlling the oceanic production of dimethyl sulphide. Nature 1999; 402: 396–9. [Google Scholar]
- 39. Campbell J, Antoine D, Armstrong Ret al. Comparison of algorithms for estimating ocean primary production from surface chlorophyll, temperature, and irradiance. Glob Biogeochem Cycle 2002; 16: GB001444. [Google Scholar]
- 40. Wootton JT, Pfister CA, Forester JD. Dynamic patterns and ecological impacts of declining ocean pH in a high-resolution multi-year dataset. P Natl Acad Sci USA 2008; 105: 18848–53. [DOI] [PMC free article] [PubMed] [Google Scholar]
- 41. Archer SD, Kimmance SA, Stephens JAet al. Contrasting responses of DMS and DMSP to ocean acidification in Arctic waters. Biogeosciences 2013; 10: 1893–908. [Google Scholar]
- 42. Ocean productivity site. http://orca.science.oregonstate.edu/2160.by.4320.monthly.hdf.chl.modis.php. [Google Scholar]
- 43. Anderson TR, Spall SA, Yool Aet al. Global fields of sea surface dimethylsulfide predicted from chlorophyll, nutrients and light. J Mar Syst 2001; 30: 1–20. [Google Scholar]
- 44. Aumont O, Belviso S, Monfray P. Dimethylsulfoniopropionate (DMSP) and dimethylsulfide (DMS) sea surface distributions simulated from a global three-dimensional ocean carbon cycle model. J Geophys Res-Oceans 2002; 107: C4. [Google Scholar]
- 45. Simó R, Dachs J.. Global ocean emission of dimethylsulfide predicted from biogeophysical data. Glob Biogeochem Cycle 2002; 16: GB001829. [Google Scholar]
- 46. Chu S, Elliott S, Maltrud ME. Global eddy permitting simulations of surface ocean nitrogen, iron, sulfur cycling. Chemosphere 2003; 50: 223–35. [DOI] [PubMed] [Google Scholar]
- 47. Hoegh-Guldberg O, Bruno JF.. The impact of climate change on the world's marine ecosystems. Science 2010; 328: 1523–8. [DOI] [PubMed] [Google Scholar]
- 48. Savoca MS, Wohlfeil ME, Ebeler SEet al. Marine plastic debris emits a keystone infochemical for olfactory foraging seabirds. Sci Adv 2016; 2: e1600395. [DOI] [PMC free article] [PubMed] [Google Scholar]
- 49. Hansson LA, Nicolle A, Granéli Wet al. Food-chain length alters community responses to global change in aquatic systems. Nat Clim Change 2013; 3: 228–33. [Google Scholar]
- 50. Deng X, Liang G, Chen Jet al. Simultaneous determination of eight common odors in natural water body using automatic purge and trap coupled to gas chromatography with mass spectrometry. J Chromatogr A 2011; 1218: 3791–8. [DOI] [PubMed] [Google Scholar]
Associated Data
This section collects any data citations, data availability statements, or supplementary materials included in this article.