

Abstract
Rutile-type fluorides have been proven to be active components in the context of emerging antiferr-omagnetic devices. However, controlled synthesis of low-dimensional, in particular two-dimensional (2D), fluorides in a predictable and deterministic manner remains unrealized because of a lack of efficient anisotropic control, which impedes their further development in reduced dimensions. We report here that altered passivation of {110} growing facets can direct the synthesis of rutile-type fluoride nanocrystals into well-defined zero-dimensional (0D) particulates, one-dimensional (1D) rods and 2D sheets in a colloidal approach. The obtained nanocrystals show positive exchange bias and enhanced magnetic transition temperature from the coexistence of long-range antiferromagnetic order and disordered surface spins, making them strong alternatives for flexible magnetic devices and sensors.
Keywords: solution synthesis, fluorides nanostructures, magnetic properties, exchange anisotropy, surface effect
The altered passivation of growing facets can direct the colloidal synthesis of rutile-type fluorides nanocrystals into 0D particulates, 1D rods, and 2D sheets.
INTRODUCTION
When magnetic materials are nanometric at least in one dimension, the surface effect often dominates the static and transport behaviors as a result of broken translation symmetry [1]. The unperfect surface spin coordination and perturbations in spin-spin correlation length make low-dimensional magnetic materials an ideal platform for exploring the copious magnetism in reduced dimensions, especially those that are two-dimensional (2D) [2–4]. Solution processing followed by patterning or assembling these materials to integrated objects poses a conceptual flatland for mechanically flexible, engineerable and biocompatible devices with complex functionalities [5,6]. Recent fast progress in spintronics has brought antiferromagnetic (AFM) counterparts to an emerging field, besides the traditional notion of magnetization reversal by quantum tunneling [7,8]. As a typical long-range AFM order, the rutile-type fluorides MF2 (M = Mn, Fe, and Co) have proven very useful in the context of antiferromagnetic spintronics, especially in the THz range with optical manipulation [9]. Described in terms of the Stoner-Wohlfarth model, two magnetic sublattices orient collinearly with uniaxial magnetic anisotropy in these materials. The antiparallel aligned moments along the tetragonal c axis are defined in Fig. 1a, where antiferromagnetic JAFM and ferromagnetic JFM exchange interactions alternate between nearby moments with a negative Weiss molecular field [10].
Figure 1.

(a) Magnetic interactions in rutile-type MF2 (M = Mn, Fe, and Co) in a [010] view direction. (b) Side view of the geometry-optimized configuration of TEPA molecule at FeF2 (001) surface. Color code: dark grey, C; cyan, N; white, H. (c) Calculated adsorption energies of OAc, OAm, OAl and TEPA molecules at FeF2 (001)-grey, (100)-red, (110)-blue and  -green surfaces. Inset shows the <110> growth direction in a sketched lattice.
However, unlike the van der Waals materials with weakly stacked planes, the micromechanical and more common methodology ‘liquid exfoliation’ is not easily accessible for rutile-type fluorides [11,12]. Some instructive understandings remain unclear because of fundamental hindrance of obtaining these materials in low-dimensions, such as how size matters come to play, and how the subtle interplay between the surface spin arrangement and phase transition operates. It is challenging to initiate and sustain the solution processability of fluorides in a predictable, controlled and deterministic manner, and to clarify their role as a complex mesoscopic system. Considering the tetragonal geometry structures of rutile fluorides, a preferential 1D structure is plausible, whereas the 0D and 2D structures are somewhat more difficult to establish. This is further supported by the fact that most reported fluorides nanocrystals in solutions are 1D oriented, while the 0D and 2D products are scarce [13,14]. Although an inherently anisotropic crystalline structure serves as the driving force for asymmetrical growth, the sifted organic ligand molecules will play a crucial role in determining the oriented growth by capping specific surfaces [15–17]. In this work, we show that asymmetric passivation by elected surfactants can drive the normally 1D fluoride nanocrystal growth into 0D or 2D structures from the perspective of facet-specified adsorption. Moreover, the obtained nanocrystals exhibit anomalous hysteretic behavior and positive exchange anisotropy, in which the disordered surface spins generate robust enhancement of the transition temperature.
RESULTS AND DISCUSSION
To clarify the complexity of altering the course of reactions, we use density functional theory (DFT) methods to consider the role of surfactants classified to acids (oleic acid, OAc), amines (oleylamine, OAm, tetraethylenepentamine, TEPA) and alcohols (oleyl alcohol, OAl), as shown in Fig. 1b,c and Supplementary Fig. S1. According to our calculations, preferential capping on the (001) facet is found in all the evaluated molecules, revealing that the growth direction of the c-axis is impeded. Besides, the asymmetric adsorption of {110} facets with subsequent blocking serves as the origin of rod formation in a direction perpendicular to the (110) or  facet when OAc, OAm and OAl molecules are used. The experimental results are in good agreement with theoretical predictions, where FeF2 nanocrystals with well-defined crystalline orientations are obtained (see Fig. 2 and Supplementary Fig. S2). Powder X-ray diffraction patterns confirm a rutile-type structure with space group P42/mnm, 136 (ICSD code: 073730), as shown in Supplementary Fig. S3.
Figure 2.

Morphological and structural analysis of varied FeF2 nanocrystals. (a, b) Bright-field TEM images of the typical 1D FeF2 rods with varying diameters and the high-resolution TEM image (c) showing the growth direction [110] determined by FFT. (d, e) 1D FeF2 rod with smaller AR value and assemblies on the water showing the transverse planes. (f–h) High-resolution TEM image of 1D FeF2 in (d) and inverse FFT images from the bulk (g) and corner (h) areas in (f), where ‘D’ represents distortions. (i–k) TEM and high-resolution TEM images of 0D FeF2 particulates using OAc. Inset is the corresponding FFT image of a local region labelled by white-framed area in (k). (l–n) TEM, high-resolution TEM and atomic force microscopy (AFM) images of the 2D FeF2 sheets synthesized with TEPA, with a thickness of ca. 5 nm. The FFT image shows that the growing directions are along <110>.
The 1D FeF2 rods with a varied aspect ratio (AR) are depicted in Fig. 2a–h, in which a single-crystalline structure with crossed {110} lattice planes displaying an angle of 45° relative to the rod edges is identified (Fig. 2c and f). This is in accordance with the theoretical descriptions that the rods grow parallel to the <110> orientation with exposing {001} facets. A typical water-gas interface-based self-assembly pattern on a copper grid is shown in Fig. 2e, in which the rectangular cross-sections further confirm the predicated <110> orientation. Inverse FFT images suggest that the inner bulk lattices are highly ordered, as evidenced by the local area labelled with a dotted box in the high-resolution TEM image (Fig. 2f–h), while highly strained arrangement of atoms is observed near the surface (denoted as ‘D’, extracted from the white dotted box in Fig. 2f). During the crystal growth process, the nanocrystals tend to grow fast perpendicular to the most energetically unfavorable facets, thus {200} facets are highly active and are preferentially consumed during the growth. Besides, the concentration of OAm/OAc and temperature of the reactions modulate the growth process effectively, thus regulating the aspect ratios. The OAc molecule shows effective adsorption to all the evaluated facets, indicating the possible formation of nearly spherical particulates if growth kinetics at various stages of the reactions is controlled, such as ceasing the reaction within a few minutes. The spherical particulates with varying diameters are depicted in Fig. 2i–k and Supplementary Fig. S2, showing a rutile-type monocrystalline structure corroborated by the selected-area electron diffraction pattern. As predicted in the DFT calculations, the TEPA molecule plays a key role in formation of 2D FeF2 sheets, from the fact that weak adsorption ability is found for (100), (110) and  facets but strong affinity is found for the (001) facet. No restraint is expected in the <110> direction, whereas the growth should be robustly confined perpendicular to the (001) facet. The 2D sheets have a lateral dimension of several hundred nanometers and a thickness of ca. 5 nm, as shown in Fig. 2l–n. High-resolution TEM imaging confirms the <110> growth direction with pronounced (200) facets, and small terraces of {200} planes are also present with (001) exposing planes identified by the 90° angle at the crystalline edge (Fig. 2m). The growth of CoF2 and MnF2 nanocrystals shows analogous behavior during the reaction courses, reinforcing the idea postulated in the preceding section, see Supplementary Figs S4–S9.
A high-resolution X-ray photoelectron spectrum of Fe 2p3/2 is analyzed using calculated Gupta-Sen multiplets to discriminate the surface state [18,19]. A single satellite peak including t2g and eg 3d transitions, and a single low-intensity peak on the low-binding energy (BE) side are introduced to determine the FeII species [20]. The results follow Gupta-Sen predictions well, allowing for tiny deviations (Fig. 3a). Apart from the F 1 s plasmon loss peaks, a large peak containing high-BE surface structure and high-spin FeIII species is deduced, which is possibly derived from the decreased coordination and hydration of the surface. Energy separation between the Fe 2p3/2 main peak center of gravity (CG) and the shake-up satellite ΔE(satellite-2ppeak CG) = 5.9 eV is much lower than the reported value of FeII-F (6.5 eV) and FeIII-F (8.7 eV) bonds, indicating decreased electronegativity of the ligand because of possible Fe-O bonding derived from the atmospheric oxygen [21]. Furthermore, the lowered F 1 s and Fe 2p3/2 peak CG reveals increased shielding of the Fe nucleus (Supplementary Fig. S10) [22,23]. Electrostatic perturbation arising from a charge difference is much higher than the elastic perturbation of the lattice arising from ion size effect, thus oxygen is readily detected in ionic fluorides possibly from an energetically favored hydrolysis process. Hence, T2 type trivalent substitutional MIII···OII complexes will form to provide sufficient compensating lattice energy to stabilize the OII substitutional [24,25].
Figure 3.

(a) Shirley-type backgrounded Gupta-Sen multiplet fittings for Fe 2p3/2 of 1D FeF2 rods. (b) Q.S. doublet fittings for the Mössbauer spectra. (c) HAADF-STEM image and the corresponding elemental maps (d) of Fe L, F K and O K-edge from the selected area of (c) for 1D FeF2 rods. (e) STEM-EELS elemental mapping of FeII and FeIII for 1D FeF2 rods. (f) EELS spectra of F K, Fe L3 and L2-edges collected from the selected spots of (c). (g) Spectrum evolution of Fe L3-edge decomposed to FeII and FeIII. The blue line shown in the inset indicates the scanning path where EELS data are collected.
Recoil-free 57Fe Mössbauer spectrometry provides further evidence of possible oxygen trapping and the existence of the T2 complex, as depicted in Fig. 3b and Supplementary Fig. S10c. In all cases, a sum of Lorentz doublets is applied to refine the experimental points with their related contributions assigned unambiguously to the bulk and surface component: the isomer shift (I.S.) is exactly the same for the bulk entities, while the interfacial FeII and FeIII proportions are rather dependent on the samples under an octahedral symmetry [26]. A typical spectrum of 16 nm particulate is fitted with three quadrupole splitting (Q.S.) doublets with broadened spectral linewidth, indicating the existence of a large concentration of grain boundaries with a different local arrangement of atoms [27]. The characteristic behaviors of (i) decreased value of I.S. of the FeIII doublets with reduced diameters and (ii) higher line-width of FeII and FeIII doublets than that of the bulk suggest that the Fe-F bonds are stretched and that Fe-O-F mix-bonded FeII/FeIII doublets originate from the atoms in the grain boundaries with structural relaxations. A decreased Q.S. value of FeII is found to accompany the reduction of FeII/FeIII ratio as the size of the nanocrystals decreases, further reinforcing the idea that FeII and FeIII are in terms of the non-stoichiometric FeII-F and FeIII-F octahedra structures, as shown in Supplementary Table 1 [26]. High angle annular dark-field scanning transmission electron microscopy images (HAADF-STEM) and their corresponding elemental maps clearly show that oxygen-enriched phases mainly distribute along the deficient surface, as depicted in Fig. 3c,d. Broad dichotomic Fe L3-edge spectra of electron energy loss spectroscopy (EELS) is obtained, revealing a variation of FeII/FeIII in spatial distribution (Fig. 3f). The FeII suffuses across the whole particle while FeIII is incorporated into the rutile-type lattices, as evidenced by the evolutionary change of Fe L3-edge intensity and corresponding elemental maps (Fig. 3e–g). Line EELS profiles promise qualified estimations of distortions in the interior and at the surface, which is in gratifying agreement to the theory proposed by Lidiard, that is substitutional entities diffuse into ionic crystals by forming complexes with vacancies on the same sublattice [28].
Low field dc susceptibility curves χ = M/H (measured in an applied field of 50 mT) of the 0D FeF2 particulate with an average diameter of 24.0 ± 1.0 nm during heating after zero field cooled-field cooled conditions exhibit strong Néel transitions, with a critical temperature TN of ca. 89.9 K, which is higher than that of the bulk (78 K, see Supplementary Fig. S11a). Inverse susceptibility in the high-temperature regime follows Curie-Weiss law χ = C/(T – ΘP) with ΘP<0, indicating the presence of robust long-range AFM order in the system. Isothermal magnetization curves are collected in fields of up to 8.5 T, as depicted in Fig. 4a. The initial magnetic isotherm is fitted with a modified Langevin expression including a linear contribution as
 |
(1) |
where Ms is the saturation magnetization and A = μC/kBT, μC represents the uncompensated spins [29]. An intrinsic magnetization of 0.77 emu/g is deduced via extrapolating M-H curves to H = 0, indicating a magnetic moment per particle μP = 4942 μB, which is in agreement with the Langevin fitted parameter μC = 4823 μB.
Figure 4.

Magnetization characterizations of 0D FeF2 particulate with an average diameter of 24.0 ± 1.0 nm. (a) Typical initial magnetic isotherm of 300 K obtained from dc magnetization. The solid line is a fit of the modified Langevin function. Inset shows the extrapolation to H = 0 under high applied field up to 8.5 T. (b) Field cooling under ± 5 T field: thermal behavior of the exchange anisotropy field HE. (c) HE and coercive field HC as functions of the cooling field HFC. (d) Detail of the magnetic training effect in HC and HE. Lines are guides to the eye.
In a monodomain AFM cluster containing N ions, each of moment m, the moment pointing in random directions is  m, thus a rough value of μC = 3080 μB (S = 4/2) is estimated via Néel's model [30,31]. The predicted value is much lower than that obtained by the experimental measurements even if considering the FeIII spins (S = 5/2), suggesting another moment m aside from the random arrangement of uncompensated sites in the AFM system. A thermal dependent exchange bias HE (the magnitude of the field offset from the origin in the exchange anisotropy terminology) is identified, as depicted in Fig. 4b and Supplementary Figs S11, S12. A decreased HE with increased temperature below TN is observed, indicating thermal diminished interfacial exchange coupling. However, the anomalous positive HE when T > TN with a magnitude 8% of that at 10 K proves the existence of pinned FM spin structure induced by thermal evolution [32]. A ferromagnetic FM-AFM interaction with the AFM surfaces coupling to the external cooling field HFC results in the usually negative HE. Considering the magnetically uncompensated spins of the AFM system, the cooling field breaks the two-sublattice symmetry. Thus, an antiferromagnetic FM-AFM interaction frustrated by the ferromagnetic coupling between the AFM surface spins and the cooling field can induce positive exchange anisotropy HE under a temperature range T > TN [32]. The
  HE
HE monotonically increases from HFC = 500 Oe to the saturated value at HFC
 2.0 T, with a magnitude of 132% larger than that at low cooling field HFC. The HC changes with analogous behavior, as depicted in Fig. 4c. A decrease of 7% of HE is identified by training of seven consecutive hysteresis loops (Fig. 4d). Note that the positive HE is almost constant under the temperature range T
 TN, suggesting that the pinning effect exerts around TN in a short correlation length, which serves as the dominate pillar accounting for the anomalous exchange anisotropy [33].
The observation of field-dependent irreversible magnetization further confirms the conclusions, where TF is defined as the bifurcation of ZFC and FC magnetization, that is ΔM = MFC – MZFC becomes different from zero, as depicted in Fig. 5a and Supplementary Fig. S13. The power dependence,  , corresponding to the de Almeida-Thouless (A-T) line is given by
 |
(2) |
a characteristic temperature of ca. 85 K is identified by the H2/3 law extrapolation, indicating the onset of the freezing process [34,35]. The ac susceptibility χ’ measurement exhibits a pronounced anomaly at ca. 83 K, in accordance with the TF derived from dc magnetization. The relative peak shift per decade of frequency, δTF = ΔTF/[TF·Δ(log10ν)], where ΔTF = TF (ν1)–TF(ν2), Δ(log10ν) = log10ν1− log10ν2, also known as the Mydosh parameter, is identified to be 0.0065, which is in the range of observed values in the spin-glass categories [36]. It is worth mentioning that the strong irreversibility remains up to the highest field used (5 T), confirming that the disorder is confined in a well-defined surface layer [35]. Note that TN of ca. 89.9 K is slightly higher than the freezing temperature TF. Thus, a preferred orientation is imposed upon the surface spin-glass-like spins during the FC process. Upon heating up to the Néel transition, the AFM core experiences the excess field from the frozen surface layer, generating a pinned FM spin structure antiferromagnetically coupled to the AFM core that results in the observed positive exchange anisotropy. Extra energy is required to switch the spins pinned by the freezing layer, resulting in a strong increase of HC around the TF, as depicted in Supplementary Fig. S14a.
Figure 5.

Dynamics of 0D FeF2 particulate with an average diameter of 24.0 ± 1.0 nm. (a) Field dependence of the spin-glass transition temperature TF indicating the A-T line, i.e. ΔTF ∝ H2/3. Inset shows the real part of the ac susceptibility χ’(T) recorded at different frequencies ν and at an ac field Hac = 8 Oe, dc field Hdc = 500 Oe. (b) Relaxation of the ZFC magnetization at varied temperatures of 2, 6 and 10 K, and their corresponding rate curves (c). (d) Dimensional dependence of the transition temperature TN for varied FeF2 nanocrystals with evaluated diameters Deff. The marked lines are guides to the eye.
The relaxation process further reinforces the surface disordered model, where the time revolution of magnetization is recorded after a lapse of waiting time t = 3600 s (Fig. 5b). A standard stretched exponential function in the form of
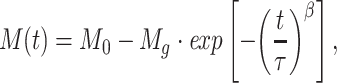 |
(3) |
is exerted, where M0 represents the intrinsic magnetization of the surface layer, and Mg relates to the glassy component of magnetization [37]. The characteristic relaxation time τ is determined to be in the range of 4600 ∼ 5300 s, while the stretching exponent β is identified to be 0.10 ∼ 0.23, falling in the range of obtained values for systems evolving through a distribution of energy barriers [36]. The relaxation rate W(t) theoretically determined using Monte Carlo simulations by Ulrich et al. is further examined, relating to the magnetization by the form of
 |
(4) |
where W(t) is in a power-law decay above some crossover time t0, W(t) = At−n, t ≥ t0, the pre-exponential factor A is constant, while n is an exponent function of temperature in the relaxation process [37,38]. The exponent n is identified by fitting the relaxation rate W(t) and the corresponding logarithmic presentation logW(t) vs logt, to be 1.01, 0.96, 0.94 for 2, 6 and 10 K, respectively, which confirms the cluster spin-glass behavior in the system, as depicted in Fig. 5c and Supplementary Fig. S14.
Surface effects are sensitive to any non-stoichiometry and are more pronounced with decreasing size, which is also the reason for the absence of cusp in ac susceptibility data [39–41]. The translational symmetry breaking of the AFM lattice and unsaturated bonds generating random fields or interactions may be responsible for the surface spin freezing behavior. Distortions on the atomic scale and heterogeneity also account for the spin frustration. Generally, the surface distortion in nanostructured materials results in a decreased transition temperature because of the reduced exchange constant and limited correlation length [42]. Nevertheless, we find an enhanced magnetic transition temperature for all the obtained samples despite their topological differences, as depicted in Fig. 5d. In our case, the core spins are in an AFM network while surface spins freeze like a spin-glass, generating a pinned FM moment MF that has profound effects on the transition of the entire nanocrystal. Considering the order parameters in the framework of Landau theory, where structure parameter PS, AFM order parameter PA and MF are included in the first approximation, the free energy GL is given by an expansion:
 |
(5) |
where B 0, A
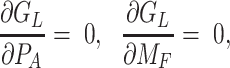
0, A 0, Γ = (T – Tbulk)/Tbulk is the reduced temperature [43,44]. Minimizing GL with respect to PA and MF by
 |
(6) |
when in the critical point, PA = 0, hence the critical phase transition temperature is enhanced by T = Tbulk · (1 + /A). Moreover, additional increasing of the diameters of the nanocrystals should decrease the transition temperature as the characteristic correlation length is approaching the value of the bulk, as identified in Fig. 5d.
CONCLUSION
We have presented that altered passivation of growing facets can direct the colloidal synthesis of rutile-type fluoride nanocrystals into well-defined 0D particulates, 1D rods and 2D sheets in a predicted and controlled manner. The presence of TEPA molecules is essential in formation of 2D sheets by preferential packing of -NH2 ligands on the (001) facets and blocking them from further growth. A cluster spin-glass-like surface layer is identified from the disrupted translation symmetry at the surface, which exerts a pinned FM moment on the AFM core. Anomalous positive exchange bias HE and enhanced magnetic phase transition temperature are observed from the interactions between pinned FM moments and the associated structural order parameters, which are qualified within the framework of Landau theory. These high-quality fluoride nanocrystals are strong candidates for flexible antiferromagnetic devices and sensors. Moreover, we believe that this approach of anisotropic direction of the growing process will pave the way to solution synthesis of other low-dimensional halide nanocrystals for emerging spintronics, such as 2D FeCl2 and CrI3.
MATERIALS AND METHODS
The controlled synthesis of rutile-type fluorides MF2 (M = Mn, Fe, and Co) nanocrystals is realized both through ‘one-pot’ and ‘conversion-chemistry’ based methods, where metallic or oxide nanocrystals are used as conversion seeds. NH4F, NH4HF2 and ammonium trifluoroacetate (ATF) were utilized as the fluorine source, while their ability to provide F- is in a sequence: NH4HF2>NH4F>ATF. Note that the fluorine-contained chemicals are often of acute toxicity, and may cause severe skin burns and eye damage. The comprehensive details, chemicals, characterizations and theoretical methods are in the Supplementary data.
Supplementary Material
ACKNOWLEDGEMENTS
The characterizations were partially carried out at the Analytical Instrumentation Center of PKU. We would like to thank Prof. Zhiwei Li for his help in Mössbauer spectrum analysis, as well as Dr. Sergey Basov, Changan Wang, Prof. Shengqiang Zhou, Prof. Margriet J. Van Bael and Prof. Chris Van Haesendonck for their support of SQUID test.
FUNDING
This work was supported by the National Key R&D Program of China (2017YFA0206301 and 2016YFA0200102), the National Natural Science Foundation of China (51631001, 51590882, 51672010 and 81421004) and the Shenzhen Science and Technology Project (JCYJ20190808152217447 and JCYJ20180305125212075 to Z.Y.Y).
Conflict of interest statement. None declared.
REFERENCES
- 1. Coey JMD. Magnetism and Magnetic Materials. Cambridge: Cambridge University Press, 2010. [Google Scholar]
- 2. Li H, Ruan SC, Zeng YJ. Intrinsic van der Waals magnetic materials from bulk to the 2D limit: new frontiers of spintronics. Adv Mater 2019; 31: 1900065. [DOI] [PubMed] [Google Scholar]
- 3. Burch KS, Mandrus D, Park JG. Magnetism in two-dimensional van der Waals materials. Nature 2018; 563: 47–52. [DOI] [PubMed] [Google Scholar]
- 4. Li XX, Yang JL. First-principles design of spintronics materials. Natl Sci Rev 2016; 3: 365–81. [Google Scholar]
- 5. Jariwala D, Marks TJ, Hersam MC. Mixed-dimensional van der Waals heterostructures. Nat Mater 2017; 16: 170–81. [DOI] [PubMed] [Google Scholar]
- 6. Liu Y, Weiss NO, Duan XDet al. van der Waals heterostructures and devices. Nat Rev Mater 2016; 1: 16042. [Google Scholar]
- 7. Baltz V, Manchon A, Tsoi Met al. Antiferromagnetic spintronics. Rev Mod Phys 2018; 90: 015005. [Google Scholar]
- 8. Gider S, Awschalom DD, Douglas Tet al. Classical and quantum magnetic phenomena in natural and artificial ferritin proteins. Science 1995; 268: 77–80. [DOI] [PubMed] [Google Scholar]
- 9. Gulbrandsen SA, Brataas A. Spin transfer and spin pumping in disordered normal metal–antiferromagnetic insulator systems. Phys Rev B 2018; 97: 054409. [Google Scholar]
- 10. Corrêa CA, Výborný K. Electronic structure and magnetic anisotropies of antiferromagnetic transition-metal difluorides. Phys Rev B 2018; 97: 235111. [Google Scholar]
- 11. Coleman JN, Lotya M, O’Neill Aet al. Two-dimensional nanosheets produced by liquid exfoliation of layered materials. Science 2011; 331: 568–71. [DOI] [PubMed] [Google Scholar]
- 12. Ma RZ, Sasaki T. Two-dimensional oxide and hydroxide nanosheets: controllable high-quality exfoliation, molecular assembly, and exploration of functionality. Acc Chem Res 2015; 48: 136–43. [DOI] [PubMed] [Google Scholar]
- 13. Guntlin CP, Kravchyk KV, Erni Ret al. Transition metal trifluoroacetates (M = Fe, Co, Mn) as precursors for uniform colloidal metal difluoride and phosphide nanoparticles. Sci Rep 2019; 9: 6613. [DOI] [PMC free article] [PubMed] [Google Scholar]
- 14. Karki K, Wu LJ, Ma Yet al. Revisiting conversion reaction mechanisms in lithium batteries: lithiation-driven topotactic transformation in FeF2. J Am Chem Soc 2018; 140: 17915–22. [DOI] [PubMed] [Google Scholar]
- 15. Huo D, Kim MJ, Lyu Zet al. One-dimensional metal nanostructures: from colloidal syntheses to applications. Chem Rev 2019; 119: 8972–9073. [DOI] [PubMed] [Google Scholar]
- 16. Schliehe C, Juarez BH, Pelletier Met al. Ultrathin PbS sheets by two-dimensional oriented attachment. Science 2010; 329: 550–3. [DOI] [PubMed] [Google Scholar]
- 17. Yang ZY, Zhao TS, Huang XXet al. Modulating the phases of iron carbide nanoparticles: from a perspective of interfering with the carbon penetration of Fe@Fe3O4 by selectively adsorbed halide ions. Chem Sci 2017; 8: 473–81. [DOI] [PMC free article] [PubMed] [Google Scholar]
- 18. Gupta RP, Sen SK. Calculation of multiplet structure of core p-vacancy levels. Phys Rev B 1974; 10: 71–7. [Google Scholar]
- 19. Gupta RP, Sen SK. Calculation of multiplet structure of core p-vacancy levels. II. Phys Rev B 1975; 12: 15–9. [Google Scholar]
- 20. Henrich VE, Cox PA. The Surface Science of Metal Oxides. Cambridge: Cambridge University Press, 1996. [Google Scholar]
- 21. Grosvenor AP, Kobe BA, Biesinger MCet al. Investigation of multiplet splitting of Fe 2p XPS spectra and bonding in iron compounds. Surf Interface Anal 2004; 36: 1564–74. [Google Scholar]
- 22. Sarma DD, Kamath PV, Rao CNR. Satellites in the X-ray photoelectron spectra of transition-metal and rare-earth compounds. Chem Phys 1982; 73: 71–82. [Google Scholar]
- 23. Park J, Ryu S, Han MSet al. Charge-transfer satellites in the 2p core-level photoelectron spectra of heavy-transition-metal dihalides. Phys Rev B 1988; 37: 10867–75. [DOI] [PubMed] [Google Scholar]
- 24. Catlow CRA. Oxygen incorporation in the alkaline earth fluorides. J Phys Chem Solids 1977; 38: 1131–6. [Google Scholar]
- 25. Ure RW Jr. Ionic conductivity of calcium fluoride crystals. J Chem Phys 1957; 26: 1363–73. [Google Scholar]
- 26. Crouse PL, Stander CM. A conversion electron Mössbauer spectroscopic study of iron fluoride hydrate surface layers at low glancing angles. J Phys Chem Solids 1988; 49: 1145–51. [Google Scholar]
- 27. Ramasamy S, Jiang J, Gleiter Het al. Investigation of nanocrystalline FeF2 by Mössbauer spectroscopy. Solid State Commun 1990; 74: 851–5. [Google Scholar]
- 28. Lidiard AB. XCII. Impurity diffusion in polar crystals. Lond Edinb Dubl Phil Mag 1955; 46: 815–23. [Google Scholar]
- 29. Kilcoyne SH, Cywinski R. Ferritin: a model superparamagnet. J Magn Magn Mater 1995; 140: 1466–7. [Google Scholar]
- 30. Coey JMD, Readman PW. New spin structure in an amorphous ferric gel. Nature 1973; 246: 476–8. [Google Scholar]
- 31. Néel L. Experimental proofs of ferromagnetism and antiferromagnetism. Ann Fourier Inst 1949; 1: 163–83. [Google Scholar]
- 32. Nogués J, Lederman D, Moran TJet al. Positive exchange bias in FeF2-Fe bilayers. Phys Rev Lett 1996; 76: 4624–7. [DOI] [PubMed] [Google Scholar]
- 33. Morales R, Basaran AC, Villegas JEet al. Exchange-bias phenomenon: the role of the ferromagnetic spin structure. Phys Rev Lett 2015; 114: 097202. [DOI] [PubMed] [Google Scholar]
- 34. de Almeida JRL, Thouless DJ. Stability of the Sherrington-Kirkpatrick solution of a spin glass model. J Phys A Math Gen 1978; 11: 983–90. [Google Scholar]
- 35. Martinez B, Obradors X, Balcells LIet al. Low temperature surface spin-glass transition in γ-Fe2O3 nanoparticles. Phys Rev Lett 1998; 80: 181–4. [Google Scholar]
- 36. Mydosh JA. Spin Glasses: An Experimental Introduction. London: CRC Press, 2014. [Google Scholar]
- 37. Ulrich M, García-Otero J, Rivas Jet al. Slow relaxation in ferromagnetic nanoparticles: indication of spin-glass behavior. Phys Rev B 2003; 67: 024416. [Google Scholar]
- 38. Hoogerbeets R, Luo W-L, Orbach R. Spin-glass response time in Ag:Mn: exponential temperature dependence. Phys Rev Lett 1985; 55: 111–3. [DOI] [PubMed] [Google Scholar]
- 39. Peng J, Guo YQ, Lv HFet al. Superparamagnetic reduced graphene oxide with large magnetoresistance: a surface modulation strategy. Angew Chem Int Ed 2016; 55: 3176–80. [DOI] [PubMed] [Google Scholar]
- 40. Zhu XJ, Guo YQ, Cheng Het al. Signature of coexistence of superconductivity and ferromagnetism in two-dimensional NbSe2 triggered by surface molecular adsorption. Nat Commun 2016; 7: 11210. [DOI] [PMC free article] [PubMed] [Google Scholar]
- 41. Guo YQ, Xu K, Wu CZet al. Surface chemical-modification for engineering the intrinsic physical properties of inorganic two-dimensional nanomaterials. Chem Soc Rev 2015; 44: 637–46. [DOI] [PubMed] [Google Scholar]
- 42. Mills DL. Surface effects in magnetic crystals near the ordering temperature. Phys Rev B 1971; 3: 3887–95. [Google Scholar]
- 43. Golosovsky IV, Mirebeau I, Sakhnenko VPet al. Evolution of the magnetic phase transition in MnO confined to channel type matrices: neutron diffraction study. Phys Rev B 2005; 72: 144409. [Google Scholar]
- 44. Golosovsky IV, Mirebeau I, André Get al. Magnetic ordering and phase transition in MnO embedded in a porous glass. Phys Rev Lett 2001; 86: 5783–6. [DOI] [PubMed] [Google Scholar]
Associated Data
This section collects any data citations, data availability statements, or supplementary materials included in this article.