Abstract
Although β-Fe2O3 has a high theoretical solar-to-hydrogen efficiency because of its narrow band gap, the study of β-Fe2O3 photoanodes for water splitting is elusive as a result of their metastable nature. Raman identification of β-Fe2O3 is theoretically and experimentally investigated in this study for the first time, thus clarifying the debate about its Raman spectrum in the literature. Phase transformation of β-Fe2O3 to α-Fe2O3 was found to potentially take place under laser and electron irradiation as well as annealing. Herein, phase transformation of β-Fe2O3 to α-Fe2O3 was inhibited by introduction of Zr doping, and β-Fe2O3 was found to withstand a higher annealing temperature without any phase transformation. The solar water splitting photocurrent of the Zr-doped β-Fe2O3 photoanode was increased by 500% compared to that of the pure β-Fe2O3 photoanode. Additionally, Zr-doped β-Fe2O3 exhibited very good stability during the process of solar water splitting. These results indicate that by improving its thermal stability, metastable β-Fe2O3 film is a promising photoanode for solar water splitting.
Keywords: solar energy conversion, metastable phase, phase transformation, iron oxide, photoelectrochemical water splitting
The use of element doping to prevent the phase transition of metastable semiconductors has been approved for the application of photoelectrochemcial hydrogen production via water splitting for the first time.
INTRODUCTION
Since the concept of a hydrogen economy was introduced, solar hydrogen production using photoelectrochemical (PEC) or photocatalytic water splitting has occupied a very important position in the artificial utilization of inexhaustible solar energy [1–6]. Solar water splitting for hydrogen production has thereby attracted intensive and ever-increasing interest from many researchers [7–15]. The solar-to-hydrogen efficiency of PEC water splitting reached over 19% using III-V multi-junction semiconductors (including In and Ga) prepared by molecular beam epitaxial growth [16]. Unfortunately, there is a lack of low-cost, environmentally friendly, efficient and stable photoelectrodes for PEC water splitting [17–22], thus hindering application of PEC cells for hydrogen production.
In recent decades, iron-based semiconductors with narrow band gaps (e.g. α-Fe2O3) have been considered as promising photoanode materials with respect to nontoxicity, cost, stability and theoretical solar-to-hydrogen efficiency [23–34]. Recently, a β-Fe2O3 semiconductor with a direct band gap of 1.9 eV was reported by the present authors as a water splitting photoanode under Air Mass 1.5 Global spectrum (AM 1.5 G, 100 mW cm–2) illumination [35]. Theoretically, a β-Fe2O3 photoanode for solar water splitting may exhibit a solar-to-hydrogen efficiency of 20.9% because of its narrow band gap of 1.9 eV, whereas its solar photocurrent density is still very low [35]. The phase transformation of metastable β-Fe2O3 to mature α-Fe2O3 may occur initially at the surface or interface during fabrication of photoanode films because metastable β-Fe2O3 cannot withstand the high temperature of annealing.
Phase identification of β-Fe2O3 is very important to avoid the effects of impurities (e.g. α-Fe2O3) during the process of solar water splitting. Phase characterization of inorganic materials is frequently achieved with such methods as X-ray diffraction (XRD), neutron diffraction, electron diffraction, Raman scattering spectroscopy and infrared absorption spectroscopy. Among these methods, Raman spectroscopy is fast and highly sensitive toward material surface structural information. However, Raman spectra of β-Fe2O3 (including Raman peak position and shape) reported in the literature are often contradictory [36,37]. Thus, this study aims to clarify the debates surrounding the Raman spectra of β-Fe2O3.
The wavelength and power of the excitation laser should be chosen carefully during the process of Raman detection. An appropriate wavelength of laser should be selected to enhance the Raman sensibility and minimize the fluorescence emission of the samples. It is equally important that the power of the laser be examined cautiously to avoid the influences of thermal effects caused by the laser, especially for those materials with poor thermal stability. For example, phase transformation of ϵ-Fe2O3 and γ-Fe2O3 may take place under laser irradiation [38,39], and β-Fe2O3 may be converted into α-Fe2O3 upon heat treatment [35,40]. Therefore, low-power laser irradiation is required to avoid phase transformation of the β-Fe2O3 samples.
In this study, the influence of laser wavelength and irradiation power on phase transformation of β-Fe2O3 to α-Fe2O3 was investigated, and the Raman vibrational spectrum of β-Fe2O3 was clarified. After being doped with Zr, the particle-assembled β-Fe2O3 photoanodes can withstand higher annealing temperatures during the post-treatment process. Therefore, the solar water splitting photocurrent density for the particle-assembled Zr-doped β-Fe2O3 photoanodes was improved significantly to 1.2 mA cm–2, which is five times greater than that of pure β-Fe2O3 photoanodes. Thus, this study suggests metastable β-Fe2O3 films as promising photoanode materials for solar water splitting.
RESULTS AND DISCUSSION
β-Fe2O3 belongs to the space group  , Th7. Irreducible representations of the Γ-point phonon modes for β-Fe2O3 are shown in Supplementary Table S1. Factor group analysis of β-Fe2O3 predicts 49 phonon modes, 22 and 17 of which are Raman active modes and infrared active modes (Supplementary Table S2), respectively. Some Raman vibrational modes of β-Fe2O3 were observed in previous studies, whereas Rahman and coworkers reported different Raman spectra for β-Fe2O3 [36,37]. To clarify the Raman vibrational modes of β-Fe2O3, the Raman scatter spectrum of β-Fe2O3 was verified, as shown in Supplementary Fig. S1. Twelve clear vibrational peaks of β-Fe2O3 were observed at 158, 169, 234, 258, 274, 314, 328, 368, 386, 397, 522 and 635 cm–1 using the 785 nm laser of 0.4 W. These peaks can clearly be distinguished from the Raman vibration peaks of α-Fe2O3 (227, 246, 293, 300, 411, 499, and 613 cm–1). Compared to previous results from Liang and van de Krol [36], four new vibrational peaks at 258, 397, 522 and 635 cm–1 were observed, whereas the vibrational peak at 208 cm–1 was not observed.
The theoretical calculations and experimental values of Raman vibrational peaks are listed in Supplementary Table S3. Among the 22 vibrational modes predicted by the theoretical calculations, only 12 significant peaks were observed in the experiments. Three weak vibrational modes are marked with asterisks. The M10 (383 cm–1) and M11 (389 cm–1) modes merge into one peak (386 cm–1) in the experimental spectrum. As given in Supplementary Fig. S1, typical peaks corresponding to vibrational modes 158 cm–1 (Tg), 274 cm–1 (Tg), 368 cm–1 (Tg) and 386 cm–1 (Eg+Tg) can be used as a characteristic spectrum for identifying the phase of β-Fe2O3. In addition, the theoretically calculated infrared vibrational peaks and the experimental infrared absorption spectrum are also given in Supplementary Table S4 and Supplementary Fig. S2, respectively.
The metastable β-Fe2O3 phase may be converted to the mature α-Fe2O3 phase upon laser irradiation of different wavelengths and power. Figure 1 shows the effects of laser wavelength on the Raman spectrum of β-Fe2O3. The Raman peaks at 227, 293, 411, 499 and 613 cm–1 belonging to α-Fe2O3 appeared after irradiation of the β-Fe2O3 samples with a 532 nm or 633 nm laser. In the case of 785 nm laser irradiation, the experimental and theoretical Raman peaks for β-Fe2O3 match in shape but exhibit a slight shift. These results suggest that a 785 nm laser is ideal for detecting the Raman spectra of metastable β-Fe2O3.
Figure 1.
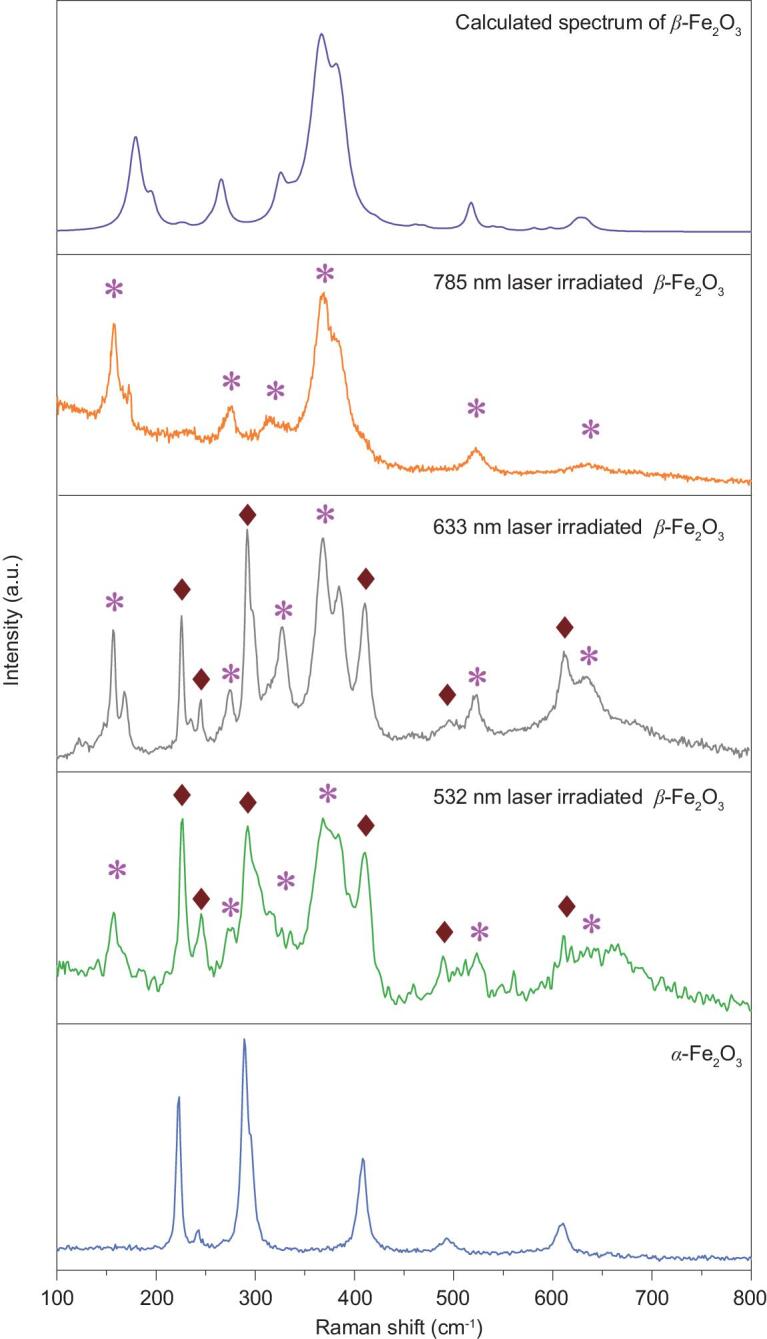
Theoretical calculation and experimental measurement of Raman spectra of β-Fe2O3 samples excited by a 0.4 mW laser at 785, 633 and 532 nm. The Raman spectrum of α-Fe2O3 is listed as a reference.
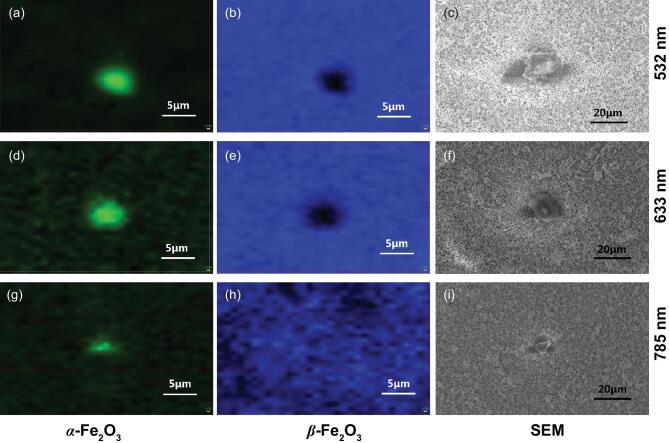
Raman spectra mapping images shown in Fig. 2 also indicate phase transformation of the particle-assembled β-Fe2O3 films without any necking treatment, in which the α-Fe2O3 phase appears when the β-Fe2O3 film samples are irradiated with a 10 mW laser of 532 and 633 nm. Scanning electron microscope (SEM) images also suggest this phase transformation. Even when β-Fe2O3 was irradiated with a laser of 785 nm with 10 mW power, slight damage of the β-Fe2O3 films was observed.
Figure 2.
Raman mapping and SEM images of particle-assembled β-Fe2O3 films excited by a 0.4 mW laser at 785 nm after irradiation by a 10 mW laser with various wavelengths: (a-c) 532 nm, (d-f) 633 nm and (g-i) 785 nm. (a, d, g) α-Fe2O3; (b, e, h) β-Fe2O3.
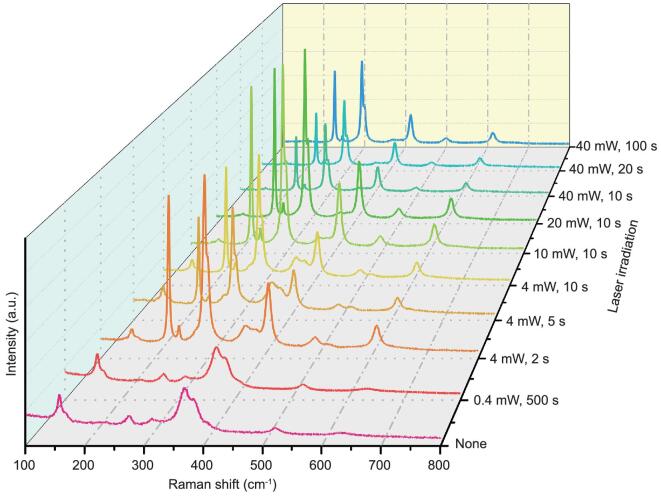
Additionally, the effects of laser power on the Raman spectrum of β-Fe2O3 were investigated. When the power of the 785 nm laser is increased, a phase change of β-Fe2O3 to α-Fe2O3 possibly occurs (Fig. 3). After β-Fe2O3 is irradiated by 0.4 mW 785 nm laser for an extended period of 500 s, there is no signal corresponding to α-Fe2O3. A significant phase transformation occurs with as little as 2 s irradiation with a 4 mW 785 nm laser. As the laser power increases and the exposure time is prolonged, all the β-Fe2O3 gradually converts to α-Fe2O3.
Figure 3.
Raman spectra of β-Fe2O3 under different power laser irradiations of 785 nm.
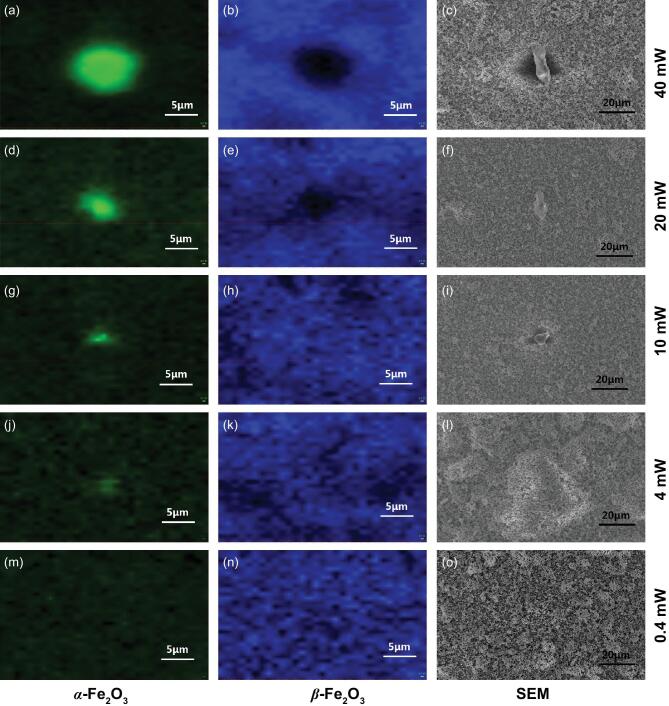
Figure 4 shows Raman spectra mapping and SEM images of the particle-assembled β-Fe2O3 films without any necking treatment after laser illumination of 785 nm. When the β-Fe2O3 films were irradiated with 785 nm laser at 0.4 W power, no α-Fe2O3 signal appeared. With the increasing power of the 785 nm laser, the signals of α-Fe2O3 were enhanced, suggesting laser-induced phase transformation of β-Fe2O3 to α-Fe2O3. The SEM images of Fig. 4 also corroborate this result. The phase transformation of β-Fe2O3 to α-Fe2O3 is initiated by laser irradiation, likely as a result of the thermal effects of the laser. Therefore, low-power laser irradiation is required to avoid the phase transformation of metastable materials during Raman characterization to minimize its thermal effects. Thus, a 0.4 mW 785 nm laser is ideal for measuring the Raman spectra of β-Fe2O3.
Figure 4.
Raman mapping and SEM images of particle-assembled β-Fe2O3 films excited by a 0.4 mW laser of 785 nm after the irradiation of 785 nm laser with various power: (a-c) 40 mW, (d-f) 20 mW, (g-i) 10 mW, (j-l) 4 mW and (m-o) 0.4 mW. (a, d, g, j, m) α-Fe2O3; (b, e, h, k, n) β-Fe2O3.
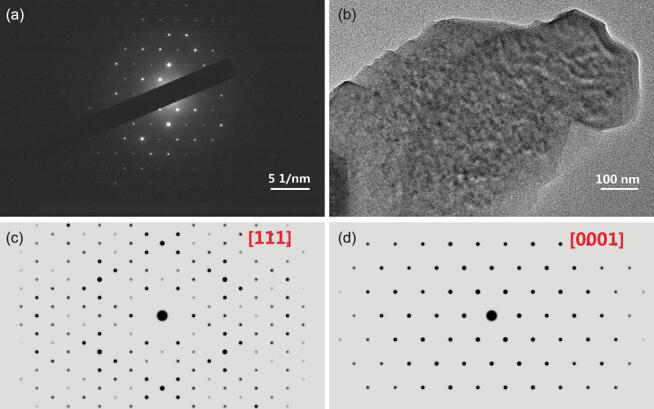
Figure 5 shows transmission electron microscope (TEM) and selected area electron diffraction (SAED) images of the β-Fe2O3 samples. A simulated SAED image of α-Fe2O3 is shown in Fig. 5 for comparison. The measured SAED image of β-Fe2O3 samples (Fig. 5a) is in good agreement with the simulated SAED image of α-Fe2O3 (Fig. 5d) rather than the simulated SAED image of β-Fe2O3 samples (Fig. 5c), suggesting that the phase transformation of β-Fe2O3 to α-Fe2O3 induced by electron irradiation was also observed in this study. Note that the use of SAED to detect β-Fe2O3 should be done with caution. The phase transformation of β-Fe2O3 to α-Fe2O3 may be driven by laser irradiation, electron irradiation and heating (Supplementary Figs S3 and S4).
Figure 5.
SAED and TEM images of the samples. (a) Measured SAED image of the β-Fe2O3 sample. (b) TEM image of the β-Fe2O3 sample. (c) Simulated SAED image of β-Fe2O3. (d) Simulated SAED image of α-Fe2O3.
In our previous work, phase transformation of β-Fe2O3 to α-Fe2O3 occurred after annealing at 650°C [29]. Phase transformation of β-Fe2O3 was also proven by the appearance of the Raman peaks of α-Fe2O3 (Supplementary Fig. S3). In this study, Zr was introduced into the metastable β-Fe2O3 to inhibit phase transformation of β-Fe2O3 to α-Fe2O3. The formation energy of Zr0.03Fe1.97O3 (Zr-doped β-Fe2O3) was calculated as −0.16 eV relative to pure β-Fe2O3, suggesting that Zr can be doped into the lattice of β-Fe2O3 to form a more stable structure. The density of states (DOS) for Zr0.03Fe1.97O3 indicates that the band gap of β-Fe2O3 does not change obviously by doping Zr (Supplementary Fig. S5).
The XRD pattern of Zr-doped β-Fe2O3 (Supplementary Fig. S6) is in good agreement with β-Fe2O3 (JCPDS#39–0238), suggesting that there is no impurity phase after doping with Zr. The X-ray photoelectron spectroscopy in Supplementary Fig. S7 shows that Zr was doped into the sample. The absorption spectra of pure β-Fe2O3 and Zr-doped β-Fe2O3 are shown in Supplementary Fig. S8. After annealing, the band gap of pure β-Fe2O3 changed, whereas the band gap of Zr-doped β-Fe2O3 did not. In previous work, we have reported that the absorption spectrum of β-Fe2O3 varies after different calcining processes [35]. The change in band gap indicates that a phase transformation may occur. Indeed, after being annealed at 1023 K, the characteristic Raman peaks of α-Fe2O3 appeared in the Raman spectrum of the β-Fe2O3 sample (Supplementary Fig. S9a), indicating that there was a phase transformation. The Raman spectra of Zr-doped β-Fe2O3 did not change after being annealed at 1023 K (Supplementary Fig. S9b), indicating that there was no phase transformation. Note that the results of differential scanning calorimetry show that the phase transition temperature of Zr-doped β-Fe2O3 is clearly increased, as shown in Supplementary Fig. S10. The above results show that Zr doping effectively increases the phase transition temperature of metastable iron oxide.
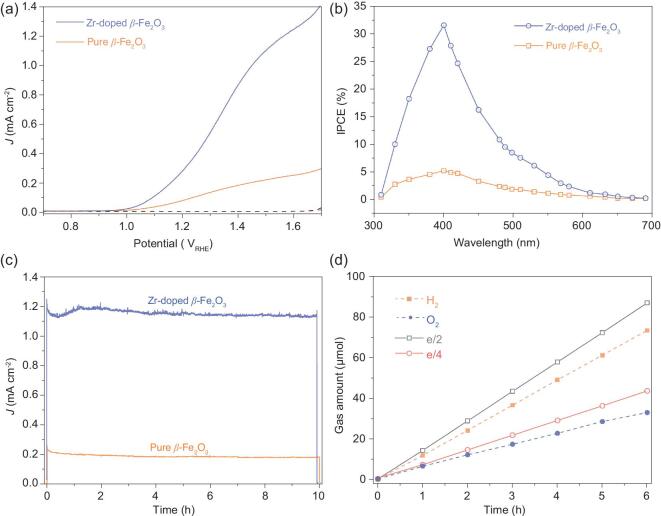
SEM images of the particle-assembled β-Fe2O3 photoanodes with and without Zr doping are shown in Supplementary Fig. S11. Figure 6a shows a comparison of the PEC performances of the particle-assembled β-Fe2O3 photoanodes with and without Zr doping under AM 1.5 G irradiation (100 mW cm–2). The results show that the photocurrent of Zr-doped β-Fe2O3 photoanodes is much higher than that of pure β-Fe2O3 photoanodes. Zr-doped β-Fe2O3 photoanodes also exhibit much larger monochromatic incident photon-to-electron conversion efficiency (IPCE) than pure β-Fe2O3 photoanodes (Fig. 6b). Compared to the pure β-Fe2O3, the carrier density of Zr-doped β-Fe2O3 has been improved from 1.8 × 10²⁰ to 4.6 × 1020 cm−3, which can be estimated from the Supplementary Fig. S12a. As shown in Supplementary Fig. S12b, the charge separation efficiency of Zr-doped β-Fe2O3 is improved by approximately four times at 1.6 V versus Reversible Hydrogen Electrode (RHE), compared to that of β-Fe2O3. The increase in the carrier concentration may favor the charge transport and contribute to the improvement in water splitting photocurrent of the Zr-doped β-Fe2O3 photoanode.
Figure 6.
(a) Photocurrent density, (b) IPCE, (c) photochemical stability at 1.6 VRHE and (d) Faradic efficiencies of the particle-assembled β-Fe2O3 films with Zr doping under illumination of standard simulated sunlight (100 mW cm−2) in 1 M NaOH electrolyte (pH = 13.6). Reference sample: α-Fe2O3.
Under AM 1.5 G irradiation (100 mW cm–2), both Zr-doped and pure β-Fe2O3 photoanodes exhibit very good photochemical stability for water splitting during the PEC reaction over 10 h, as shown in Fig. 6c. In the case of particle-assembled Zr-doped β-Fe2O3 photoanodes, the Faradaic efficiencies for hydrogen production and oxygen production are 85% and 80%, respectively (Fig. 6d). This result suggests that the photocurrent of the particle-assembled β-Fe2O3 photoanodes is mainly attributed to water splitting.
During the process of solar water splitting, β-Fe2O3 as a photoanode material may be exposed to standard simulated sunlight for a long time. To assess the possibility for phase transformation of β-Fe2O3 to α-Fe2O3 under simulated sunlight, the Raman spectra of the samples were measured before and after the photochemical stability testing. As shown in Supplementary Fig. S13, the phase of the β-Fe2O3 photoanodes before and after the reaction of PEC water splitting remains unchanged. In a typical PEC reaction, the intensity of the light used is not sufficient to promote the phase transformation of β-Fe2O3 particle-assembled films. Therefore, β-Fe2O3 is a promising photoanode for water splitting. The PEC performance of β-Fe2O3 may be improved further by not only the rational design of electrocatalysts but also the optimization of preparation methods [41,42].
CONCLUSION
In conclusion, the Raman spectrum of β-Fe2O3 under excitation by a 785 nm laser with 0.4 W power shows 12 significant vibrational modes corresponding to β-Fe2O3. The phase transformation of metastable β-Fe2O3 to mature α-Fe2O3 may be observed under laser irradiation, electron irradiation and heating. Zr doping was introduced to particle-assembled β-Fe2O3 films, thus not only increasing the carrier concentration but also suppressing the phase transformation of β-Fe2O3. The PEC performance of the Zr-doped β-Fe2O3 photoanode was vastly boosted, in comparison with that of the pure β-Fe2O3 photoanode. This study demonstrates that metastable β-Fe2O3 remains stable during the PEC reaction and is a promising photoanode material for decomposing water, thus paving the road toward the use of β-Fe2O3 in solar water splitting (Supplementary Scheme S1).
METHODS
In this study, β-Fe2O3 powder was synthesized by calcining the mixture of NaFe(SO4)2 (or 1.5% ZrSO4 doped NaFe(SO4)2) and NaCl in a muffle furnace at 450°C for 1 h [43]. As-prepared β-Fe2O3 powder was then deposited on fluorine-doped tin oxide (FTO) glass by electrophoretic deposition to prepare the particle-assembled films. In the case of necking treatment for the particle-assembled β-Fe2O3 films, 0.2 μmol of TiCl4 in methanol solution was dropped on the particle-assembled β-Fe2O3 films. Afterward, the films were annealed in a muffle furnace at 600°C (or 650°C) for 1 h.
Raman spectra of the samples were characterized with a confocal laser Raman spectrometer (Japan, Horiba, LabRAM Aramis, calibrated with silicon). Except for Fig. 1, all of the Raman spectra data acquisition used a 785 nm laser as the excitation source. Except for Fig. 3, all of the Raman spectra data acquisition used a 0.4 mW power laser as the excitation source. Raman imaging was obtained using a 785 nm, 0.4 mW laser. All laser-induced phase-change samples were confirmed using a 785 nm laser as the excitation source before laser irradiation to ensure that the samples contained no α-Fe2O3. The phosphor spectrum calculations were calculated in Material Studio with the Local Density Approximate, using the norm-conserving situation.
Density functional theory calculations on Zr-doped β-Fe2O3 were implemented in the VASP (Vienna Ab-initio Simulation Package) with a projected-augmented-wave method in the scheme of generalized-gradient approximation, whereas the strong on-site Coulomb repulsion among the localized Fe 3d electrons was described with the generalized-gradient approximation +U approach (‘U’ is ‘the strength of the on-site Coulomb interaction’).
SEM images were obtained on an SEM (Germany, Zessis, Ultra 55) and SAED images of the samples were obtained on a TEM (Japan, JEOL, Ltd. JEM2100).
PEC water splitting of the β-Fe2O3 particle-assembled films was carried out in 1 M NaOH solution (pH = 13.6) under AM 1.5 G standard simulated sunlight (American, Newport, Oriel Sol3A, 100 mW cm−2).
Supplementary Material
Acknowledgements
The characterizations were made at the Collaborative Innovation Center of Advanced Microstructures in Nanjing University. The numerical calculations were conducted thanks to the access to the IBM Blade cluster system at the High Performance Computing Center (HPCC) of Nanjing University.
Contributor Information
Ningsi Zhang, Collaborative Innovation Center of Advanced Microstructures, National Laboratory of Solid State Microstructures, College of Engineering and Applied Sciences, Nanjing University, Nanjing 210093, China.
Xin Wang, Collaborative Innovation Center of Advanced Microstructures, National Laboratory of Solid State Microstructures, College of Engineering and Applied Sciences, Nanjing University, Nanjing 210093, China.
Jianyong Feng, Collaborative Innovation Center of Advanced Microstructures, National Laboratory of Solid State Microstructures, College of Engineering and Applied Sciences, Nanjing University, Nanjing 210093, China.
Huiting Huang, Collaborative Innovation Center of Advanced Microstructures, National Laboratory of Solid State Microstructures, College of Engineering and Applied Sciences, Nanjing University, Nanjing 210093, China.
Yongsheng Guo, Collaborative Innovation Center of Advanced Microstructures, National Laboratory of Solid State Microstructures, College of Engineering and Applied Sciences, Nanjing University, Nanjing 210093, China.
Zhaosheng Li, Collaborative Innovation Center of Advanced Microstructures, National Laboratory of Solid State Microstructures, College of Engineering and Applied Sciences, Nanjing University, Nanjing 210093, China; Jiangsu Key Laboratory of Nano Technology, Nanjing University, Nanjing 210093, China.
Zhigang Zou, Collaborative Innovation Center of Advanced Microstructures, National Laboratory of Solid State Microstructures, College of Engineering and Applied Sciences, Nanjing University, Nanjing 210093, China; Jiangsu Key Laboratory of Nano Technology, Nanjing University, Nanjing 210093, China.
FUNDING
This work was supported by the National Key Research and Development Program of China (2018YFA0209303), the National Natural Science Foundation of China (U1663228, 51902153 and 51972165) and a project funded by the Priority Academic Program Development of Jiangsu Higher Education Institutions.
Conflict of interest statement. None declared.
REFERENCES
- 1. Notzel R. InN/InGaN quantum dot electrochemical devices: new solutions for energy and health. Natl Sci Rev 2017; 4:184–95. [Google Scholar]
- 2. Li Z, Luo W, Zhang M. et al. Photoelectrochemical cells for solar hydrogen production: current state of promising photoelectrodes, methods to improve their properties, and outlook. Energy Environ Sci 2013; 6: 347–70. [Google Scholar]
- 3. Han H, Li C. Photocatalysis in solar fuel production. Natl Sci Rev 2015; 2: 145–7. [Google Scholar]
- 4. Young JL, Steiner MA, Döscher H. et al. Direct solar-to-hydrogen conversion via inverted metamorphic multi-junction semiconductor architectures. Nat Energy 2017; 2: 17028. [Google Scholar]
- 5. Yang Y, Niu S, Han D. et al. Progress in developing metal oxide nanomaterials for photoelectrochemical water splitting. Adv Energy Mater 2017; 7: 1700555. [Google Scholar]
- 6. Pan L, Kim JH, Mayer MT. et al. Boosting the performance of Cu2O photocathodes for unassisted solar water splitting devices. Nat Catal 2018; 1: 412–20. [Google Scholar]
- 7. Feng J, Huang H, Fang T. et al. Defect engineering in semiconductors: manipulating nonstoichiometric defects and understanding their impact in oxynitrides for solar energy conversion. Adv Funct Mater 2019; 29: 1808389. [Google Scholar]
- 8. Warren SC, Voïtchovsky K, Dotan H. et al. Identifying champion nanostructures for solar water-splitting. Nat Mater 2013; 12: 842–9. [DOI] [PubMed] [Google Scholar]
- 9. Li Z, Feng J, Yan S. et al. Solar fuel production: strategies and new opportunities with nanostructures. Nano Today 2015; 10: 468–86. [Google Scholar]
- 10. Pendlebury SR, Wang X, Le Formal F. et al. Ultrafast charge carrier recombination and trapping in hematite photoanodes under applied bias. J Am Chem Soc 2014; 136: 9854–7. [DOI] [PMC free article] [PubMed] [Google Scholar]
- 11. Sivula K, Van De Krol R. Semiconducting materials for photoelectrochemical energy conversion. Nat Rev Mater 2016; 1: 15010. [Google Scholar]
- 12. Walter MG, Warren EL, McKone JR. et al. Solar water splitting cells. Chem Rev 2010; 110: 6446–73. [DOI] [PubMed] [Google Scholar]
- 13. Kment S, Riboni F, Pausova S. et al. Photoanodes based on TiO2 and α-Fe2O3 for solar water splitting—superior role of 1D nanoarchitectures and of combined heterostructures. Chem Soc Rev 2017; 46: 3716–69. [DOI] [PubMed] [Google Scholar]
- 14. Le Formal F, Pastor E, Tilley SD. et al. Rate law analysis of water oxidation on a hematite surface. J Am Chem Soc 2015; 137: 6629–37. [DOI] [PMC free article] [PubMed] [Google Scholar]
- 15. Zhu Y, Qian Q, Fan G. et al. Insight into the influence of high temperature annealing on the onset potential of Ti-doped hematite photoanodes for solar water splitting. Chin Chem Lett 2018; 29: 791–4. [Google Scholar]
- 16. Cheng W, Richter MH, May MM. et al. Monolithic photoelectrochemical device for direct water splitting with 19% efficiency. ACS Energy Lett 2018; 3: 1795–800. [Google Scholar]
- 17. Klahr B, Gimenez S, Fabregat-Santiago F. et al. Electrochemical and photoelectrochemical investigation of water oxidation with hematite electrodes. Energy Environ Sci 2012; 5:7626–36. [Google Scholar]
- 18. Klahr B, Gimenez S, Fabregat-Santiago F. et al. Water oxidation at hematite photoelectrodes: the role of surface states. J Am Chem Soc 2012; 134: 4294–302. [DOI] [PubMed] [Google Scholar]
- 19. Zhao X, Feng J, Wang N. et al. The influence of Ti doping on morphology and photoelectrochemical properties of hematite grown from aqueous solution for water splitting. Energy Technol 2018; 6: 2188–99. [Google Scholar]
- 20. Liang Q, Guo Y, Zhang N. et al. Improved water-splitting performances of CuW1−xMoxO4 photoanodes synthesized by spray pyrolysis. Sci China Mater 2018; 61: 1297–304. [Google Scholar]
- 21. Fang T, Huang H, Feng J. et al. Exploring facile strategies for high-oxidation-state metal nitride synthesis: carbonate-assisted one-step synthesis of Ta3N5 films for solar water splitting. Sci Bull 2018; 63: 1404–10. [DOI] [PubMed] [Google Scholar]
- 22. Chen Q, Fan G, Fu H. et al. Tandem photoelectrochemical cells for solar water splitting. Adv Phys X 2018; 3: 1487267. [Google Scholar]
- 23. Wang Z, Mao X, Chen P. et al. Understanding the roles of oxygen vacancies in hematite‐based photoelectrochemical processes. Angew Chem 2019; 131: 1042–6. [DOI] [PubMed] [Google Scholar]
- 24. Xu YF, Wang XD, Chen HY. et al. Toward high performance photoelectrochemical water oxidation: combined effects of ultrafine cobalt iron oxide nanoparticle. Adv Funct Mater 2016; 26: 4414–21. [Google Scholar]
- 25. Qiu Y, Leung SF, Zhang Q. et al. Efficient photoelectrochemical water splitting with ultrathin films of hematite on three-dimensional nanophotonic structures. Nano Lett 2014; 14: 2123–9. [DOI] [PubMed] [Google Scholar]
- 26. Marelli M, Naldoni A, Minguzzi A. et al. Hierarchical hematite nanoplatelets for photoelectrochemical water splitting. ACS Appl Mater Interfaces 2014; 6: 11997–2004. [DOI] [PubMed] [Google Scholar]
- 27. Hou Y, Zuo F, Dagg A. et al. Visible light-driven α-Fe2O3 nanorod/ graphene/BiV1–xMoxO4 core/shell heterojunction array for efficient photoelectrochemical water splitting. Nano Lett 2012; 12: 6464–73. [DOI] [PubMed] [Google Scholar]
- 28. Wang L, Nguyen NT, Huang X. et al. Hematite photoanodes: synergetic enhancement of light harvesting and charge management by sandwiched with Fe2TiO5/Fe2O3/Pt structures. Adv Funct Mater 2017; 27: 1703527. [Google Scholar]
- 29. Hufnagel AG, Hajiyani H, Zhang S. et al. Why tin‐doping enhances the efficiency of hematite photoanodes for water splitting—the full picture. Adv Funct Mater 2018; 28: 1804472. [Google Scholar]
- 30. Malviya KD, Dotan H, Shlenkevich D. et al. Systematic comparison of different dopants in thin film hematite (α-Fe2O3) photoanodes for solar water splitting. J Mater Chem A 2016; 4: 3091–9. [Google Scholar]
- 31. Malara F, Fabbri F, Marelli M. et al. Controlling the surface energetics and kinetics of hematite photoanodes through few atomic layers of NiOx. ACS Catal 2016; 6: 3619–28. [Google Scholar]
- 32. Wang CW, Yang S, Fang WQ. et al. Engineered hematite mesoporous single crystals drive drastic enhancement in solar water splitting. Nano Lett 2015; 16: 427–33. [DOI] [PubMed] [Google Scholar]
- 33. Sabba D, Kumar MH, Wong LH. et al. Perovskite–hematite tandem cells for efficient overall solar driven water splitting. Nano Lett 2015; 15: 3833–9. [DOI] [PubMed] [Google Scholar]
- 34. Sun Y, Chemelewski WD, Berglund SP. et al. Antimony-doped tin oxide nanorods as a transparent conducting electrode for enhancing photoelectrochemical oxidation of water by hematite. ACS Appl Mater Interfaces 2014; 6: 5494–9. [DOI] [PubMed] [Google Scholar]
- 35. Zhang N, Guo Y, Wang X. et al. A beta-Fe2O3 nanoparticle-assembled film for photoelectrochemical water splitting. Dalton Trans 2017; 46: 10673–7. [DOI] [PubMed] [Google Scholar]
- 36. Liang Y, van de Krol R. Influence of Si dopant and SnO2 interfacial layer on the structure of the spray-deposited Fe2O3 films. Chem Phys Lett 2009; 479: 86–90. [Google Scholar]
- 37. Rahman MM, Jamal A, Khan SB. et al. Fabrication of chloroform sensor based on hydrothermally prepared low-dimensional β-Fe2O3 nanoparticles. Superlattices Microstruct 2011; 50: 369–76. [Google Scholar]
- 38. López-Sánchez J, Serrano A, Del Campo A. et al. Sol–gel synthesis and micro-Raman characterization of ϵ-Fe2O3 micro-and nanoparticles. Chem Mater 2016; 28: 511–8. [Google Scholar]
- 39. El Mendili Y, Bardeau JF, Randrianantoandro N. et al. Insights into the mechanism related to the phase transition from γ-Fe2O3 to α-Fe2O3 nanoparticles induced by thermal treatment and laser irradiation. J Phys Chem C 2012; 116: 23785–92. [Google Scholar]
- 40. Danno T, Nakatsuka D, Kusano Y. et al. Crystal structure of β-Fe2O3 and topotactic phase transformation to α-Fe2O3. Cryst Growth Des 2013; 13: 770–4. [Google Scholar]
- 41. Hu Y, Wu Y, Feng J. et al. Rational design of electrocatalysts for simultaneously promoting bulk charge separation and surface charge transfer in solar water splitting photoelectrodes. J Mater Chem A 2018; 6: 2568–76. [Google Scholar]
- 42. Fang T, Huang H, Feng Jet al. . Reactive inorganic vapor deposition of perovskite oxynitride films for solar energy conversion. Research 2019; 2019: 9282674. [DOI] [PMC free article] [PubMed] [Google Scholar]
- 43. Danno T, Asoka H, Nakanishi M. et al. Formation mechanism of nano-crystalline β-Fe2O3 particles with bixbyite structure and their magnetic properties. J Phys Conf Ser 2010; 200: 082003. [Google Scholar]
Associated Data
This section collects any data citations, data availability statements, or supplementary materials included in this article.


