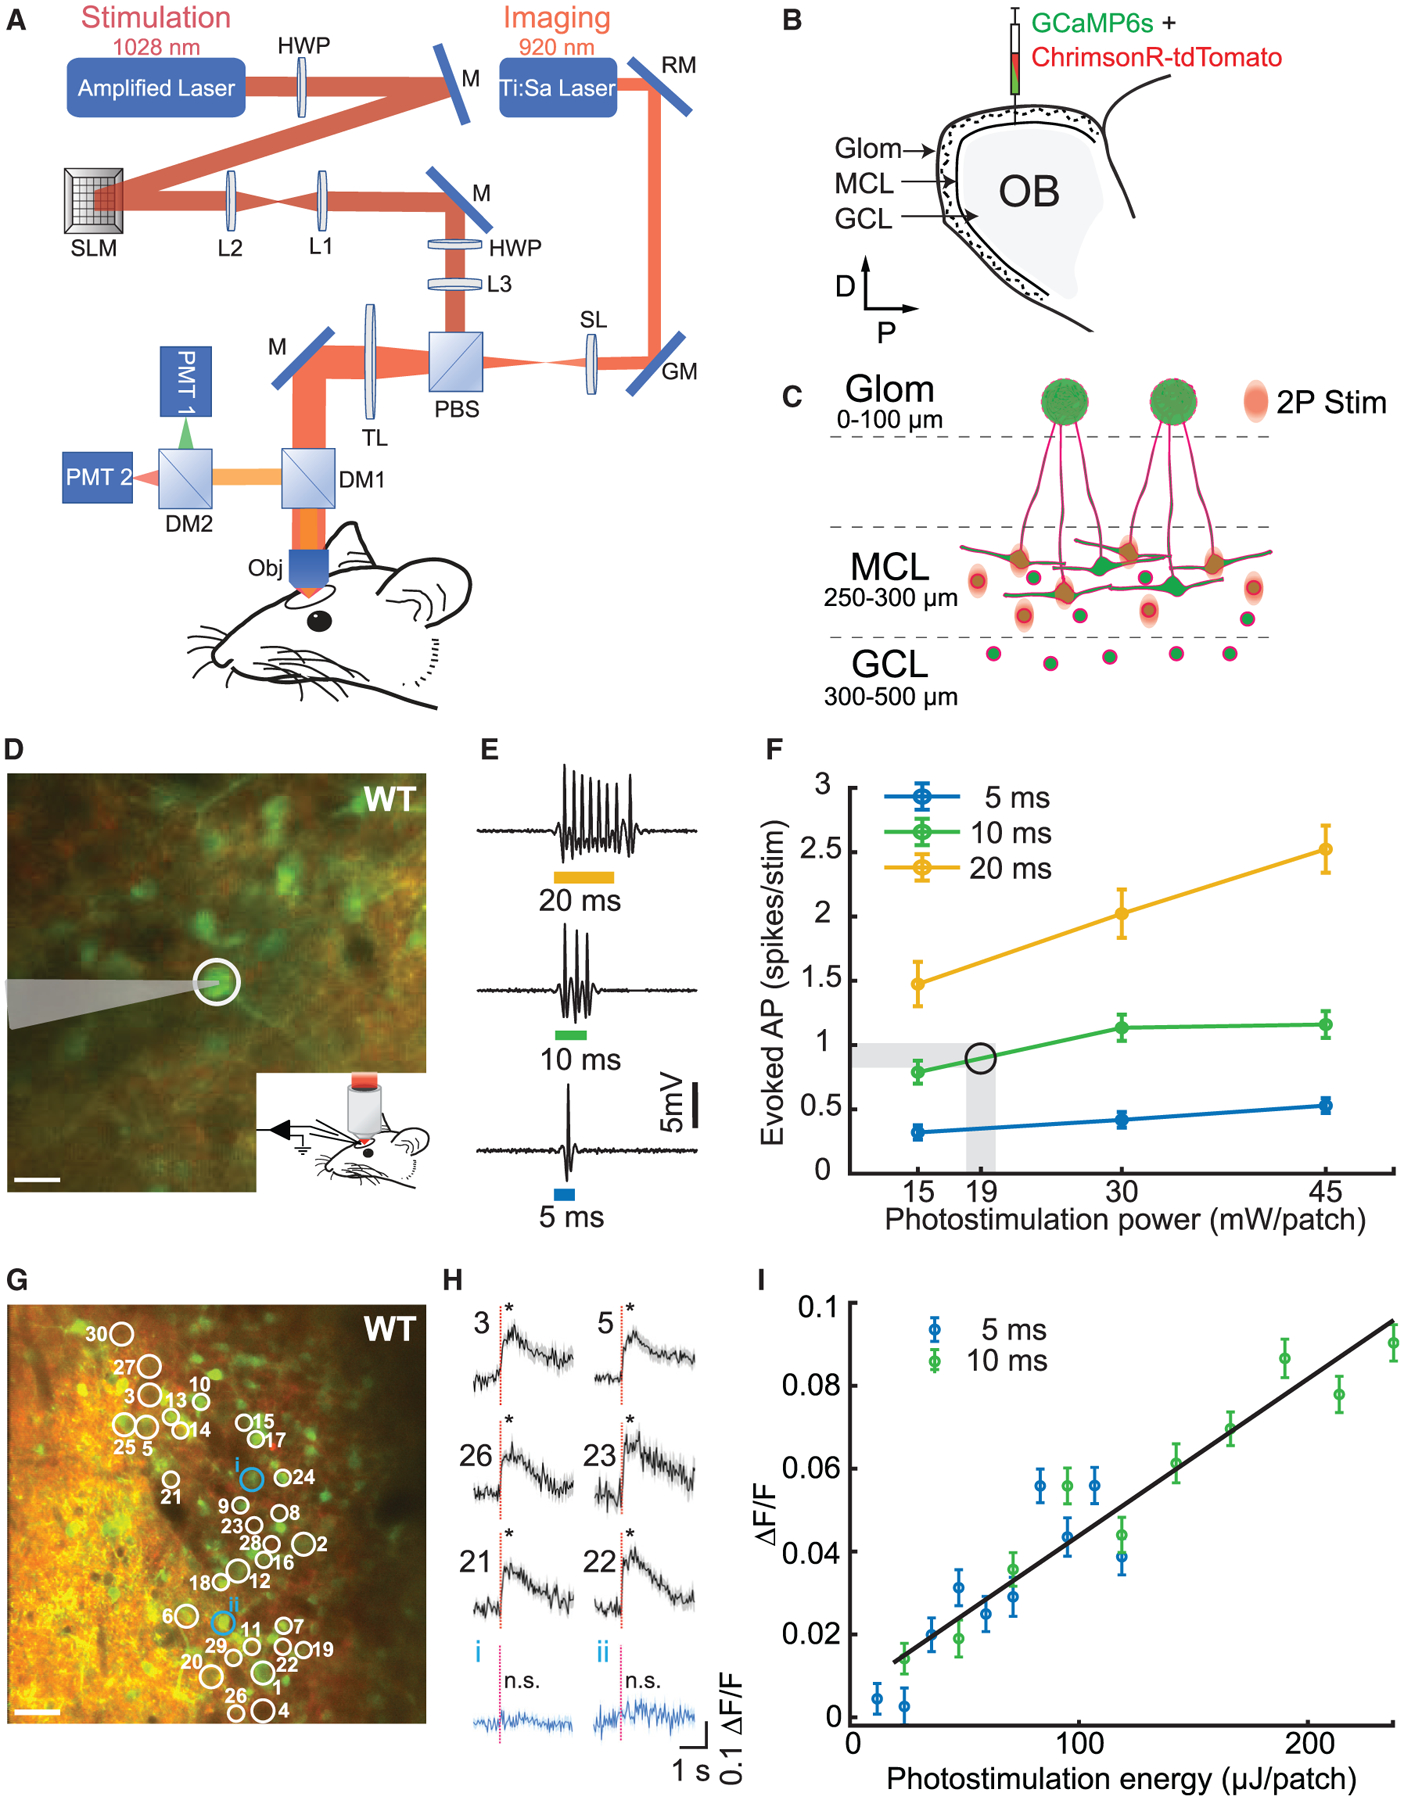
Figure 1. All-Optical Imaging and Photostimulation.

(A) Layout of the optical system combining a 2P imaging path and scanless holographic 2P photostimulation path for experiments in a head-fixed mouse with a cranial window. DM1, DM2, dichroic mirrors; GM, galvanometer; HWP, half-wave plate; L1–L3, lenses; M, mirror; Obj, 16× objective; PBS, polarizing beamsplitter; PMT1, PMT2, photomultiplier tubes; RM, resonant mirror; SL, scan lens; SLM, spatial light modulator; TL, tube lens.
(B) Injection of viruses into the mitral cell layer (MCL) and the granule cell layer (GCL) in the olfactory bulb (OB).
(C) Schematic of 2P photostimulation patches targeted to the MCL of the OB. Large neurons, mitral cells; circles, granule cells; green, GCaMP6s; red, ChrimsonR-tdTomato.
(D) 2P guided cell-attached electrophysiological recording in an awake WT mouse MCL co-expressing ChrimsonR-tdTomato (red) and calcium indicator GCaMP6s (green). The cell (white circle) was targeted by a light patch (scale bar, 20 μm).
(E) Examples of electrophysiological recordings during 5, 10, and 20 ms photostimulation.
(F) Average number of evoked spikes as a function of power per cell for different stimulation durations (mean ± SEM; n = 5 cells in 5 WT mice). Shaded area and circle indicate the working zone chosen to elicit ≤1 evoked action potential (19 ± 1 mW/patch).
(G) Thirty neurons were targeted for simultaneous 2P photostimulation (white circles) and 2P imaging (scale bar, 40 μm).
(H) Average GCaMP6s fluorescence response to photostimulation (red dashed line, stimulation onset) for 30 targeted cells (6 examples; black) and 2 example non-targeted cells (blue) for an example WT mouse (mean ΔF/F ± SEM; *p < 0.05; two-sample t test; 30 trials; 10 ms stimulation duration; 0.1 mW/μm2; 18 mW/patch; additional data in Figure S5).
(I) Average evoked fluorescence response as a function of photostimulation energy for 5 and 10 ms durations (mean ΔF/F ± SEM; 20 cells; 40 trials/data point; n = 1 WT mouse).
