

Abstract
Visual information is a critical component in the evaluation and communication of patient medical information. As display technologies have evolved, the medical community has sought to take advantage of advances in wider color gamuts, greater display portability, and more immersive imagery. These image quality enhancements have shown improvements in the quality of healthcare through greater efficiency, higher diagnostic accuracy, added functionality, enhanced training, and better health records. However, the display technology advances typically introduce greater complexity in the image workflow and display evaluation. This paper highlights some of the optical measurement challenges created by these new display technologies and offers possible pathways to address them.
Keywords: Display measurements, Color gamut, Ambient performance, Dynamic range, Augmented reality, Virtual reality, Mixed reality, Visual fatigue, Telemedicine
Introduction
Medical images are widely used to view the human body in order to diagnose, monitor, or treat medical conditions. The use of color images has dramatically expanded with telemedicine, and in clinical specialties like dermatology, ophthalmology, surgery, pathology, and gastroenterology. The quality of these images may vary widely, depending on the intended use. In radiology, images are often used to make diagnostic decisions, which require high image quality, whereas lower quality images for electronic health records may be sufficient. The observed digital image is largely limited by the image capture process, but it can also be impacted by image processing and the display’s capability. The same captured image may appear quite different in a darkened room on a well calibrated workstation display versus a tablet or cell phone display viewed outdoors. Therefore, it is important to understand the influence of the image workflow and the display’s characteristics in order to achieve the necessary image quality. Recent advances in wide color gamut displays, mobile displays, and near-eye displays (or head-mounted displays) have improved image quality and expanded our ability to review or utilize the images in more diverse ways. This paper focuses on the measurement challenges in evaluating these new technologies. But prior to doing so, it is useful to understand the impact of the display in context to the overall image workflow.
An example image workflow is demonstrated by the medical photography workflow illustrated in Fig. 1 [1]. The figure highlights the three major processes where the image quality is impacted; image capture, image processing, and image rendering (in the case of displays). In this example, a commercial digital camera captures a scene and typically applies adjustments to the image to produce a more pleasing reproduction. The quality of the image captured depends on the scene illumination and the camera [2]. Many simple point-and-shoot cameras store the image in standard compressed formats such as Joint Photographic Experts Group (JPEG) and Tag Image File Format (TIFF). However, these compressed formats generally include image enhancements encoded into the data, and the colors are typically processed to be encoded in a standard output-referred color space such as sRGB [3]. But some image capture (and video capture) devices can also capture images (such as RAW files) with minimal enhancements. This is helpful when true color calibration is desired.
Fig. 1.

Example of a generic digital color image process, from image capture to the rendering of the image
The computer color management and viewing software can impact the rendered image by applying color corrections and tone curve enhancements. Since it is not generally known during the image capture process how the image will be printed or displayed, the computer can serve as the means by which the captured image is transformed to provide the intended output. If the intent is to accurately reproduce the original scene, then the computer needs information on how the captured image was processed and the capabilities of the output device. Standards such as ISO 15076–1 use International Color Consortium (ICC) profiles of the input and output devices to provide the best possible reproduction of the original scene [4]. However, in order for this framework to work properly, the profiles of the input and output devices must be known, and the viewing software should be able to utilize this information.
Although the information in the final observed image is ultimately limited by the quality of the captured image, the perceived information can be further limited by the viewing conditions and the characteristics of the display. Some of the fundamental characteristics of the display can be described by the display profile, which the viewing software may utilize to optimize the image quality. However, modern displays can exhibit complex attributes that may not be adequately represented by the display profile. For example, how the display responds to background illumination can further impact the perceived image quality. This may not be addressed by the display’s ambient sensor or viewing software.
The display serves as a key component to the image process flow described in Fig. 1. The display industry has rapidly evolved in order to improve the quality of the perceived image. But in some cases, the speed of technology improvements has outpaced the metrology on how best to quantify their impact on image quality. For example, impressive advances have been introduced to reduce surface reflections, and expand the range of colors. This allows images to be viewed in more challenging lighting environments and improves the viewer’s readability and usability. To help with these challenges, the American Association of Physicists in Medicine (AAPM) has developed standard guidelines for practicing medical professionals to evaluate grayscale displays, but had limited guidance on mobile and color displays [13, 53, 54, 62]. Industry consensus on how best to evaluate these improvements is still not well established. This paper highlights some of these display advances relative to the needs of medical imaging, describes the measurement challenges of these technologies, and identifies leading approaches for evaluating their impact on image quality.
We first highlight the fact that display characteristics can change with the content to be rendered. Some of this is rooted in the physics of the technology, but much of it is related to the content-aware image processing internal to the display. This requires that the test conditions consider the intended application to better predict the resulting performance. We next address how efforts to improve color image quality through new color display technology and advanced color management require new color metrics and better instrumentation. More sophisticated methods are needed to characterize wide color gamut displays. We then discuss how the fundamental visual characteristics of the display are impacted by the ambient illumination environment. Since indoor and outdoor lighting often involves multiple sources, we discuss the need for a measurement methodology that can better represent the display performance under more complex lighting environments. And finally, we review the measurement challenges of emerging near-eye display technologies. These technologies require substantially different instrumentation, setup conditions, and measurement methods than flat panel displays.
Image Content-Sensitive Performance
In the days of cathode ray tube (CRT) displays, it was well known that the performance of the display depended on the amount and type of content that was rendered. For example, the maximum luminance could depend on the fraction of the screen that was rendered. This was related to the physical limitations of the drive electronics. It was then necessary to consider and specify the test pattern carefully when characterizing the display performance. However, as liquid crystal displays (LCDs) began to dominate the display market, the concerns about test pattern-dependent performance began to subside. The first generation of LCDs had fixed intensity backlights that filled the screen area. Since the maximum luminance of the LCD was effectively dictated by the backlight, the rendered test pattern did not have a significant effect on the display performance.
Recent advances in local dimming backlights for LCDs, and the advent of organic light emitting diode displays (OLEDs) and inorganic light emitting diode (LED) displays, have made it necessary to reconsider the test pattern dependence. The performance of these technologies can be image content-dependent [9]. In the case of OLED displays, the implementation of the technology can produce electronic limitations where the luminance at a position on the screen may decrease as more display pixels are turned on. Similarly with local dimming LCDs, the luminance may change with emitted area as more backlight zones are turned on. Manufacturers of these technologies can also utilize real-time content aware image processing to adjust display performance.
An example of content-dependent display performance is shown in Fig. 2. The bottom graph in Fig. 2 shows the white luminance measured in the center of an OLED display which has red, green, and blue sub-pixels (RGB display). The amount of content is expressed in terms of the relative amount of pixels activated in the encoded input image, where 100% represents a full white screen. The blue curve shows the reduction in the white luminance of the simple white box pattern (illustrated in the inset of the top figure) as the size of the white box increases until it fills the entire screen. LCDs with local dimming can also exhibit similar behavior. The red line shows a similar reduction in the OLED white luminance of the center white box using a red, green, blue, cyan, magenta, yellow, and white (RBGCMYW) multi-color pattern surrounding the center box (as shown by the pattern in the inset of the top figure figure). Therefore, the contrast ratio of this display will vary depending on how much content is rendered on the screen. The top graph in Fig. 2 shows a center white luminance dependence on image content for an OLED display with red, green, blue, and white sub-pixels (RGBW display). In this case, the luminance behavior was different for the simple box and RBGCMYW multi-color pattern. The next section will also demonstrate the influence of display content dependence in measuring color gamut. Therefore, not only is the amount of image content important, it is also necessary that the test pattern uses a good sampling of the display gamut to best simulate the actual use case. Since many images contain a range of colors, it is expected that the RBGCMYW multi-color test pattern would be more representative of the display performance for typical images than a single color pattern. Recent international display standards have recognized that display performance can have this content-sensitive dependence and have stipulated using a RBGCMYW multi-color test pattern similar to that shown in Fig. 3 for critical center screen measurements [12].
Fig. 2.
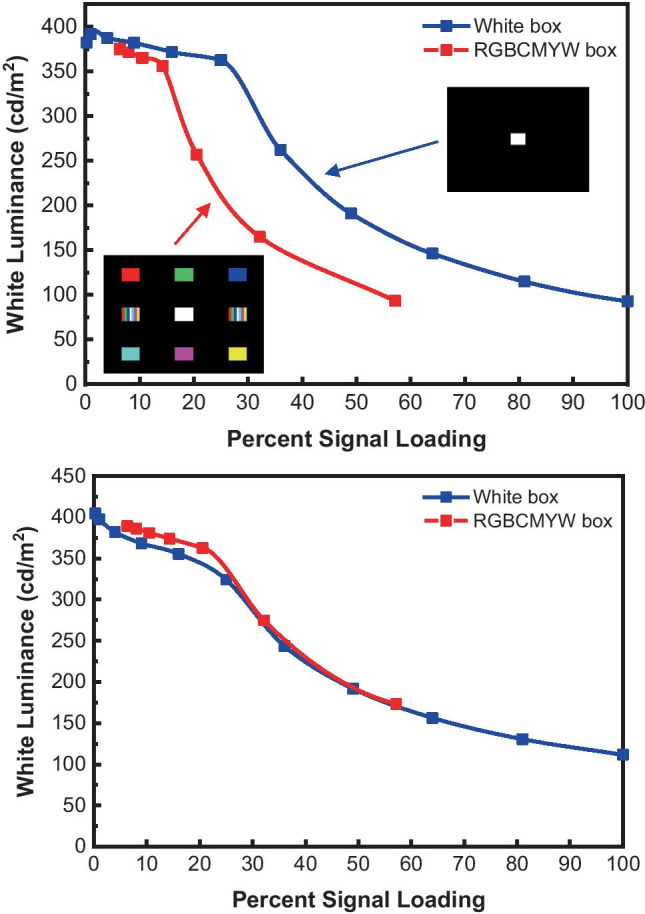
White luminance dependence on screen content of an RGBW (top) and RGB (bottom) OLED display for a simple center box pattern and a multi-color pattern
Fig. 3.

Example of RBGCMYW multi-color test pattern with 25% APL used for center screen measurements. See [12] for details
The display industry recognizes the content-dependent performance of displays by evaluating important luminance and color characteristics at specific average picture levels (APLs) [10]. The input signal APL is expressed as the percentage of effective white pixels turned on in the screen relative to the entire active area of the screen, where all pixels driven at full white would have an APL of 100%. This image content-dependent performance complicates the evaluation of the display. Some standards have addressed this issue by evaluating the display using an APL that is typical of the content used for the intended application. For example, statistical sampling of broadcast TV content was observed to have an input signal APL of 34% [10] and about 41% of digital camera color images [11]. For grayscale radiological images, the APL is expected to be within that range or lower. Based on these guidelines, the display industry is moving away from full screen measurements and is starting to adopt RBGCMYW multi-color test patterns with an APL of about 25%, as illustrated in Fig. 3 [12].
As demonstrated in Fig. 2, the APL value that is used for characterizing the display can have a significant impact on the measured luminance and color. This test pattern dependence is most likely to be observed in consumer grade displays, For primary image review on diagnostic monitors, where the grayscale standard display function (GSDF) is widely used, this may not be an issue at the moment because these new technologies are not widely implemented. However, it highlights the danger in adhering to legacy measurement methods as new display technologies are introduced.
Wide Color Gamut
Digital color images and color displays are now ubiquitous. However, the different medical imaging specialties do not have a consistent approach toward how each handles color images. This is due in part to whether the specialty is focused more on color accuracy (output image reproduces the input image) or color consistency (e.g. pseudo-color visualization of data, fused images) [13]. Color accuracy has become increasingly important with to the transition to digital imaging systems while maintaining the input color information, which includes areas such as endoscopy, laparoscopy, ophthalmology, dermatology, and medical photography [13]. Similarly, color consistency is critical for ensuring color image quality across different medical devices, as has been shown for whole slide imaging [64] and ophthalmology [13]. In both cases, the image capture, color processing, and the display used to render the image impact the perceived color quality. In applications such as telemedicine and medical photography, it has been shown that the color error produced by the medical image workflow is dominated by the color camera image capture process [14].
For diagnostic applications, the medical display industry has largely adopted the Digital Imaging and Communications in Medicine (DICOM) standard in order to better observe small changes in grayscale differences [5, 55]. The standard introduced a GSDF with a grayscale tone curve where sequential increases in the input drive gray level produced equal increases in the perceived brightness measured in units of Just Noticeable Difference (JND) [6, 7]. These grayscale images have proven to be very valuable over the decades. But when viewing DICOM images, it is useful to overlay color information on the grayscale image, or view a color image in a separate window. However, the GSDF tone curve is quite different from the standard tone curves used for color images. A common color space used by digital cameras and office monitors is the sRGB color space [3], which is often used when color accuracy is important. It was demonstrated that monitors which had a DICOM GSDF calibration produced relatively large color errors when rendering color images directly. These color errors can be substantially reduced if proper camera and display calibrations are performed, and color management is utilized in the workflow [1][14]. For many color displays, when color management is not used (for example a color image that does not contain a profile), it is often assumed by the operating system to be sRGB. Therefore, in order to improve color performance, especially when rendering images with different tone curves, the user needs to assure that a color management system is used and the profile of the display is accurate. The display setup (display setting or preset) determines the display profile. Therefore, it is critical to recognize that not only is the display setup an important factor when characterizing the display performance, it can significantly impact the overall color management performance.
Aside from the color processing issues that still need to be resolved for achieving consistent color medical images, the range of colors that can be rendered to the viewer is dictated by the native color gamut of the display. The sRGB color space has long served as the benchmark for displays that could achieve moderate color capability. However, as indicated by the Commission Internationale de l’Eclairage (CIE) 1931 chromaticity diagram in Fig. 4, the sRGB color space is not able to represent the many surface colors of real objects [15]. Recently, the wider color gamut of BT.2020 was introduced to achieve better coverage over the real object colors [16]. Modern displays can now often achieve color coverage beyond the sRGB color space, but achieving BT.2020 is still difficult, typically requiring narrow bandwidth light sources like lasers.
Fig. 4.

Comparison of the sRGB and BT.2020 color space relative to the range of real surface colors. The range of colors that can be perceived by the Human Visual System (HVS) is indicated by the colors enclosed by the horseshoe-shaped boundary
Technological advancements in wide color gamut display technologies have also challenged our ability to characterize wide color gamut displays. Narrower bandwidth light sources generally require spectroradiometers that can resolve the sharper spectra. If laser light sources are used, then the measurement instruments must minimize their sensitivity to polarization, speckle, and stray light. Methods have been developed to address these aspects, including a spectral stray light correction method that substantially improved the measurement of color accuracy by reducing the stray light background by 1 to 2 orders of magnitude [17].
In another effort to extend the color capability of displays, some manufacturers have introduced multi-primary displays that include colors beyond the traditional red, green, and blue primaries. Some display technologies have also included a white sub-pixel to improve power efficiency and increase white brightness. However, these multi-primary architectures often increase luminance at the expense of color fidelity. All encoding color spaces assume that the inputs to the display will create luminance outputs that will sum up together to generate the intended color. The standard encoding color spaces use this principle of colorimetric additive mixing. For example, equal input signals to the red, green, and blue channels should produce a white color that is well defined by the encoded color space. However, the current use of display look-up tables (LUTs) and multi-primary architectures means that colorimetric additive mixing cannot be assumed [9]. It has been shown that multi-primary displays may not follow additivity, and that single color test patterns can overestimate the luminance and color performance of real images [18]. A simple (necessary but not conclusive) test for checking additivity in displays is the color-signal white (CSW) method published in Sect. 5 of the Information Display Measurements Standard (IDMS) [8]. The CSW method measures the flux or luminance of the RGB primary colors in a multi-color test pattern at their maximum input signal and sums their values. If a measurement of the maximum white value for that display differs from the CSW sum, then the display does not exhibit additivity. In that case, it is likely that the intended colors in an image input to the display will not be rendered accurately.
The additivity of a display system affects how color capability should be evaluated. Legacy displays generally exhibited additivity, and their color capability could be evaluated by using the CIE 1931 chromaticity diagram, or the CIE 1976 uniform chromaticity scale (UCS) diagram. Display color capability was often estimated by simply measuring the chromaticities of the display’s RGB primaries and calculating the triangular area bounded by those primaries. Recent work demonstrated that an estimation of the display perceived color capability was better correlated using the CIE 1931 chromaticity diagram [66]. But this approach assumed that all of the other colors follow additivity. If additive mixing no longer holds, this traditional practice of measuring the triangular area in chromaticity diagrams may not be adequate. A graphic example of this is given in Fig. 5. In this example, a large number of color measurements were taken over the gamut of a projector which had a white segment in addition to the normal red, green, blue colors (RGBW configuration). The color capability of this display clearly cannot be represented by the simple triangular area formed by the RGB primary colors. The lack of additivity for this display is also indicated by a large difference of the white intensity compared to the CSW sum.
Fig. 5.

Example demonstrating the lack of additivity of the display in the CIE 1931 chromaticity diagram. The measured colors of the display (black dots) are compared to the colored dots of an ideal sRGB display that form a triangular shape
Even displays that have similar chromaticity gamut areas can have different perceived color capability. A more accurate method for characterizing the perceived color capability of displays is to measure the CIE L*a*b* (CIELAB) color gamut volume [19][67]. The CIELAB color space includes the influence of brightness to better represent our perception of color. By adequately sampling the range of display colors and transforming the raw color measurements to the perceptually uniform 3-D CIELAB color space, any assumptions about the color processing can be avoided, and lead to a better estimate of the HVS response to the colors. If sufficient colors are measured, the volume of the color space can be calculated without assuming additivity. However, if the white luminance of the display is substantially higher than the CSW luminance, then the color gamut volume of the display will be reduced. The HVS adapts to the peak brightness in the image. If the white level is boosted beyond what is expected with additive color mixing (the CSW value), then the color will appear dimmer with a reduced color capability. The value of using the CIELAB color gamut volume to evaluate a display perceived color capability under darkroom conditions has been recognized in recent international display measurement standards [12].
An example of non-additive mixing is illustrated in Fig. 6 for an LCD display with an additional white sub-pixel (RGBW display). The top plot shows that the triangle formed by the RGB chromaticities of the RGBW display exceed the chromaticity gamut area of the sRGB color space indicated by the blue triangle. This suggests that the color capability of the RGBW display is larger than the sRGB color space. However, the middle plot demonstrates that the actual perceived color capability of the RGBW display in CIELAB color space is 40% lower than the reference sRGB color space identified by the fainter shape. Therefore, the color capability of the RGBW LCD display cannot be accurately represented using the chromaticity gamut area. This may have been predicted by the CSW method, since the white luminance of the display was found to be much higher than the CSW value, indicating non-additive behavior.
Fig. 6.

Example of color gamut evaluated for a RGBW LCD display. The top graph suggests that the RGBW display should have a larger color capability compared to the sRGB color space when evaluated in the CIE 1931 chromaticity diagram. The middle graph demonstrates that the RGBW LCD actually has a smaller color capability relative to sRGB when evaluated in the CIELAB color space. The gamut rings diagram in the bottom plot is a 2D representation of the gamut volume relative to the reference sRGB color space (dashed line)
Since it is often difficult to recognize the amount of overlap of the measured CIELAB gamut volume with a target color space in the 3D plot, the “gamut rings” diagram developed by Masaoka provides visualization of the color capability that directly correlates to the color gamut volume [68]. An example of the “gamut rings” diagram is given at the bottom of Fig. 6. The gamut rings diagram unwraps the 3D volumetric data represented in the gamut volume data and lays it flat. Each ring encloses an area equal to the total gamut volume up to the lightness (L*) value of that ring, with the final (L* = 100) ring enclosing an area exactly equal to the total CIELAB gamut volume. The target color space can also be added with just the final ring, as shown by the dashed line in the bottom diagram of Fig. 6. The red, green, and blue vectors indicate the hue angles of the full-signal RGB primaries.
Another factor that can impact the color capability of the display is the APL loading of the input test pattern used to measure the colors. It was shown in Fig. 2 that the luminance of some displays depends on the amount of content in the image. Since the display creates its color gamut by varying the ratio of the RGB intensities, if the RGB colors do not exhibit the same APL loading behavior, then the color gamut will vary with the amount of image content. This is demonstrated in Fig. 7 for the same RGBW and RGB OLED devices shown in Fig. 2. The top graph in Fig. 7 shows the normalized luminance dependence on APL loading for various center colors rendered by the RGBW display using the RGBCMYW test pattern. Although the APL loading dependence of the RGBW display varied with the test pattern used (see Fig. 2), the dependence was consistent between colors for a given test pattern. This resulted in a chromaticity gamut area that was relatively stable with changes in the image APL loading. The chromaticity gamut area was calculated using the RGB colors in the CIE 1976 chromaticity diagram. The RGB display exhibited a different behavior, as shown in the bottom graph of Fig. 7. In the RGB display case, each color exhibited a different APL dependence, which resulted in a larger chromaticity gamut area variation with the image APL loading. The results from Fig. 7 imply that the RGBW display had a better color calibration than the RGB display, even though the additional white sub-pixel had a more complex color processing task.
Fig. 7.

Comparison of the image content loading behavior of various colors measured on an RGB and RGBW OLED display. The top graph of an RGBW OLED display demonstrates that the various colors have a similar dependence on APL image loading, which resulted in a relatively stable gamut area with APL variation. The percent gamut area was determined by the triangular area formed by the RGB chromaticities relative to the entire area of the spectrum locus of the chromaticity diagram. The bottom graph of the RGB OLED display shows larger variations of the colors with APL image loading, and consequently a larger dependence on the gamut area with the APL variation
The preceding measurement examples highlight the impact that color processing and multi-primary displays can have on the perceived performance. The issues on non-additivity seem to be most prevalent in projection systems, and less so in desktop and mobile devices [20] [21]. Some recent measurements standards have recognized these complexities and have started to address them through realistic test patterns and including a simple additivity test (e.g., CSW) measurement [12].
Ambient Performance
Displays are typically viewed with some ambient background illumination, which impacts the viewing of medical images [56]. The range of ambient environments while viewing images has greatly expanded due to the pervasive use of mobile devices in medicine, such as reviewing radiological images [58, 60, 61] and patient discussions on mobile devices [65]. Since displays generally have a glass or plastic cover sheet, some of the ambient illumination is reflected into the viewer’s field of vision. For reflective displays, most of the reflected light is modulated by the display surface and contains useful information. For emissive displays (like traditional OLEDs and LCDs), the reflected light adds a constant background that reduces the luminance contrast of the information. This background light also adds to the emitted primary colors and tends to wash out color images. Most display manufacturers of smartphones and tablets utilize glossy surfaces with anti-reflective coatings to minimize the surface reflections. However, some of the benefit from anti-reflection coatings are often undone by the introduction of touchscreens and protective screen covers. For mobile displays, the glossy finish is effective in avoiding intense light sources (like the sun) by simply tilting the mirror-like specular reflections away from the viewer field of vision. While initial steps have been taken to develop these measurement methods for mobile medical devices [57], as discussed in the AAPM Task Group 260 report in 2018, the wide diversity in ambient environments present unresolved challenges [62]. In desktop applications, it is not always possible to avoid the specular reflections. Therefore, monitors tend to have anti-glare films to diffuse such reflections. This works reasonably well when the specular light sources are relatively low intensity, as in typical office environments. Both anti-reflection and anti-glare methods can help reduce the negative effects of the ambient background light, but they cannot eliminate them. The ambient light will reduce the contrast and color gamut of displays. Thus, measurement methods are needed to characterize the influence of the ambient lighting environment on the display performance.
In general, the ambient lighting environment will be composed of several light sources. A typical outdoor environment will have the directional light from the sun, and the hemispherical diffuse light from the sky. Each of these sources will have a different spectrum, which may come from different directions. Similarly, for indoor environments, there would be diffuse room lighting and possibly several directional sources (like overhead lights), all with different spectra. In the past, display performance in a given ambient environment was determined by setting up the display under the same illumination that would be used in its application. However, this approach quickly becomes intractable due to the number of lighting scenarios. And for outdoor illumination, it becomes impractical to simulate the necessary light intensities and spectra needed to represent the sun and sky. Therefore, modern methods utilize the fact that display reflections exhibit linear superposition. That is, the reflection characteristics from each light source can be measured separately, then combined numerically to estimate the combined effect of the total lighting environment [22]. This approach was recently extended to include transmission methods that can be used for transparent displays and augmented reality (AR) devices, which overlay images in the visual field of the real scene [23]. Several new display standards now use this approach [24–26].
As an example, let us consider a tablet display to demonstrate the impact of the ambient illumination on performance. The convenience of tablets has greatly expanded their use in viewing medical images. However, unlike the controlled dim lighting environments in hospitals using diagnostic monitors, tablets are often viewed under a wide range of ambient illumination. As shown by the CIE 1931 chromaticity diagram in Fig. 8, the chromaticity area of a typical tablet has its best performance in dark or dim lighting. By measuring the spectral reflectance of the display under a hemispherical diffuse source and a directional light source at 45° inclination, an estimate of the color gamut can be determined for a typical office with 500 lx illumination, and daylight with 80 000 lx of illumination [27]. The indoor illumination creates a noticeable reduction in the color gamut, washing out small color differences. The chromaticity area estimates suggest that the color gamut of this display is virtually unusable in the high illumination outdoor environment. However, a more accurate determination of the loss in the perceived color gamut would be represented in terms of the CIELAB color gamut volume. A similar behavior is obtained in the luminance contrast results. The native luminance contrast ratio of the tablet starts at 883:1 under darkroom conditions, 26:1 for indoor office illumination, and drops to 5.6:1 for the outdoor illumination. This example highlights how ambient lighting can easily overwhelm high contrast and wide color gamut displays. This methodology allows the user to determine what are the maximum illumination conditions that a display could be viewed and still achieve acceptable performance, or evaluate different display technologies on their applicability for specific challenging illumination conditions [28].
Fig. 8.

The chromaticity area of a tablet display is represented in the CIE 1931 chromaticity diagram relative to the sRGB color space. The chromaticity area shrinks as the ambient illumination is increased from a dark room, to indoor, and then outdoor illumination
Near-Eye Displays
Near-eye displays (NEDs) are the newest entrants to the medical industry, typically in the form of a head-mounted display. They are quickly finding applications in surgery planning [29, 30], minimally invasive procedures and surgery [31–35, 63], 3D image segmentation [36], therapy [37–39], and training [40, 41]. This is an emergent field where the terminology, critical performance parameters, and measurement methodologies have yet to be fully developed [42]. But NED characterization techniques are rapidly being established to support NED development, including evaluating transverse chromatic aberrations, color matching in AR, and the lack of occlusion in AR [72][73][74]. As human factor studies further define the requirements for image quality and minimizing visual fatigue, new evaluation methods for measuring these characteristics will be needed [43][44]. In addition, the relevant performance parameters can vary by application, which increases the challenges in developing and characterizing NEDs for medical applications. This section discusses some of the unique measurement considerations that need to be addressed for NEDs, which can be substantially different from flat panel displays.
As with traditional displays, the NED image workflow can have an important impact on the measurement results. It has been shown that the choice and configuration of rendering models and software platforms used to generate the virtual image can produce large differences in the color and contrast characteristics of the NED [75]. In addition, the image generation software needs to be properly recognized by the NED in order to pre-process the input image to correct for device-specific properties (such as optical aberrations) before it is rendered to the viewer. However, there is still a lack of consensus on a standard image workflow for NEDs.
The form, fit, and function of NED devices vary, and the instrumentation needed to characterize them must adequately address these differences. As head-worn devices are placed close to the eye, the size of the light measuring device (LMD) needed to measure the visual performance of these devices must be compact. To simulate the placement and motion of the eye relative to the NED, the LMD should typically be able to move in five axes (3 axes in translation and 2 tilt axes). Therefore, the LMD is often mounted on a 3-axis translation stage with a 2-axis goniometer, or mounted on a robotic arm. This is necessary to properly align the LMD to the NED, translate across the nominal eye pupil position, and scan through the visual field.
A stationary camera aligned to the optical axis of the NED is often used to view the virtual image through the NED and quickly capture the image characteristics over the field of view. Sometimes the camera is co-aligned with another LMD for photometric and or colorimetric measurements. The camera is especially valuable when evaluating the spatial characteristics of the NED virtual image, such as geometric distortion, binocular misalignment, luminance non-uniformity, and spatial resolution. However, the stationary camera is accurate mainly over the viewer’s central vision. This is often sufficient for NEDs designed for a fixed viewing direction, typically in the center of the virtual image. However, a stationary camera does not accurately capture the influence of eye gaze over the field of view. This is particularly important as the NED’s field of views get larger, and when eye tracking is introduced.
When the eye gazes off to one side, the eye pupil rotates about the center of the eye (about 10 mm behind the iris). The impact of eye rotation is minimal for relatively small angles (and small field of view). But for larger gaze angles, the eye pupil goes further off the NED optical axis, potentially inducing additional optical aberrations or clipping part of the visual field. As demonstrated by spatial resolution and geometric distortion measurements of an NED device, scanning the visual field about the LMD entrance pupil (like a stationary camera) can give significantly different results than natural eye rotation [76][45]. In order to properly take into account the influence of eye rotation at larger fields of view, it is necessary to use a goniometric system where the entrance pupil of the measurement instrument pivots about a point 10 mm behind it. These mechanical requirements are fairly unique to NEDs. They are important to have for monocular devices, but essential for binocular devices where position registration is critical to measuring binocular differences.
The optics of the measurement equipment also need to be considered for NEDs. Unlike traditional displays, these head-worn devices render a virtual image to the viewer. The virtual image viewing is illustrated in Fig. 9, where a real image rendered by a display or projector is placed inside the effective focal length of the NED imaging optics, and the lens of the eye is used to form a real image on the retina. In virtual reality (VR) devices, only the virtual image can be observed, with the real world obscured. Augmented reality devices overlay the virtual image on the user’s visual field.
Fig. 9.

Generic ray trace diagram of a basic NED configuration. A real image is formed by a display or projector inside the focal length f for the NED optics, and creates a virtual image. The lens of the eye refocuses that image on the retina. The image can be visible within a certain region (in green) called the eye box
Since NEDs utilize the optics of the human eye to create an image, the measurement equipment must more closely match the eye’s optics to better represent the NED performance. For example, the iris serves as the effective entrance pupil in the human eye and is typically 2 to 5 mm in diameter, depending on the illumination environment. Many NED devices are designed to be within this entrance pupil range. However, traditional luminance meters and colorimeters are designed for measuring traditional display that form real images. These traditional instruments generally have a much larger entrance pupil, which was shown to be inappropriate for measuring NEDs [46]. The measurement instrument needs to have about the same entrance pupil as the human eye in order to capture the correct visual field emitted by NEDs. And the instrument must also accurately represent the luminance and color response of the eye.
NEDs are designed to be worn on the head such that the exit pupil of the NED is centered about the entrance pupil (iris) of the eye. The center of the NED exit pupil position is often called the eye-point and serves as the reference position from which the NED performance is characterized. Therefore, the entrance pupil of the measurement instrument should be placed at the eye-point as a baseline. The eye-point may be well defined by the manufacturer’s optical design, but it is rarely disclosed to the user. Therefore, an experimental method is often needed to determine the eye-point location. Several methods have been proposed, but a methodology has yet to be standardized [47][48].
Figure 10 identifies some of the critical geometric characteristics of a NED device and shows how the eye-point serves as the geometric reference for each eye. The eye-point lies on the eyeline for each eye, pointing to the center of the virtual image. The left and right virtual images are at their respective focal distances, which the eyes focus on. The angle between the left and right eyelines also defines the vergence angle needed for the eyes to see the same virtual point. A mismatch between the vergence angle and focal distance (vergence-accommodation conflict) can be especially important for medical applications, which tend to have relatively small virtual image focal distances [49]. In AR medical applications, such as surgery, the vergence-accommodation conflict is particularly important due to the potential mismatch of virtual and physical objects and can lead to performance errors [59]. However, all of these parameters need to be measured since they all have an impact on the physical and visual comfort of the user.
Fig. 10.

Illustration of important geometric parameters of a NED device
One important characteristic of a NED device that may determine its acceptability is the available eye movement about the eye point. Figure 9 gives an example of the three-dimensional size of the exit pupil (called the eye-box or qualified viewing space) of an NED. The eye-box defines the viewing volume over which the viewer can see the required image quality of the virtual image, and is one of the important characteristics that quantifies the NED’s usability. Although the size of the eye-box can be significantly impacted by what image quality metric is chosen, the criteria used for measuring the eye-box is still not well-established by the industry. A common minimum requirement is to allow a 50% drop from the center luminance in the virtual image over the entire eye-box. Some basic methods have been adopted using this approach, but more efficient methods are still needed to obtain high resolution eye-box measurements [48][50]. However, a simple luminance criterion for the eye-box does not consider the image quality of the virtual image. Professional applications (like medical) often have minimum image quality requirements necessary to perform critical tasks for prolonged periods. Therefore, additional performance criteria may be needed to define the eye-box, such as the eye-box based on maintaining a full field of view, a minimum resolution, or a maximum geometric distortion [42][69][70]. The implementation of these more complex characterization methods is still under development.
Conclusion
Information displays have made substantial improvements in image quality characteristics such as contrast and color gamut. Although existing medical quality control guidelines provide relevant monochrome methods for evaluating characteristics like grayscale and resolution [54], the content-aware imaging processing and wide color gamuts employed by many displays necessitates developing new measurement methods that take these advances into account. These enhancements have also created greater demands on the performance of the instrumentation needed to measure them. In addition, as more clinicians evaluate medical images using mobile displays, a more general framework is needed to estimate the image quality over the wide variation of indoor and outdoor illumination conditions. Display metrologists continue to improve the instrumentation, establish more pertinent test patterns, and develop general methodologies for evaluating displays under diverse illumination conditions. The introduction of NEDs has been especially challenging. The recognition that most of the traditional display optical measurement equipment were not appropriate for NEDs requires that designers and metrologists better simulate the eye optics in their instruments. New instruments and test methods are now being offered that more accurately measure the perceived image. But instrumentation necessary to measure the critical NED parameters continues to evolve as new device technologies like eye/gaze tracking and direct retinal scanning are introduced [51][52][71].
Although the basic vision science that defines the metrics of what makes a good image do not change, the means by which that information is extracted can get more complex as the display rendering technology becomes more dynamic and adaptive. As display technologies advance to offer users better image quality, the instruments and measurement methods also need to evolve to accommodate these new technological features.
Acknowledgements
The authors would like to thank Edward F. Kelley and Johan Bergquist for his valuable discussions and the use of their data. Funding for this work came from the NIST Health IT initiative.
Declarations
Conflict of Interest
The authors declare that they have no conflict of interest.
Footnotes
Publisher's Note
Springer Nature remains neutral with regard to jurisdictional claims in published maps and institutional affiliations.
References
- 1.International Color Consortium: ICC White Paper WP46: Improving color image quality in medical photography, 2017. http://color.org/whitepapers/ICC_White_Paper46-Medical_Photography_Guidelines.pdf
- 2.Penczek J, Boynton PA, Splett JD. Color error in the digital camera image capture process. J. Digital Imaging. 2014;27:182–191. doi: 10.1007/s10278-013-9644-1. [DOI] [PMC free article] [PubMed] [Google Scholar]
- 3.IEC 61966–2–1 (1999): Multimedia systems and equipment- Colour measurement and management: Part 2–1: Colour management-Default RGB colour space- sRGB. Note that IEC is International Electrotechnical Commission
- 4.ISO 15076–1 (2010): Image technology colour management—Architecture, profile format and data structure: Part 1: Based on ICC.1:2010. Note that ISO is International Organization for Standardization
- 5.Digital Imaging and Communications in Medicine (DICOM) 4: Grayscale Standard Display Function. National Electrical Manufacturers Association (NEMA) Standard PS 3.14–1999
- 6.P. Barten,: Physical model for the contrast sensitivity of the human eye, SPIE Proc. V1666, 1992
- 7.P. Barten,: Spatiotemporal model for the contrast sensitivity of the human eye and its temporal aspects, SPIE Proc. V1913, 1993
- 8.International Committee for Display Metrology (ICDM), Information Display Measurements Standard (IDMS), ver. 1.03, section A3, 2012. https://www.sid.org/Publications/ICDM.aspx
- 9.IEC TR 62977–2–3 (2017): Electronic display devices: Part 2–3: Measurements of optical properties – Multi-colour test patterns. Note that IEC is International Electrotechnical Commission.
- 10.IEC 62087–2 (2015): Audio, video, and related equipment – Determination of power consumption: Part 2: Signals and media. Note that IEC is International Electrotechnical Commission.
- 11.Miller ME, Murdoch MJ, Ludwichi JE, Arnold AD. Determining power consumption for emissive displays. Digest of Soc. for Information Display. 2006;37:482–485. [Google Scholar]
- 12.IEC 62977–2–1 (2021): Electronic displays: Part 2–1: Measurements of optical characteristics - Fundamental measurements. Note that IEC is International Electrotechnical Commission
- 13.A. Badano, et al,; Consistency and standardization of color in medical imaging: a consensus report, J. Digital Imaging, 28, 41–52, 2015 [DOI] [PMC free article] [PubMed]
- 14.Penczek J, Boynton PA. Color error in the medical digital image workflow. Digest of Soc. for Information Display. 2014;45:348–351. [Google Scholar]
- 15.Pointer MR. The gamut of real surface colors. Color Research and Appl. 1980;5:145–155. doi: 10.1002/col.5080050308. [DOI] [Google Scholar]
- 16.ITU-R BT.2020 (2015): Parameter values for ultra-high definition television systems for production and international programme exchange. Note that ITU is the International Telecommunication Union
- 17.Zong Y, Brown SW, Johnson BC, Lykke KR, Ohno Y. Simple spectral stray light correction method for array spectroradiometers. Applied Optics. 2006;45:1111–1119. doi: 10.1364/AO.45.001111. [DOI] [PubMed] [Google Scholar]
- 18.E. F. Kelley, K. Lang, L. D. Silverstein, and M. H. Brill: A rational methodology for estimating the luminous flux based upon color primaries for digital projection displays, NISTIR 6657, 2009
- 19.CIE 168 (2005): Criteria for the evaluation of extended-gamut colour encoding. Note that CIE is International Commission on Illumination
- 20.Bergquist J. Performance measurement of RGB displays with degenerate colors, Paper VHFp4-1L. Proc. IDW. 2017;1118–2220:2017. [Google Scholar]
- 21.J. Bergquist: Fast and accurate colour gamut volume measurements of RGB displays with degenerate colors, Paper VHFp7–3, Proc. IDW 2018, 2018
- 22.Kelley EF, Lindfors M, Penczek J. Display Daylight Ambient Contrast Measurement Methods and Daylight Readability. J. Soc. for Information Display. 2006;14:1019–1030. doi: 10.1889/1.2393026. [DOI] [Google Scholar]
- 23.Penczek J, Kelley EF, Boynton PA. General metrology framework for determining the ambient optical performance of flat panel displays. Digest of Soc. for Information Display. 2015;46:727–730. [Google Scholar]
- 24.IEC 62977–2–2 (2020): Electronic displays: Part 2–2: Measurements of optical characteristics – Ambient performance. Note that IEC is International Electrotechnical Commission
- 25.IEC 62679–3–1 (2014): Electronic paper displays- Part 3–1: Optical measuring methods. Note that IEC is International Electrotechnical Commission
- 26.IEC 62341–6–4 (2017): Organic light emitting diode (OLED) displays- Part 6–4: Measuring methods of transparent properties. Note that IEC is International Electrotechnical Commission
- 27.Penczek J, Hertel D. Developing E-paper standards for the mobile age. Digest of Soc. for Information Display. 2014;45:865–868. [Google Scholar]
- 28.Penczek J, Kelley EF, Boynton PA. General framework for measuring the optical characteristics of displays under ambient illumination. J. Soc. for Information Display. 2015;23:529–542. doi: 10.1002/jsid.395. [DOI] [Google Scholar]
- 29.J. N. Silva, M. Southworth, C. Raptis, and J. Silva: Emerging application of virtual reality in cardiovascular medicine. JACC: Basic to Transl. Sci., 3, 420–430, 2018 [DOI] [PMC free article] [PubMed]
- 30.Mendez A, Hussain T, Hosseinpour A-R, Valverde I. Virtual reality for preoperative planning in large ventricular septal defects. Heart journal: Eur; 2018. [DOI] [PubMed] [Google Scholar]
- 31.Katic D, Spengler P, Bodenstedt S, Castrillon-Oberndorfer G, Seeberger R, Hoffmann J, Dillmann R, Speidel S. A system for context-aware intraoperative augmented reality in dental implant surgery. Int. journal computer-assisted radiology surgery. 2015;10:101–108. doi: 10.1007/s11548-014-1005-0. [DOI] [PubMed] [Google Scholar]
- 32.Lin Y-K, Yau H-T, Wang I-C, Zheng C, Chung K-H. A novel dental implant guided surgery based on integration of surgical template and augmented reality. Clin. implant dentistry related research. 2015;17:543–553. doi: 10.1111/cid.12119. [DOI] [PubMed] [Google Scholar]
- 33.N. Cui, P. Kharel, and V. Gruev: Augmented reality with mocrosoft hololens holograms for near infrared fluorescence based image guided surgery, Moleclar-Guided Surgery: Molecules, Devices, and Applications III (10049), 100490I.9, 2017
- 34.Zhu M, Liu F, Chai G, Pan JJ, Jiang T, Lin L, Xin Y, Zhang Y, Li Q. A novel augmented reality system for displaying inferior alveolar nerve bundles in maxillofacial surgery. Sci. Reports. 2017;7:42365. doi: 10.1038/srep42365. [DOI] [PMC free article] [PubMed] [Google Scholar]
- 35.Chen X, Hu J. A review of haptic simulator for oral and maxillofacial surgery based on virtual reality. Expert. Review medical devices. 2018;15:435–444. doi: 10.1080/17434440.2018.1484727. [DOI] [PubMed] [Google Scholar]
- 36.Duncan D, Garner R, Zrantchev I, Ard T, Newman B, Saslow A, Wanserski E, Toga AW. Using virtual reality to improve performance and user experience in manual correction of MRI segmentation errors by non-experts. J. Digital Imaging. 2018;201:1–8. doi: 10.1007/s10278-018-0108-5. [DOI] [PMC free article] [PubMed] [Google Scholar]
- 37.M. M. North and S. M. North: Virtual reality therapy, Computer-assisted and web-based innovations in psychology, special education, and health, 141–156. Elsevier, 2016
- 38.T. M. Peters, C. A. Linte, Z. Yaniv, and J. Williams: Mixed and augmented reality in medicine. CRC Press, 2018
- 39.Chang W-C, Ko L-W, Yu K-H, Ho Y-C, Chen C-H, Jong Y-J, Huang Y-P. EEG analysis of mixed-reality music rehabilitation system for post-stroke lower limb therapy. J. Soc. for Information Display. 2019;27:372–380. doi: 10.1002/jsid.787. [DOI] [Google Scholar]
- 40.Ruthenbeck GS, Reynolds KJ. Virtual reality for medical training: the state-of-the-art. J. Simulation. 2015;9:16–26. doi: 10.1057/jos.2014.14. [DOI] [Google Scholar]
- 41.F. G. Hamza-Lup, J. P. Rolland, and C. Hughes: A distributed augmented reality system for medical training and simulation, arXiv reprint arXiv: 1811.12815, 2018
- 42.IEC TR 63145–1–1 (2018): Eyewear display- Part 1–1: Generic introduction. Note that IEC is International Electrotechnical Commission
- 43.ISO 9241–303 Annex E (2008): Ergonomics of human-system interaction – Part 303: Requirements for electronic visual displays. Note that ISO is International Organization for Standardization
- 44.ISO 9241–392 (2015): Ergonomics of human-system interaction – Part 392: Ergonomic recommendations for the reduction of visual fatigue from stereoscopic images. Note that ISO is International Organization for Standardization
- 45.Penczek J, Hasan M, Denning BS, Calpito R, Austin RL, Boynton PA. Measuring interocular geometric distortion of near-eye displays. Digest of Soc. for Information Display. 2019;50:430–433. [Google Scholar]
- 46.Penczek J, Boynton PA, Meyer FM, Heft EL, Austin RM, Lianza TA, Leibfried LV, Gacy LW. Absolute radiometric and photometric measurements of near-eye displays. J. Soc. for Information Display. 2017;25:215–221. doi: 10.1002/jsid.537. [DOI] [Google Scholar]
- 47.Draper RS, Penczek J, Varshneya R, Boynton PA. Standardizing fundamental criteria for near eye display optical measurements: Determining eye point position. Digest of Soc. for Information Display. 2018;49:961–964. [Google Scholar]
- 48.IEC 63145–20–10 (2019): Eyewear display- Part 20–10: Fundamental measurement methods – Optical properties. Note that IEC is International Electrotechnical Commission
- 49.Rushton SK, Riddell PM. Developing visual systems and exposure to virtual reality and stereo displays: some concerns and speculations about the demands on accommodation and vergence. Appl. Ergonomics. 1999;30:69–78. doi: 10.1016/S0003-6870(98)00044-1. [DOI] [PubMed] [Google Scholar]
- 50.Penczek J, Boynton PA. Optical instrument requirements for measuring Near-eye displays, IDW ’17 The 24th International Display Workshops. Japan: Sendai; 2017. [Google Scholar]
- 51.T. Jarvenpaa and V. Aaltonen: Compact near-to-eye display with integrated gaze tracker, Proc. SPIE 7001, Photonics in Multimedia II, Strasbourg, France, 2008
- 52.Jones RJM. Direct retinal imaging and virtual displays, RTO-MP-077, NATO Research and Technology Organsation meeting proceedings 77, Human Factors in the 21st Century. France: Neuilly-sur-Seine; 2002. [Google Scholar]
- 53.Samei E, et al. Assessment of display performance for medical imaging systems: Executive summary of AAPM TG18 Report. Medical Physics. 2005;32:1205–1225. doi: 10.1118/1.1861159. [DOI] [PubMed] [Google Scholar]
- 54.AAPM Report No. 270. Display Quality Assurance (https://www.aapm.org/pubs/reports/RPT_270.pdf)
- 55.ACR/NEMA. Digital Imaging and Communications in Medicine (DICOM), DICOM PS3.14 2019e, Grayscale Standard Display Function, 2019
- 56.Brennan PC, et al. Ambient lighting: effect of illumination on soft-copy viewing of radiographs of the wrist. American Journal of Roentgenology. 2007;188(2):W177–W180. doi: 10.2214/AJR.05.2048. [DOI] [PubMed] [Google Scholar]
- 57.Yamazaki A, Liu P, Cheng WC, Badano A. Image quality characteristics of handheld display devices for medical imaging. PloS one. 2013;8(11):e79243. doi: 10.1371/journal.pone.0079243. [DOI] [PMC free article] [PubMed] [Google Scholar]
- 58.Toomey RJ, Ryan JT, McEntee MF, Evanoff MG, Chakraborty DP, McNulty JP, Manning DJ, Thomas EM, Brennan PC. Diagnostic efficacy of handheld devices for emergency radiologic consultation. American Journal of Roentgenology. 2010;194(2):469–474. doi: 10.2214/AJR.09.3418. [DOI] [PMC free article] [PubMed] [Google Scholar]
- 59.S. Condino, M. Carbone, R. Piazza, M. Ferrari, and V. Ferrari: Perceptual Limits of Optical See-Through Visors for Augmented Reality Guidance of Manual Tasks. IEEE Transactions on Biomedical Engineering, OI 10.1109/TBME.2019.2914517, 2019 [DOI] [PubMed]
- 60.C. M. Zwart, M. He, T. Wu, B. M. Demaerschalk, J. R. Mitchell, and A. K. Hara.: Selection and pilot implementation of a mobile image viewer: a case study. JMIR Mhealth Uhealth, 3(2):e45, 2015 [DOI] [PMC free article] [PubMed]
- 61.P. M. Schlechtweg, F. J. Kammerer, H. Seuss, M. Uder, and M. Hammon.: Mobile image interpretation: Diagnostic performance of CT exams displayed ona tablet computer in detecting abdominopelvic hemorrhage. J. Digit Imaging, 29(2):183–188, 2016 [DOI] [PMC free article] [PubMed]
- 62.Badano A, et al. Considerations for the Use of Handheld Image Viewers: The Report of AAPM Task Group 260. In Med: Amer. Assoc. of Phys; 2018. [Google Scholar]
- 63.R. Rahman, M. E. Wood, L. Qian, C. L. Price, A. A. Johnson, and G. M. Osgood: Head-Mounted Display Use in Surgery: A Systematic Review. Surgical innovation, 1553350619871787, 2019 [DOI] [PubMed]
- 64.Cheng WC, Saleheen F, Badano A. Assessing color performance of whole-slide imaging scanners for digital pathology. Color Research & Application. 2019;44(3):322–334. doi: 10.1002/col.22365. [DOI] [Google Scholar]
- 65.P. M. Schlechtweg, M. Hammon, D. Giese, C. Heberlein, M. Uder, and S. A. Schwab.: iPad-based patient briefing for radiological examinations - a clinical trial. J Digit Imaging, 27(4):479–485, 2014 [DOI] [PMC free article] [PubMed]
- 66.Masaoka K. Single display gamut size metric. J. Soc. for Information Display. 2016;24:419–423. doi: 10.1002/jsid.449. [DOI] [Google Scholar]
- 67.Smith E, Heckaman RL, Lang K, Penczek J, Bergquist J. Measuring the color capability of modern display systems. J. Soc. for Information Display. 2020;28:548–556. doi: 10.1002/jsid.918. [DOI] [Google Scholar]
- 68.Masaoka K, Jiang F, Fairchild MD. 2D representation of display color gamut. Digest of Soc. for Information Display. 2018;49:1048–1051. [Google Scholar]
- 69.Varshneya R, Draper RS, Penczek J, Pixton BM, Terence N, Boynton PA. Standardizing fundamental criteria for near eye display optical measurements: Determining the eye-box. Digest of Soc. for Information Display. 2020;51:742–745. [Google Scholar]
- 70.IEC 63145–20–20 (2019): Eyewear display- Part 20–20: Fundamental measurement methods – Image quality. Note that IEC is International Electrotechnical Commission
- 71.Penczek J, Austin RL, Obheroi S, Hasan M, Cook GJ, Boynton PA. Measuring direct retinal projection displays. Digest of Soc. for Information Display. 2020;51:807–810. [Google Scholar]
- 72.Beams R, Kim AS, Badano A. Transverse chromatic aberration in virtual reality head-mounted displays. Optics Express. 2019;27:24877–24884. doi: 10.1364/OE.27.024877. [DOI] [PubMed] [Google Scholar]
- 73.L. Zhang and M. J. Murdoch: Color matching criteria in augmented reality, Color and Imaging Conference, Vol. 2018. No. 1. Society for Imaging Science and Technology, 2018
- 74.Wilson A, Hua H. Design and prototype of an augmented reality display with per-pixel mutual occlusion capability. Optics Express. 2017;24:30539–30549. doi: 10.1364/OE.25.030539. [DOI] [PubMed] [Google Scholar]
- 75.Kim AS, Cheng W-C, Beams R, Badano A. Color rendering in medical extended-reality applications. J. Digital Imaging. 2020 doi: 10.1007/s10278-020-00392-4. [DOI] [PMC free article] [PubMed] [Google Scholar]
- 76.R. Beams, B. Collins, A. S. Kim, and A. Badano: Angular dependence of the spatial resolution in virtual reality displays, IEEE Conference on Virtual Reality and 3D User Interfaces (VR) 2020, 10.1109/VR46266.2020.00108, 2018