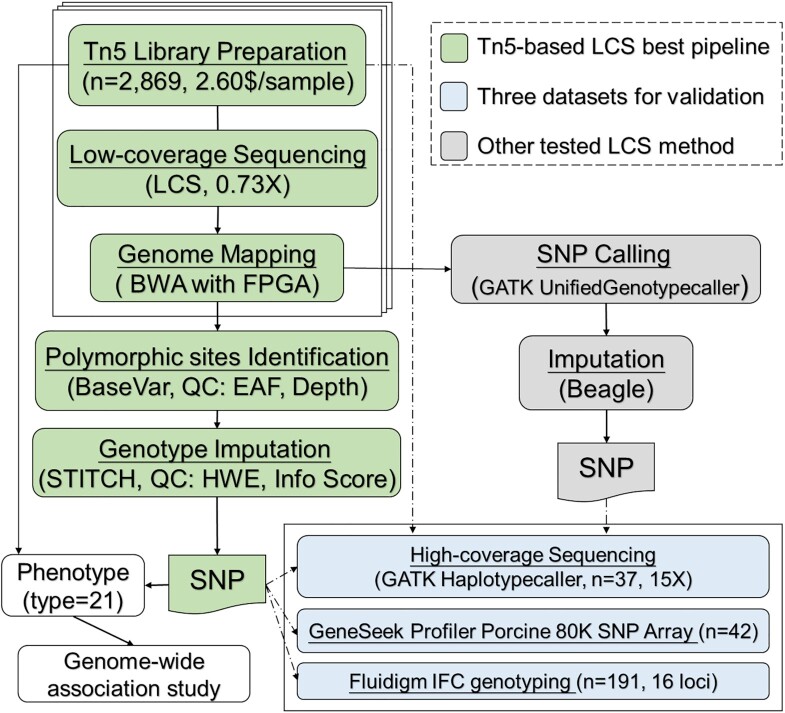
Figure 1:
Low-coverage sequencing (LCS) study design. The flow chart summarizes the steps used to identify and impute polymorphic sites, where the green block represents the highly accurate pipeline used for Tn5-based LCS analysis (BaseVar-STITCH). We also generated SNP results using the GATK-Beagle pipeline (grey) and compared them with those obtained using the BaseVar-STITCH method. Three datasets (blue) were used to assess the accuracy of the results. The BaseVar-STITCH pipeline was used in the GWAS presented in this study. BWA: Burrows-Wheeler Aligner; HWE: Hardy-Weinberg equilibrium; QC: quality control.

