

Abstract
The aggressive nature of glioblastoma multiforme (GBM) may be attributed to the dysregulation of pathways driving both proliferation and invasion. EphrinB2, a membrane-bound ligand for some of the Eph receptors, has emerged as a critical target regulating these pathways. In this study, we investigated the role of ephrinB2 in regulating proliferation and invasion in GBM using intracranial and subcutaneous xenograft models. The Cancer Genome Atlas analysis suggested high transcript and low methylation levels of ephrinB2 as poor prognostic indicators in GBM, consistent with its role as an oncogene. EphrinB2 knockdown, however, increased tumor growth, an effect that was reversed by ephrinB2 Fc protein. This was associated with EphB4 receptor activation, consistent with the data showing a significant decrease in tumor growth with ephrinB2 overexpression. Mechanistic analyses showed that ephrinB2 knockdown has anti-invasive but pro-proliferative effects in GBM. EphB4 stimulation following ephrinB2 Fc treatment in ephrinB2 knockdown tumors was shown to impart strong anti-proliferative and anti-invasive effects, which correlated with decrease in PCNA, p-ERK, vimentin, Snail, Fak, and increase in the E-cadherin levels. Overall, our study suggests that ephrinB2 cannot be used as a sole therapeutic target. Concomitant inhibition of ephrinB2 signaling with EphB4 activation is required to achieve maximal therapeutic benefit in GBM.
Keywords: EphB4, ephrinB2, GBM, invasion, proliferation
1 |. INTRODUCTION
Glioblastoma multiforme (GBM) is the most aggressive type of central nervous system (CNS) malignancy. Current treatment for GBM is multimodal, involving surgical resection of the tumor, followed by adjuvant concurrent radiation therapy and chemotherapy.1 However, this approach has generally dismal outcomes, with very short survival, due to the rapidly proliferating, invasive, and resistant nature of this disease. The targeting of specific pathways that drive both its aggressive invasive potential as well as its rapid proliferative capacity will be key in improving clinical outcomes.2
During embryogenesis, glial progenitor and neuronal cells migrate to their respective distant functional locations along the CNS from their site of origin.3 A diverse variety of spatiotemporally regulated signaling networks, cell surface receptors, and transcriptional growth factors guide these early neuronal cells to ensure appropriate migration and subsequent proliferation and differentiation.4–6 Comprehensive analysis of GBM tumor cohorts have demonstrated that malignant GBM cells hijack the same signaling networks used in embryogenesis to enhance their aggressive invasive and proliferative potential.6–8 One such network is the Eph-ephrin system, which is well characterized in embryogenesis and carcinogenesis to participate in various processes including cell migration, invasion, proliferation, differentiation, and adhesion.9,10 Eph tyrosine kinase cell surface receptors comprise the largest family of receptor tyrosine kinases.11 They interact with their membrane-bound ligands, the ephrins, at cell junctions to modulate a variety of cellular behavior, and complex biological processes. The interactions between the Eph receptors and ephrin ligands are promiscuous, but cross-binding between subclasses is less commonly reported.11,12
Dysregulated expression of different Eph-ephrin members in GBM have been shown to contribute to its pathogenesis and progression.13 One such member is ephrinB2, which has been reported in multiple studies to be overexpressed in GBM.14–17 The published literature, however, is contradictory as ephrinB2 has been shown to have both tumor-promoting16 and tumor-suppressive17 roles in different model systems. To address this discrepancy, we conducted expression and functional analysis. Interrogation of The Cancer Genome Atlas (TCGA) expression and methylation data led us to hypothesize a tumor-promoting role for ephrinB2. Our functional data, however, using both loss-of-function and gain-of-function approaches, did not support the proposed hypothesis, presenting instead a more complex biological picture dependent on the cellular phenotype examined, be it invasion or proliferation.
Given the distinct feature of bidirectional signaling between Eph and ephrins,11,18 we examined the effects of ephrinB2 overexpression and knockdown in GBM cells. Knockdown of ephrinB2 enhanced tumor growth, an effect that was therapeutically reversed by the administration of ephrinB2 Fc fusion protein. Analysis of its EphB4 receptor status revealed that such rescue of the effect by using ephrinB2 Fc was associated with EphB4 receptor activation. Similarly, overexpression of ephrinB2 increased the activation of EphB4 and reduced tumor growth. Our mechanistic analyses revealed that while ephrinB2 knockdown has anti-invasive effect, it promoted proliferative behavior in GBM tumors. Importantly, EphB4 receptor activation following treatment with ephrinB2 Fc in ephrinB2 knockdown tumors resulted in a significant tumor growth suppression correlating with strong anti-proliferative and anti-invasive effects. These data support a model where it is the Eph-ephrin interaction between GBM cells, rather than ephrinB2 signaling alone, that ultimately dictates the behavior of GBM cells. Overall, our findings suggest that activating EphB4 receptor while inhibiting ephrinB2-mediated reverse signaling will be critical to address the dichotomy of proliferation and invasion in GBM.
2 |. MATERIALS AND METHODS
Cell lines, reagents, and other experimental procedures are described in detail in the Supporting Information Methods section.
2.1 |. TCGA data analysis
Gene expression and methylation data was obtained from TCGA for low grade gliomas (LGG) (n = 530) and GBM (n = 166) patients. Cutoff beta value for methylation was set at 0.3 as previously reported.5 Overall survival (OS) and disease-free survival (DFS) were calculated by the Kaplan-Meier method using log-rank tests for comparisons. DFS was defined as time from the date of diagnosis to the date of the last known occasion that the patient was disease-free, or the date of disease recurrence (local, regional, or distant recurrence). Death without documented recurrence was censored at the date of death. Cox proportional model was used to calculate the hazard ratio (HR). Two-sided P values and 95% confidence intervals are reported for survival analyses. TCGA was also interrogated for the messenger RNA (mRNA) expression of EphB class of receptors in GBM (n = 591) patients. The OncoPrint data representing variation in the level of multiple EphB receptors in GBM is shown in the form of a heatmap.
2.2 |. Single-cell RNA-seq data analysis
Single-cell RNA-seq data at the University of California Santa Cruz (UCSC) Cancer Browser was interrogated to analyze ephrinB2 and EphB4 gene signature in four cases of primary GBM.19 Tissue was processed separately from two different locations: one originating from the tumor core and another one from the peritumoral region next to the core of the tumor tissue.19 Single-cell suspensions were sorted into different cell types followed by complementary DNA synthesis and library preparation.19 Single-cell RNA-seq and differential analysis was performed as described earlier.19
2.3 |. Generation of shRNA knockdown clones and overexpression clones
Lentivirus encapsidated short hairpin RNA (shRNA) vectors (pLKO.1; Sigma-Aldrich) were purchased from the University of Colorado Cancer Center Functional Genomics Facility (Anschutz Medical Campus, Aurora, CO). EphrinB2 knockdown was achieved by transducing U87 cells with shRNA against human ephrinB2. Cells were transduced with control shRNA (catalog # SHC016; Sigma-Aldrich) in parallel. Transduced cells were selected with 0.2 to 2 μM range of G418 and following selection, cells were maintained in 1 μM dose.
To generate ephrinB2 overexpression clones, AM38 cells were transfected with ephrinB2 overexpression plasmid, which was obtained from Dr. Elena Pasquale’s laboratory (Sanford Burnham Prebys Medical Discovery Institute, San Diego, CA). AM38 cells were plated at a density of 200 000 cells/well in a six-well plate. After overnight incubation, cells were transfected with the overexpression plasmid in Opti-MEM media using FuGENE transfection Reagent (Promega, Madison, WI). After 24 hours incubation, transfection complex was aspirated and replaced with fresh media containing G418 selection antibiotic. A viable clone was expanded for use in further experiments.
2.4 |. Boyden chamber invasion assay
GBM cells were serum-starved for 4 hours before seeding (1 × 10⁵ cells/well) in serum-free media into the upper chamber of a 24-well plate insert with 8.0 μM pores (BioCoat Control Inserts; BD Biosciences, Bedford, MA). Matrigel was prepared in a 1:10 dilution in serum-free media and utilized as the extracellular matrix through which the cancer cells can invade. The matrigel was added to the floor of the insert and allowed to set for 4 hours. The bottom chamber was filled with 10% complete media. The cells were incubated at 37°C and allowed to invade for 24 hours. For stimulation experiments, pre-clustered Fc protein was added to the cells at a final concentration of 2 μg/mL. To prepare the inserts for imaging, noninvading cells in the upper chamber were washed and removed and the cells that invaded through the matrigel were stained with 0.1% crystal violet.20 For experiments involving FAK inhibitor, serum-starved cells (1 × 10⁵ cells/well) were plated in the top-chamber in the absence or presence of 5 μM FAK inhibitor Y15 for 48 hours followed by analysis. Images were taken at either 4× or 10× magnification. The number of cells invading through the matrigel were quantified using the ImageJ software.
2.5 |. In vivo models
Female athymic nude mice (6 weeks old) were purchased from Envigo (Indianapolis, IN). All the mice were cared for in accordance with the ethical guidelines and conditions set and overseen by the University of Colorado, Anschutz Medical Campus Animal Care and Use Committee. The protocols used for animal studies were reviewed and approved by the Institutional Animal Care and Use Committee at the University of Colorado, Anschutz Medical Campus. Details are included in the Supporting Information Methods section.
2.6 |. Bioluminescence and CBCT imaging
For assessment of AM38 orthotopic tumor growth, mice received d-luciferin by intraperitoneal injection 10 to 15 minutes before imaging in the Xenogen IVIS 200 (Perkin Elmer, Waltham, MA). Radiance (photons/s/cm2/sr) was quantified over a region of interest, using Living Image software (Perkin Elmer). For assessment of U87 orthotopic tumor growth, mice received 200 μL intravenous injections of iodinated CT contrast (Isovue-370 or Omnipaque-350) 3 to 15 minutes before CBCT imaging in the X-RAD SmART (Precision X-Ray, North Bradford, CT). Tumor volumes were determined by contouring with ITK-SNAP tool.21
2.7 |. Statistics
All of our in vitro experiments were conducted at a minimum of n = 2 times in duplicates or triplicates. Quantitative analyses were performed using a Student t test, Mann-Whitney test, One-Way ANOVA, or the Mantel-Cox test for survival using GraphPad Prism. P < .05 was considered statistically significant.
3 |. RESULTS
3.1 |. EphrinB2 has decreased methylation status but increased expression in GBM and correlates with a poor prognosis
The population of glioma patients in the TCGA is diverse, including oligodendroglioma (OD), oligoastrocytoma (OA), grade II astrocytoma (A), grade III anaplastic oligoastrocytoma (AOA), anaplastic astrocytoma (AA), and glioblastoma multiforme (GBM). Gliomas of a grade I or II are defined as LGG. Analysis of mRNA expression within the TCGA database demonstrated that expression of EFNB2 was significantly higher in the grade IV (GBM) population compared to the individual and pooled populations of LGG patients (Figure 1A). As expected, GBM had a significantly worse survival compared to other grades of glioma (Figure 1B). To determine how EFNB2 overexpression correlates with prognosis within the GBM cohort, we analyzed the survival of GBM patients stratified by EFNB2 expression using the TCGA microarray data set and found that a high expression of EFNB2 correlated with significantly worse OS and DFS (Figure 1C). Furthermore, consistent with a role driving aggressive behavior, we found that the methylation status of EFNB2 is significantly reduced in GBM compared to LGG (Figure 1D). EFNB2 expression was significantly higher in LGG patients with low/no methylation (Figure 1E) and OS and DFS of LGG patients with EFNB2 methylation was significantly improved from those without methylation (Figure 1F). These findings suggested that during malignant progression of glioma tumors from LGG to high-grade GBM, there is an upregulation of EFNB2 expression and a decrease in DNA methylation, and both correlated with worse prognosis. In further support of these findings, the TCGA data showed that glioma patients with methylated EFNB2 are more likely to harbor the IDH mutation, which is known to be associated with improved prognosis22 (Supporting Information Figure S1).
FIGURE 1.

EphrinB2 has an increased expression but decreased methylation status in GBM and correlates with a poor prognosis. A, mRNA expression of EFNB2 among differing grades of glioma. TCGA data from 530 LGG, 134 OA, 119 OD, 66 A, 78 AOA, 129 AA, and 166 GBM patients was obtained and analyzed for EFNB2 mRNA expression. One-way ANOVA was performed to compare mRNA expression among the groups (***P = .0001). There was significantly higher expression of EFNB2 in the GBM patients compared to all other gliomas. B, Significantly decreased percent survival in GBM compared to other grades of gliomas. One-way ANOVA was performed to compare mRNA expression among the groups (****P < .0001). C, KM analysis of OS and DFS in patients expressing high and low levels of EFNB2 using the TCGA microarray data set. A high expression of EFNB2 correlated with a significantly worse OS (P < .0001, HR = 1.65, 95% CI = 1.3–2.1) and DFS (P = .0003, HR = 1.55, 95% CI = 1.3–2.1). Log-ranks tests were conducted to obtain the P value, HR, and 95% CI. D, The methylation status of EFNB2 decreases in GBM compared to LGG. The cutoff β value for methylation was set at .3. In the GBM cohort, only 2 out of 256 patients harbored methylated EFNB2 compared to 180 out of 530 patients in the LGG cohort. One-way ANOVA was performed to compare mRNA expression among the groups (***P = .0001). E, The EFNB2 expression is significantly higher in LGG patients with low/no EFNB2 methylation (P < .0001). F, Methylation of EFNB2 in a cohort of patients with LGG significantly correlated with improved OS (P < .0001, HR = 2.33, 95% CI = 1.616–3.358) and DFS (P < .0001, HR = 2.020, 95% CI = 1.452–2.809). 95% CI, 95% confidence interval; A, astrocytoma; AA, anaplastic astrocytoma; AOA, anaplastic oligoastrocytoma; ANOVA, analysis of variance; DFS, disease-free survival; GBM, glioblastoma multiforme; HR, hazard ratio; KM, Kaplan-Meier; LGG, low grade glioma; mRNA, messenger RNA; OA, oligoastrocytoma; OD, oligodendroglioma; OS, overall survival; TCGA, The Cancer Genome Atlas
3.2 |. Knockdown of ephrinB2 increases tumor growth and decreases survival in vivo while its overexpression reduces tumor growth
Given the results of the TCGA analysis, we hypothesized that ephrinB2 is an oncogenic protein and aimed to test the effect of its loss-of-function and gain-of-function on GBM tumor progression. Characterization of two different human GBM cell lines showed high ephrinB2 expression in U87 cell line and negligible ephrinB2 expression in AM38 (Supporting Information Figure S2A). For loss-of-function studies, we stably knocked down ephrinB2 in the U87 cells using an ephrinB2-specific shRNA, with U87 cells transfected with nonspecific shRNA used as a control (Supporting Information Figure S2B). For the gain-of function studies, we used an ephrinB2 overexpression plasmid in the AM38 cell line and successfully generated a clone with ephrinB2 expressed on tumor cells (designated as AM38 ephrinB2 OVE) (Supporting Information Figure S2C).
Using the loss-of-function clones, we assessed the effect of ephrinB2 knockdown on tumor volumes in both intracranial orthotopic and flank models of GBM in vivo. Radiographic volumetric assessment of orthotopically implanted U87 tumor cells showed that U87 ephrinB2 knockdown (U87 ephrinB2 sh) tumors were larger than the U87 control sh mice (Figures 2A,B). These data were further confirmed in a flank xenograft tumor model that showed a significant increase in tumor volume and a decrease in survival with ephrinB2 knockdown tumors (Figure 2C–E). The median tumor volume in the U87 ephrinB2 sh group was 2.98-fold larger compared to the U87 control sh group at day 52 postimplantation (Figure 2D). The median survival for the U87 ephrinB2 knockdown group significantly decreased to 62 days compared to 83 days for the control sh group (Figure 2E). Since radiation is the mainstay treatment for GBM patients, we included a radiation arm in both U87 control and U87 ephrinB2 knockdown groups. U87 tumor-bearing mice exposed to radiation presented smaller tumors than the nonirradiated group by computed tomography (CT) imaging, although this trend did not reach significance (Figure 2B). Similarly, tumors with ephrinB2 knockdown when exposed to radiation resulted in a 1.47-fold decrease in median tumor volume compared to the ephrinB2 knockdown group alone (Figure 2B).
FIGURE 2.

The knockdown of ephrinB2 in U87 tumors increases tumor volume in vivo. A, CT scans of athymic nude mice orthotopically implanted with either U87 control or U87 ephrinB2 sh tumor cells. B, Radiographic volumetric assessment of orthotopically implanted U87 tumor cells show changes in tumor volumes between the nonirradiated and irradiated groups at day 25 post-XRT. C, Temporal curves show changes in tumor volumes of mice implanted with U87 control sh and U87 ephrinB2 sh cells in the flank region. D, Dot plots demonstrate significant increase in tumor volume in mice implanted with ephrinB2 knockdown tumors compared to controls on day 52 (*P = .0396) as determined by Mann-Whitney test. E, KM survival curve illustrating that the U87 control mice lived significantly longer than the ephrinB2 knockdown mice (P = .0295). F Western blot analysis shows decreased levels of p-ephrinB2 and p-EphB4 in the ephrinB2 knockdown tumors. The surrogate marker for proliferation, PCNA, show considerable increase after the loss of ephrinB2 in U87 tumors. G, The data is substantiated by immunohistochemical staining using anti-PCNA antibody that show significant increase in PCNA-positive staining in the knockdown group compared to the control group. Data represent mean ± SEM. Statistical significance was analyzed by performing unpaired t test. *P < .05. CT, computed tomography; KM, Kaplan-Meier; XRT, operative radiation therapy
In a gain-of-function experiment, AM38 ephrinB2 OVE cells and respective parental cells were implanted intracranially into nude mice. The bioluminescence images are shown in Figure 3A. We observed that AM38 ephrinB2 OVE group had smaller radiance values corresponding to smaller tumors compared to the AM38 control mice (Figure 3A,B). These data were further confirmed in a flank xenograft tumor model that showed significant reduction in tumor volume with ephrinB2 overexpression compared to the control group (Figure 3C). The median tumor volume in the ephrinB2 overexpression group was fourfold smaller at day 32 postimplantation compared to the AM38 control mice (Figure 3C).
FIGURE 3.
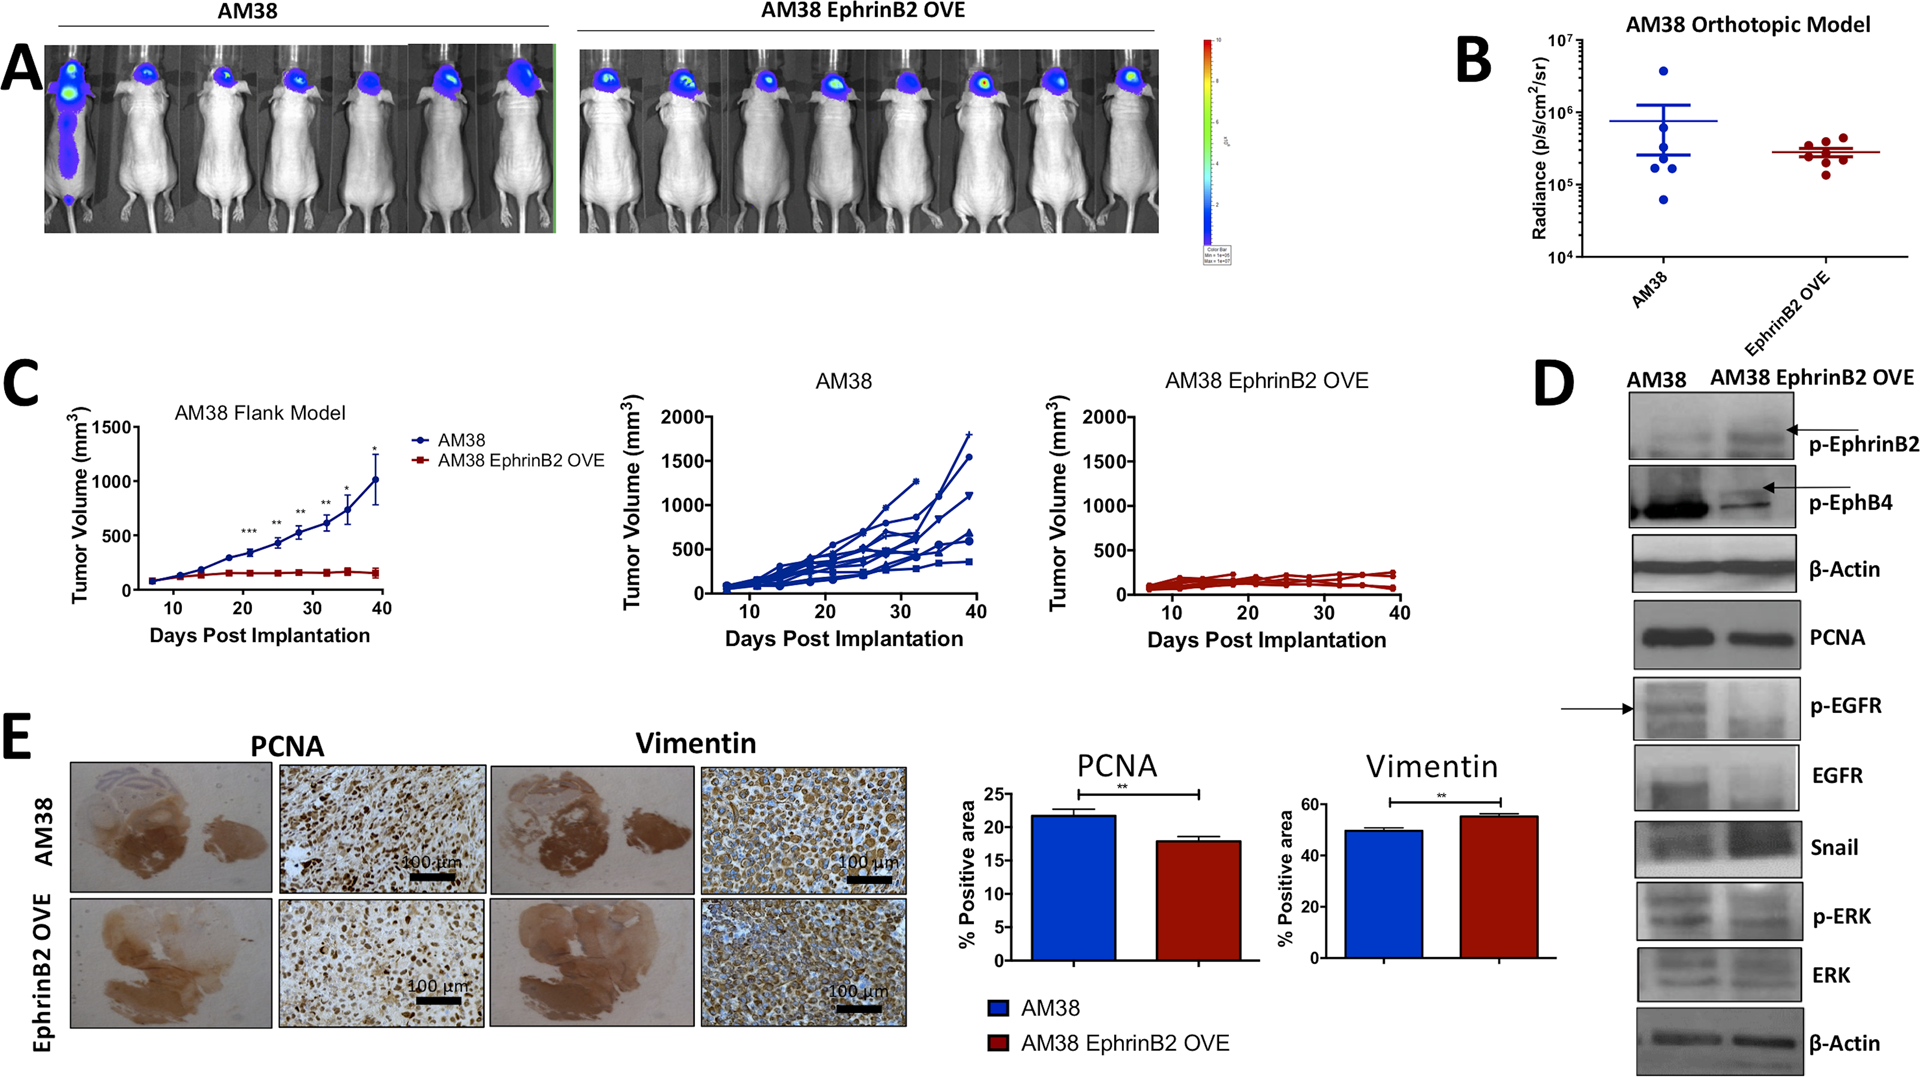
The overexpression of ephrinB2 in AM38 tumors decreases tumor volume in an in vivo model of GBM. A, Bioluminescence images are shown in mice orthotopically inoculated with AM38 control cells compared to AM38 ephrinB2 OVE cells. B, Radiance values measured in photons/s/cm2/sr using BLI software are shown for the respective control and experimental groups at days 13 to 14 postimplantation. BLI images were captured at 15 minutes after intraperitoneal injection of 50 mg/kg of D-luciferin. C, Tumor volumes of mice implanted with either AM38 control or AM38 ephrinB2 OVE cells in the flank region show significant decline in tumor growth in a time-dependent manner. D, Mechanistic analysis performed on tumor tissues show an increase in both p-ephrinB2 and p-EphB4 in the overexpressing tumors. The protein levels of several growth-promoting molecules including p-EGFR, EGFR, and p-ERK were decreased, whereas the levels of Snail that promotes invasive phenotype in tumor cells were increased following overexpression of ephrinB2. Similar results were evident in immunohistochemical analysis for PCNA and vimentin staining (E) representing antiproliferative and pro-invasive effect. Data represent mean ± SEM. Statistical significance was analyzed by performing unpaired t test. *P < .05, **P < .005, ***P < .005. BLI, bioluminescence-luciferase imaging
3.3 |. EphB4 activation status is altered in GBM tumors following ephrinB2 knockdown and overexpression in cancer cells
Our in vivo results were unexpected and contrary to what was initially predicted based on the TCGA data analysis. To reconcile these results, we first examined the effects of ephrinB2 shRNA knockdown or overexpression on the expression and activity of its cognate receptor, EphB4. In a gene family known for bidirectional signaling, in which both the receptor and the ligand can signal, it is crucial to understand the expression and activation status of the receptor in context of the ligand. In fact, EphB4 activation depends on the presence of ectodomain of ephrinB2, its high-affinity binding ligand.23 We hypothesized that with shRNA knockdown of ephrinB2, this ectodomain is eliminated, effectively inhibiting the activation of EphB4 and subsequent bidirectional signaling. Consistent with this signaling dependence, our data showed that both EphB4 and p-EphB4 protein levels were reduced following knockdown of its cognate ligand, ephrinB2, in U87 tumors (Supporting Information Figure S2D and Figure 2F), whereas overexpression of ephrinB2 resulted in an increased expression of EphB4 and p-EphB4 in AM38 cells (Supporting Information Figure S2D and Figure 3D). Our data suggest that both the expression levels and the activity of EphB4 are dependent on the expression and activity of its cognate ligand, ephrinB2.
To validate the relevance of the ephrinB2-EphB4 interaction in tumors, we localized the expression of these proteins in GBM tumor tissue. Our data showed that ephrinB2 is present in both tumor cells and blood vessels. Similarly, EphB4 is found to be present on some tumor cells as well as tumor vasculature (Supporting Information Figure S3A). Analysis of the publicly available single-cell RNA-seq database from 3589 cells of four GBM patients19 showed that our data was consistent with high expression of both EphB4 and ephrinB2 in the neoplastic cells compared to the nonneoplastic cells, including mature oligodendrocytes, neurons, vascular cells, and oligodendrocyte precursor cells (OPCs) (Supporting Information Figure S3B,C).
3.4 |. EphrinB2 knockdown decreases pro-migratory pathways while increasing pro-survival ones and ephrinB2 overexpression has the opposite effects
To further understand the mechanisms contributing to the tumor-promoting effects triggered by ephrinB2 knockdown, we analyzed the phosphorylated levels of key proteins along with apoptotic markers by running a protein array on the U87 tumor lysates. Our data showed that there is a decrease in the levels of phosphorylated FAK, which is known to play a key role in cell migration (Figure 4A). The levels of both p-CSK and p-FRK that have tumor-suppressive function, were decreased in the ephrinB2 knockdown tumors (Figure 4A). In addition, ephrinB2 knockdown was associated with a significant decline in the levels of DR6 (Figure 4A), a death receptor protein with proapoptotic function.24 The level of HSP60, a mitochondrial chaperone with pro-survival function increased following the loss of ephrinB2 (Figure 4A). Furthermore, upon Western blot analysis, we observed increased PCNA (Figure 2F,G) in the U87 knockdown tumors, thus suggesting that knockdown of ephrinB2 confers proliferative advantage to the GBM tumors while inhibiting its invasive abilities.
FIGURE 4.

Multiplex phosphoarray and apoptotic array analysis show alterations in the levels of phosphoproteins involved in tumor growth and proliferation and changes in apoptotic markers. Tumor tissues were screened following knockdown of ephrinB2 compared to the control group in U87 tumors (A) and overexpression of ephrinB2 in AM38 tumors (B). Data represent mean ± SD. Statistical significance was analyzed by performing t test. *P < .05
To examine the functional relevance of ephrinB2 overexpression and the associated increase in EphB4 activation on cellular functions, we performed Western blot analysis on AM38 tumors focusing on molecules involved in tumor growth, proliferation, and invasion. Our data showed that ephrinB2 OVE tumors have significantly lower levels of p-EGFR and p-ErbB4 (Figure 4B). In addition, vascular markers such as p-Tie2 and p-VEGFR2 and pro-survival proteins Bcl2 and p21 decreased significantly in the AM38 ephrinB2 OVE group compared to the controls (Figure 4B). Similarly, we performed Western blot analysis on AM38 tumors to validate the molecules involved in tumor growth, proliferation, and invasion. Our data showed a decrease in the levels of PCNA, p-EGFR, total EGFR, and p-ERK in ephrinB2 OVE tumors (Figure 3D). This is concordant with the decreased tumor growth observed in the AM38 ephrinB2 OVE tumor-bearing mice. In addition, Snail, known to regulate the epithelial-to-mesenchymal transition, increased following gain-of-function in AM38 OVE tumors (Figure 3D), suggesting a dichotomous role by ephrinB2 in GBM.
Importantly, p-FAK emerged as one of the key candidates in our phosphoarray analysis. The correlation between p-FAK and ephrinB2 expression has also been previously demonstrated.25 Therefore, we analyzed the effect of blocking FAK on AM38 ephrinB2 overexpressing cells in an invasion assay. In the absence of inhibitor, AM38 ephrinB2 OVE were able to invade through the Boyden chamber membrane. But incubating the cells with 5 μM FAK inhibitor for 48 hours significantly decreased their invasive capability as shown in Figure 5C. Overall, these data suggest that overexpressing ephrinB2 in GBM tumors inhibits tumor growth by restricting their proliferative behavior by affecting PCNA and p-EGFR pathway while stimulating invasion via FAK.
FIGURE 5.

EphrinB2 overexpression enhances invasion via forward signaling with EphB4, while activation of reverse signaling inhibits invasion. A, Boyden chamber assay illustrating either AM38 control or AM38 ephrinB2 OVE cells invading through a layer of matrigel after 24 hours demonstrated that significantly more AM38 ephrinB2 OVE cells invaded compared to the controls. B, Boyden chamber assay illustrating either AM38 ephrinB2 OVE cells stimulated with control Fc or EphB4 Fc invading through a layer of matrigel after 24 hours. Fewer cells invaded upon stimulation of reverse signaling with EphB4 Fc (P = .0498). C, Inhibition of FAK using YY5 inhibitor (5 μM) significantly blocks the invasive potential of AM38 OVE cells. Experiment was performed in either duplicates or triplicates. Data represent mean ± SD. (*P < .05, ***P < .0001). D, MTT assay performed on AM38 control or EphrinB2 OVE cells show significant decline in cell growth at 48 hours time-point. Statistical significance was analyzed by performing t test. Data represent mean ± SD ****P < .0001. E, Western blot analysis performed on either ephrinB2 knockdown cells or AM38 ephrinB2 OVE cells show differences in the levels of proteins that contributes toward invasive or proliferative behavior. MTT, 3-(4,5-dimethylthiazol-2-yl)-2,5-diphenyltetrazolium bromide
3.5 |. Activation of EphB4 forward signaling in ephrinB2 overexpressing cells generates dichotomous effects on proliferation and invasion
In light of the above findings illustrating how ephrinB2 gain-of-function or loss-of-function can have differential effects on forward receptor signaling, reverse ligand signaling, or bidirectional signaling, we sought to establish the cellular effects of modulating the receptor or ligand activation status on the invasive and proliferative behavior of these tumor cells. By treating our cell lines with either EphB4 Fc or ephrinB2 Fc fusion proteins, we effectively manipulated the dominance of one direction of signaling over the other as follows: (a) Forward signaling dominant activation of EphB4 would be represented by either the AM38 ephrinB2 OVE or the stimulation of U87 ephrinB2 sh cells with the ephrinB2 Fc that triggers EphB4 phosphorylation (Figures 3D and 6C). (b) Reverse signaling dominant activation of ephrinB2 would be represented by AM38 ephrinB2 OVE treated with EphB4 Fc (Supporting Information Figure S2E). (c) Elimination of bidirectional signaling would be represented in the U87 ephrinB2 sh group (Figure 2F). Using these strategies, our data demonstrated that the activation of forward EphB4 signaling increased invasion in vitro (Figure 5A,E) and expression of pro-invasive proteins in vivo (Figures 3E). In contrast, activation of reverse ephrinB2 signaling decreased invasion in vitro (Figure 5B). Thus, our data illustrate that forward EphB4 signaling enhances invasion while reverse ephrinB2 signaling diminishes it.
FIGURE 6.

Stimulation of EphB4 forward signaling in the absence of reverse signaling decreases tumor growth in vivo. A, Nude mice inoculated with U87 ephrinB2 sh cells were treated with either control Fc (n = 12 tumors) or ephrinB2 Fc (n = 12 tumors) proteins. A significant decrease in tumor volume was observed in the tumors treated with ephrinB2 Fc at day 32 postimplantation. Data represent mean ± SEM (P < .0001). Individual tumor volumes are shown in the form of spaghetti plots. B, Body weights between mice treated with control Fc and ephrinB2 Fc did not differ significantly, suggesting no toxicity following administration of ephrinB2 Fc. C, Western blot analysis on tumor tissues excised from the control and experimental groups show an increase in the levels of p-EphB4, and E-Cadherin and reduction in the levels of p-ERK, FAK, Snail in the ephrinB2 Fc treated group compared to the control Fc tumors. D, Immunohistochemical analysis for PCNA and vimentin staining show decreased proliferation and invasion effects. Data represent mean ± SEM. Statistical significance was analyzed by performing unpaired t test. *P < .05, ***P < .005
Consistent with the need to activate EphB4 receptor, blocking bidirectional signaling using an ephrinB2 blocking scFv antibody fragment (B11)26 showed no effect on tumor growth. We xenotransplanted luciferase-tagged AM38 ephrinB2 OVE cells intracranially into nude mice and administered the B11 drug with radiation treatment. Our data revealed no significant change in tumor growth in the B11-treated group compared to the PBS control in the absence of radiation (Supporting Information Figure S5A) or by CT radiographic analysis (Supporting Information Figure S5B), even in the presence of radiation (Supporting Information Figure S5A,C).
The requirement of stimulating EphB4 forward signaling for reducing cellular growth was further evaluated in vitro using ephrinB2 overexpressing and knockdown clones. Our data showed that forcing expression of ephrinB2 in AM38 cells significantly decreased the rate of cell growth by 1.42-fold compared to the control group at a 48 hours time-point as determined by MTT (3-(4,5-dimethylthiazol-2-yl)-2,5-diphenyltetrazolium bromide) assay (Figure 5D). As a surrogate marker for cell proliferation, we analyzed the expression of PCNA in tumor tissues by immunohistochemical staining and observed a significant decline in PCNA-positive tumor cells in the AM38 ephrinB2 OVE group compared to the control tumors (Figure 3E). Similar results were evident in AM38 ephrinB2 overexpressing cells grown in culture by Western blot analysis (Figure 5E). The effect on proliferation was contrary to what was evident in our invasion studies in AM38 OVE group in a Boyden chamber assay in vitro (Figure 5A) and in tumor samples (Figure 3D,E). The U87 ephrinB2 knockdown cells, consistent with the in vivo tumor growth data, showed a significant increase in PCNA levels both by Western blot analysis and by immunohistochemistry compared to the control group (Figure 2F,G). These data collectively suggest that when ephrinB2 is overexpressed in GBM tumor cells, signaling with its cognate receptor, EphB4, is activated, leading to decreased tumor volumes. Mechanistically, this activation of forward signaling promotes a dichotomous relationship as it enhances invasion and decreases proliferation.
3.6 |. Stimulation of EphB4 forward signaling using an ephrinB2 fusion protein in the absence of reverse signaling decreases tumor growth in vivo by inhibiting both growth-promoting and pro-invasive pathways
Our data demonstrated enhanced tumor growth with ephrinB2 knockdown and reduced tumor growth with ephrinB2 overexpression in vivo. Furthermore, the phosphorylation status of EphB4 decreased when ephrinB2 was knocked down and increased when ephrinB2 was overexpressed. Therefore, we asked whether the rescue of EphB4 activation status might reverse the increased tumor growth observed with ephrinB2 knockdown in vivo. To stimulate EphB4 (one of the dominant EphB receptors present in GBM) (Supporting Information Figure S4) in the absence of ephrinB2 in U87 ephrinB2 knockdown cells, we administered ephrinB2 Fc to U87 ephrinB2 sh tumor-bearing mice. EphrinB2 Fc treatment resulted in significant tumor growth suppression in U87 ephrinB2 sh tumors compared to those treated with control Fc (Figure 6A). At day 32 postimplantation, median tumor volume was 3.25-fold smaller in the ephrinB2 Fc treated group compared to the control group (Figure 6A). We did not observe any loss in body weight of these mice suggesting a lack of toxicity with the ephrinB2 Fc treatment (Figure 6B). As a proof-of-target, we also determined the levels of p-EphB4 in tumor tissue lysates harvested from both the control and the experimental group. We observed enhanced expression of p-EphB4 in the ephrinB2 Fc treated samples compared to control samples indicating activation of EphB4 signaling by ephrinB2 Fc in vivo (Figure 6C). To determine signaling molecules that could be contributing to reduced tumor growth, we analyzed the tumor tissues by Western blot analysis. The p-ERK levels decreased following stimulation of EphB4 receptor in vivo using ephrinB2 Fc recombinant protein (Figure 6C), without any change in p-AKT expression. This was accompanied by increase in the levels of E-cadherin in these tumors. The levels of Snail, FAK, on the other hand, were found to be decreased (Figure 6C). We also performed IHC on these tumors and found a decrease in the levels of PCNA staining, a surrogate marker for proliferation, and an invasive marker, vimentin (Figure 6D). These data demonstrate that the activation of EphB4 while blocking reverse signaling in GBM tumors may be an important therapeutic avenue for decreasing tumor growth and mitigating its pro-proliferative and pro-invasive behavior.
4 |. DISCUSSION
EphrinB2 has been implicated in tumorigenesis of GBM, but its role remains contradictory in light of the fact that it can act both as an oncogene and a tumor suppressor.16,17 Krusche et al16 used a GBM stem-like cell model to illustrate that malignant-transformation of GBM stem cells results in overexpression of ephrinB2 and disruption of boundaries set by ephrinB2 normally expressed on endothelial cells, promotes perivascular invasion. Moreover, they found that ephrinB2 reverse signaling enhances tumor cell proliferation,16 and inhibiting ephrinB2 using the B11 antibody fragment results in a significant decrease in tumor volumes and an increase in survival.16 In contrast, Depner et al17 used a different GBM model to demonstrate that genetic deletion of ephrinB2 in glioma cells alone is sufficient to induce the intrinsic invasive capacity of glioma cells resulting in larger tumor volumes. Interestingly, another group reported that a truncated form of ephrinB2 (lacking reverse signaling) on vascular endothelial cells inhibited intracranial tumor growth in a glioma model, which they attributed to decreased tumor vascularization.27
In the current study, we interrogated the TCGA database and found EFNB2 expression to be upregulated during malignant progression of glioma, leading us to investigate the role of ephrinB2 signaling in promoting tumor cell behavior in GBM. The results of our functional analysis, however, were contradictory to our initial hypothesis based on the TCGA analysis. Contrary to our prediction, the genetic knockdown of ephrinB2 increased tumor volumes, decreased EphB4 receptor activation, and limited survival in vivo, while overexpression of ephrinB2 decreased tumor volumes and increased EphB4 receptor activation. The increase in tumor growth with ephrinB2 knockdown are consistent with a previous report in an in vivo ephrinB2-knockout model.17 Our data, however, show for the first time that activation of EphB4 using an ephrinB2 Fc protein rescues the increase in tumor growth observed with ephrinB2 knockdown and presents a potential therapeutic modality.
A unique feature of the Eph-ephrin interaction, including EphB4-ephrinB2, is that it is capable of inducing forward signals into the receptor-expressing cell and reverse signals into the ligand-expressing cell. This bidirectional signaling further modulates the downstream cellular pathways,11,28 including invasion and proliferation, which is responsible for the treatment failure in GBM.29,30 A recent study found that upon EphB4 and ephrinB2 signaling in glioma, invasion was inhibited in cell-dense regions and enhanced in cell-sparse regions.31 A breast cancer model using a kinase-defective form of the EphB4 receptor found that reverse signaling between EphB4 and ephrinB2 promotes tumor growth and proliferation.23 Based on these reports, it is clear that the direction of signaling between EphB4 and ephrinB2 is an important avenue to consider when attempting to understand downstream effects.
We observed an interesting dichotomy between invasion and proliferation using ephrinB2 loss-of-function and gain-of-function constructs in our model, which was consistent with the established “go or grow” hypothesis in GBM.29,30,32–34 Supporting the published literature,17,23 we found that ephrinB2 reverse signaling induced by EphB4 stimulation is pro-proliferative and anti-invasive in GBM, while forward EphB4 signaling (stimulated by ephrinB2) is antiproliferative and pro-invasive. This suggests that ephrinB2 should not and cannot be a sole therapeutic target. The dichotomous effects in proliferation and invasion were therapeutically modifiable by using a combination of ephrinB2 knockdown and EphB4 stimulation with an ephrinB2 Fc protein ultimately overcoming the increase in tumor growth.
The activation of EphB4 by ephrinB2 Fc has been previously reported to inhibit tumor growth in vivo in a breast cancer model.35 The tumor-suppressive effect was mediated by the activation of Abl family of receptor tyrosine kinase and Crk adaptor protein following EphB4 stimulation that in turn resulted in decreased proliferation and survival of breast cancer cells.35 In another study by Miao et al,36 EphA2 was shown to inhibit AKT and Ras/mitogen-activated protein kinase (MAPK) following ephrinA1-mediated activation resulting in inhibition of cancer cell proliferation. Consistent with these findings, in our model, the antitumor effects were partly attributed to the negative regulation of MAPK pathway components, notably p-EGFR, p-ErbB4, and p-ERK. This is relevant considering their established role in promoting tumor growth and survival in GBM37,38 and that some of these pro-survival targets have already been exploited in clinical trials targeting GBM but with limited long-term benefit.39–42 Thus, manipulating Eph-ephrin interaction in this disease, allowing ephrinB2 inhibition, but EphB4 activation might represent an alternative way to target these growth factors and enhance antitumor response.
The pro-invasive effect, mediated via FAK, represents another druggable target. This is especially relevant given that FAK signaling is known to play a critical role in GBM migration.43,44 Gliomas have been shown to upregulate FAK, particularly at the invasive margins of the tumor,45 and FAK blockade using a pharmacological inhibitor has been reported to significantly decrease invasion in GBM cells.46 Consistent with these observations, our data suggest significant inhibition of invasive capacity of GBM tumor cells following FAK inhibition. Substantial amount of evidence in the literature exists suggesting an interplay between Eph-ephrins and FAK, a key component of integrin signaling.25,36,47,48 For instance, ephrinA1-induced actin reassembly in fibroblasts was shown to be dependent on the activation of FAK.47 In another study, it was reported that EphA2 is constitutively associated with FAK in resting cells, but following EphA2 stimulation with ephrinA1-Fc, FAK gets dephosphorylated, resulting in blockade of cell spreading in a prostate cancer model.36 In agreement with these findings, our results demonstrated a decrease in the levels of FAK in the ephrinB2 knockdown tumors following EphB4 stimulation indicating that the antitumor effects were in part associated with modulation in the FAK pathway. We also observed decreased FAK activity following the loss of ephrinB2 in orthotopically implanted GBM tumors suggesting FAK as one of the key candidate proteins affected by the manipulation of EphB4-ephrinB2 signaling that may have implications on future drug design.
Developing therapeutic interventions that target the Eph-ephrin family of proteins in GBM holds great promise. However, our results emphasize that in devising such therapeutics, one has to be mindful of the complex and dichotomous interactions that ensue as a result of Eph-ephrin bidirectional signaling. This is due to the fact that therapies designed to target an Eph receptor may also alter the signaling function of the ligand in adjacent cells in such a way as to negate any beneficial effect of receptor targeting. Overall, our findings suggest that concurrent use of agents that activate forward EphB4 signaling and block ephrinB2 reverse signaling may generate optimal therapeutic outcomes in GBM.
Supplementary Material
ACKNOWLEDGMENTS
Dr Sana D. Karam is funded by the NIDCR (R01 DE028529-01, R01 DE028282-01) and receives clinical trial funding from AstraZeneca for work unrelated to this study. All animal imaging and small animal irradiation for this manuscript were conducted using the Image Guided and Precision small animal Irradiator Core, which is supported by the Cancer Center Support Grant (P30CA046934). Cell growth assay was conducted using the IncuCyte machine at the shared resources core funded by CCSG (P30CA046934).
Funding information
National Institute of Dental and Craniofacial Research, Grant/Award Numbers: R01 DE028282-01, R01 DE028529-01
Footnotes
CONFLICT OF INTERESTS
The authors declare that there are no conflict of interests.
SUPPORTING INFORMATION
Additional supporting information may be found online in the Supporting Information section.
DATA AVAILABILITY STATEMENT
The data that support the findings of this study are available from the corresponding author upon reasonable request.
REFERENCES
- 1.Ostrom QT, Gittleman H, Kruchko C, Barnholtz-Sloan JS. Primary brain and other central nervous system tumors in Appalachia: regional differences in incidence, mortality, and survival. J Neurooncol. 2019;142(1):27–38. [DOI] [PubMed] [Google Scholar]
- 2.Xie Q, Mittal S, Berens ME. Targeting adaptive glioblastoma: an overview of proliferation and invasion. Neuro Oncol. 2014;16(12): 1575–1584. [DOI] [PMC free article] [PubMed] [Google Scholar]
- 3.Ostrom QT, Cote DJ, Ascha M, Kruchko C, Barnholtz-Sloan JS. Adult glioma incidence and survival by race or ethnicity in the United States from 2000 to 2014. JAMA Oncol. 2018;4(9):1254–1262. [DOI] [PMC free article] [PubMed] [Google Scholar]
- 4.Stupp R, Mason WP, van den Bent MJ, et al. Radiotherapy plus concomitant and adjuvant temozolomide for glioblastoma. N Engl J Med. 2005;352(10):987–996. [DOI] [PubMed] [Google Scholar]
- 5.Moore LD, Le T, Fan G. DNA methylation and its basic function. Neuropsychopharmacology. 2013;38(1):23–38. [DOI] [PMC free article] [PubMed] [Google Scholar]
- 6.Kwan KY, Sestan N, Anton ES. Transcriptional co-regulation of neuronal migration and laminar identity in the neocortex. Development. 2012;139(9):1535–1546. [DOI] [PMC free article] [PubMed] [Google Scholar]
- 7.Zuchero JB, Barres BA. Glia in mammalian development and disease. Development. 2015;142(22):3805–3809. [DOI] [PMC free article] [PubMed] [Google Scholar]
- 8.Bauke AC, Sasse S, Matzat T, Klambt C. A transcriptional network controlling glial development in the Drosophila visual system. Development. 2015;142(12):2184–2193. [DOI] [PubMed] [Google Scholar]
- 9.Gibson NJ, Tolbert LP, Oland LA. Activation of glial FGFRs is essential in glial migration, proliferation, and survival and in glia-neuron signaling during olfactory system development. PLOS One. 2012;7(4):e33828. [DOI] [PMC free article] [PubMed] [Google Scholar]
- 10.Parsons DW, Jones S, Zhang X, et al. An integrated genomic analysis of human glioblastoma multiforme. Science. 2008;321(5897):1807–1812. [DOI] [PMC free article] [PubMed] [Google Scholar]
- 11.Pasquale EB. Eph receptors and ephrins in cancer: bidirectional signalling and beyond. Nat Rev Cancer. 2010;10(3):165–180. [DOI] [PMC free article] [PubMed] [Google Scholar]
- 12.Nakada M, Kita D, Watanabe T, et al. Aberrant signaling pathways in glioma. Cancers. 2011;3(3):3242–3278. [DOI] [PMC free article] [PubMed] [Google Scholar]
- 13.Day BW, Stringer BW, Boyd AW. Eph receptors as therapeutic targets in glioblastoma. Br J Cancer. 2014;111(7):1255–1261. [DOI] [PMC free article] [PubMed] [Google Scholar]
- 14.Tu Y, He S, Fu J, et al. Expression of EphrinB2 and EphB4 in glioma tissues correlated to the progression of glioma and the prognosis of glioblastoma patients. Clin Transl Oncol. 2012;14(3):214–220. [DOI] [PubMed] [Google Scholar]
- 15.Nakada M, Anderson EM, Demuth T, et al. The phosphorylation of ephrin-B2 ligand promotes glioma cell migration and invasion. Int J Cancer. 2010;126(5):1155–1165. [DOI] [PMC free article] [PubMed] [Google Scholar]
- 16.Krusche B, Ottone C, Clements MP, et al. EphrinB2 drives perivascular invasion and proliferation of glioblastoma stem-like cells. eLife. 2016;5:e14845. [DOI] [PMC free article] [PubMed] [Google Scholar]
- 17.Depner C, Zum Buttel H, Böğürcü N, et al. EphrinB2 repression through ZEB2 mediates tumour invasion and anti-angiogenic resistance. Nat Commun. 2016;7:12329. [DOI] [PMC free article] [PubMed] [Google Scholar]
- 18.Holland SJ, Gale NW, Mbamalu G, Yancopoulos GD, Henkemeyer M, Pawson T. Bidirectional signalling through the EPH-family receptor Nuk and its transmembrane ligands. Nature. 1996;383(6602):722–725. [DOI] [PubMed] [Google Scholar]
- 19.Darmanis S, Sloan SA, Croote D, et al. Single-cell RNA-seq analysis of infiltrating neoplastic cells at the migrating front of human glioblastoma. Cell Rep. 2017;21(5):1399–1410. [DOI] [PMC free article] [PubMed] [Google Scholar]
- 20.Bhatia S, Griego A, Lennon S, et al. Role of EphB3 receptor in mediating head and neck tumor growth, cell migration, and response to PI3K inhibitor. Mol Cancer Ther. 2018;17(9):2049–2059. [DOI] [PMC free article] [PubMed] [Google Scholar]
- 21.Yushkevich PA, Piven J, Hazlett HC, et al. User-guided 3D active contour segmentation of anatomical structures: significantly improved efficiency and reliability. Neuroimage. 2006;31(3):1116–1128. [DOI] [PubMed] [Google Scholar]
- 22.Chen JR, Yao Y, Xu HZ, Qin ZY. Isocitrate dehydrogenase (IDH)1/2 mutations as prognostic markers in patients with glioblastomas. Medicine. 2016;95(9):e2583. [DOI] [PMC free article] [PubMed] [Google Scholar]
- 23.Noren NK, Lu M, Freeman AL, Koolpe M, Pasquale EB. Interplay between EphB4 on tumor cells and vascular ephrin-B2 regulates tumor growth. Proc Natl Acad Sci U S A. 2004;101(15):5583–5588. [DOI] [PMC free article] [PubMed] [Google Scholar]
- 24.Zeng L, Li T, Xu DC, et al. Death receptor 6 induces apoptosis not through type I or type II pathways, but via a unique mitochondria-dependent pathway by interacting with Bax protein. J Biol Chem. 2012;287(34):29125–29133. [DOI] [PMC free article] [PubMed] [Google Scholar]
- 25.Foo SS, Turner CJ, Adams S, et al. Ephrin-B2 controls cell motility and adhesion during blood-vessel-wall assembly. Cell. 2006;124(1):161–173. [DOI] [PubMed] [Google Scholar]
- 26.Abéngozar MA, de Frutos S, Ferreiro S, et al. Blocking ephrinB2 with highly specific antibodies inhibits angiogenesis, lymphangiogenesis, and tumor growth. Blood. 2012;119(19):4565–4576. [DOI] [PubMed] [Google Scholar]
- 27.Sawamiphak S, Seidel S, Essmann CL, et al. Ephrin-B2 regulates VEGFR2 function in developmental and tumour angiogenesis. Nature. 2010;465(7297):487–491. [DOI] [PubMed] [Google Scholar]
- 28.Salvucci O, de la Luz Sierra M, Martina JA, McCormick PJ, Tosato G. EphB2 and EphB4 receptors forward signaling promotes SDF-1-induced endothelial cell chemotaxis and branching remodeling. Blood. 2006;108(9):2914–2922. [DOI] [PMC free article] [PubMed] [Google Scholar]
- 29.Wang SD, Rath P, Lal B, et al. EphB2 receptor controls proliferation/migration dichotomy of glioblastoma by interacting with focal adhesion kinase. Oncogene. 2012;31(50):5132–5143. [DOI] [PMC free article] [PubMed] [Google Scholar]
- 30.Xia S, Lal B, Tung B, Wang S, Goodwin CR, Laterra J. Tumor micro-environment tenascin-C promotes glioblastoma invasion and negatively regulates tumor proliferation. Neuro Oncol. 2016;18(4):507–517. [DOI] [PMC free article] [PubMed] [Google Scholar]
- 31.Kawahara Y, Furuta T, Sabit H, et al. Ligand-dependent EphB4 activation serves as an anchoring signal in glioma cells. Cancer Lett. 2019;449:56–65. [DOI] [PubMed] [Google Scholar]
- 32.Azzarelli R, Simons BD, Philpott A. The developmental origin of brain tumours: a cellular and molecular framework. Development. 2018;145(10):dev162693. [DOI] [PMC free article] [PubMed] [Google Scholar]
- 33.Parker JJ, Canoll P, Niswander L, Kleinschmidt-DeMasters BK, Foshay K, Waziri A. Intratumoral heterogeneity of endogenous tumor cell invasive behavior in human glioblastoma. Sci Rep. 2018;8(1):18002. [DOI] [PMC free article] [PubMed] [Google Scholar]
- 34.Hatzikirou H, Basanta D, Simon M, Schaller K, Deutsch A. ‘Go or grow’: the key to the emergence of invasion in tumour progression? Math Med Biol. 2012;29(1):49–65. [DOI] [PubMed] [Google Scholar]
- 35.Noren NK, Foos G, Hauser CA, Pasquale EB. The EphB4 receptor suppresses breast cancer cell tumorigenicity through an Abl-Crk pathway. Nat Cell Biol. 2006;8(8):815–825. [DOI] [PubMed] [Google Scholar]
- 36.Miao H, Burnett E, Kinch M, Simon E, Wang B. Activation of EphA2 kinase suppresses integrin function and causes focal-adhesion-kinase dephosphorylation. Nat Cell Biol. 2000;2(2):62–69. [DOI] [PubMed] [Google Scholar]
- 37.Saadeh FS, Mahfouz R, Assi HI. EGFR as a clinical marker in glioblastomas and other gliomas. Int J Biol Markers. 2018;33(1):22–32. [DOI] [PubMed] [Google Scholar]
- 38.Brennan CW, Verhaak RG, McKenna A, et al. The somatic genomic landscape of glioblastoma. Cell. 2013;155(2):462–477. [DOI] [PMC free article] [PubMed] [Google Scholar]
- 39.Taylor TE, Furnari FB, Cavenee WK. Targeting EGFR for treatment of glioblastoma: molecular basis to overcome resistance. Curr Cancer Drug Targets. 2012;12(3):197–209. [DOI] [PMC free article] [PubMed] [Google Scholar]
- 40.Chakravarti A, Wang M, Robins HI, et al. RTOG 0211: a phase 1/2 study of radiation therapy with concurrent gefitinib for newly diagnosed glioblastoma patients. Int J Radiat Oncol Biol Phys. 2013; 85(5):1206–1211. [DOI] [PMC free article] [PubMed] [Google Scholar]
- 41.Sathornsumetee S, Desjardins A, Vredenburgh JJ, et al. Phase II trial of bevacizumab and erlotinib in patients with recurrent malignant glioma. Neuro Oncol. 2010;12(12):1300–1310. [DOI] [PMC free article] [PubMed] [Google Scholar]
- 42.Reardon DA, Nabors LB, Mason WP, et al. Phase I/randomized phase II study of afatinib, an irreversible ErbB family blocker, with or without protracted temozolomide in adults with recurrent glioblastoma. Neuro Oncol. 2015;17(3):430–439. [DOI] [PMC free article] [PubMed] [Google Scholar]
- 43.Natarajan M, Hecker TP, Gladson CL. FAK signaling in anaplastic astrocytoma and glioblastoma tumors. Cancer J. 2003;9(2):126–133. [DOI] [PubMed] [Google Scholar]
- 44.Natarajan M, Stewart JE, Golemis EA, et al. HEF1 is a necessary and specific downstream effector of FAK that promotes the migration of glioblastoma cells. Oncogene. 2006;25(12):1721–1732. [DOI] [PubMed] [Google Scholar]
- 45.Zagzag D, Friedlander DR, Margolis B, et al. Molecular events implicated in brain tumor angiogenesis and invasion. Pediatr Neurosurg. 2000;33(1):49–55. [DOI] [PubMed] [Google Scholar]
- 46.Golubovskaya VM, Huang G, Ho B, et al. Pharmacologic blockade of FAK autophosphorylation decreases human glioblastoma tumor growth and synergizes with temozolomide. Mol Cancer Ther. 2013; 12(2):162–172. [DOI] [PMC free article] [PubMed] [Google Scholar]
- 47.Carter N, Nakamoto T, Hirai H, Hunter T. EphrinA1-induced cytoskeletal re-organization requires FAK and p130(cas). Nat Cell Biol. 2002;4(8):565–573. [DOI] [PubMed] [Google Scholar]
- 48.Bhatia S, Sharma J, Bukkapatnam S, et al. Inhibition of EphB4-EphrinB2 signaling enhances response to cetuximab-radiation therapy in head and neck cancers. Clin Cancer Res. 2018;24(18):4539–4550. [DOI] [PMC free article] [PubMed] [Google Scholar]
Associated Data
This section collects any data citations, data availability statements, or supplementary materials included in this article.
Supplementary Materials
Data Availability Statement
The data that support the findings of this study are available from the corresponding author upon reasonable request.