Abstract
Background:
The ongoing global coronavirus disease 2019 (COVID-19) pandemic is posing a serious public health threat to nations worldwide. Understanding the pathogenesis of the disease and host immune responses will facilitate the discovery of therapeutic targets and better management of infected patients. Metabolomics technology can provide an unbiased tool to explore metabolic perturbation.
Methods:
Twenty-six healthy controls and 50 COVID-19 patients with mild, moderate, and severe symptoms in the Fifth Medical Center of PLA General Hospital from January 22 to February 16, 2020 were recruited into the study. Fasting blood samples were collected and subject to metabolomics analysis by liquid chromatography–mass spectrometry. Metabolite abundance was measured by peak area and was log-transformed before statistical analysis. The principal component analysis, different expression analysis, and metabolic pathway analysis were performed using R package. Co-regulated metabolites and their associations with clinical indices were identified by the weighted correlation network analysis and Spearman correlation coefficients. The potential metabolite biomarkers were analyzed using a random forest model.
Results:
We uncovered over 100 metabolites that were associated with COVID-19 disease and many of them correlated with disease severity. Sets of highly correlated metabolites were identified and their correlations with clinical indices were presented. Further analyses linked the differential metabolites with biochemical reactions, metabolic pathways, and biomedical MeSH terms, offering contextual insights into disease pathogenesis and host responses. Finally, a panel of metabolites was discovered to be able to discriminate COVID-19 patients from healthy controls, and also another list for mild against more severe cases. Our findings showed that in COVID-19 patients, citrate cycle, sphingosine 1-phosphate in sphingolipid metabolism, and steroid hormone biosynthesis were downregulated, while purine metabolism and tryptophan metabolism were disturbed.
Conclusion:
This study discovered key metabolites as well as their related biological and medical concepts pertaining to COVID-19 pathogenesis and host immune response, which will facilitate the selection of potential biomarkers for prognosis and discovery of therapeutic targets.
Keywords: COVID-19, Functional metabolites, Host immune response, Metabolomics, Pathway analysis
Introduction
Coronavirus disease 2019 (COVID-19), which is caused by the severe acute respiratory coronavirus 2 (SARS CoV-2), had infected more than 141 million people and taken more than 3 million lives worldwide as of April 18, 2021.[1] The clinical manifestation of the virus infection can be quite diverse, including asymptomatic infection, fever, cough, loss of taste and smell, lymphocytopenia, mild upper respiratory tract illness, gastrointestinal symptoms, viral pneumonia with respiratory failure, and even death.[2] Laboratory findings showed that non-survivors had an increased level of white blood cell count, anemia, alanine transaminase, lactate dehydrogenase, creatine kinase, high-sensitivity cardiac troponin, d-dimer, serum ferritin, IL-6 and procalcitonin, and decreased level of lymphocyte count, platelet count, and albumin.[3] In addition to viral virulence, disease severity also depends on host factors, such as immune response to infection. Some evidence showed that rapid deterioration in some patients can be attributed to cytokine storm, which is a hyper-inflammatory phenotype characterized by the dysregulated release of cytokine, leading to vascular damage, acute respiratory distress syndrome, multi-organ failure, and death.[4–6] Therefore, it is critical to discover the fundamental mechanism underlying viral pathogenesis and immunity abnormalities, to guide clinical management of the disease.
Multiple omics technologies, including genomics, transcriptomics, proteomics, metabolomics, and lipidomics, have been successfully applied to obtain a comprehensive view of the interaction between viruses and the host system. Infections caused by various viruses were reported to alter host metabolic profiles, even years after recovery.[7] Small molecular metabolites like nucleic acids, amino acids, and fatty acids are also essential for rapid virus replication. A recent study leveraged a combination of transcriptomics, proteomics, and metabolomics technologies to identify blood molecular markers associated with COVID-19 immunopathology and multi-organ damage, and found that chronic activation of neutrophils, IFN-I signaling, and a high level of inflammatory cytokines was associated with severe disease progression.[8] Malic acid in citrate cycle (TCA cycle) and carbamoyl phosphate of the urea cycle, sphingosine 1-phosphate (S1P) in sphingolipid metabolism pathway, kynurenine in tryptophan–nicotinamide pathway, and cytosine metabolism were also identified in other metabolomics studies to be linked to COVID-19.[9–13]
In this study, we performed untargeted high-resolution mass spectrometry on the plasma of 26 healthy controls and 50 COVID-19 patients with mild, moderate, and severe disease. We systematically investigated key differential metabolites and metabolic pathways related to COVID-19 pathogenesis.
Methods
Ethical approval
The study was performed in accordance with the Declaration of Helsinki principle for ethical research. The study protocol was approved by Ethics Committee of the Fifth Medical Center of PLA General Hospital. Written informed consent was waived by the Ethics Committee of the designated hospital for emerging infectious disease.
Study design and population
Fifty patients diagnosed with SARS-CoV-2 infection by the nucleic acid test were recruited from January 22 to February 16, 2020, in the Fifth Medical Center of PLA General Hospital. Twenty-six healthy individuals consisting of doctors, nurses, and researchers from the same hospital were enrolled as controls. The blood samples were collected from COVID-19 patients and healthy controls after overnight fasting (Fig. 1). For patients, their blood samples were collected within 24 hours upon hospital admission. Metabolite extraction was carried out according to a modified Bligh and Dyer protocol.[14] Chromatographic separation was performed on a reversed-phase ACQUITY UPLC HSS T3 1.8 μm column (i.d. 3.0 × 100 mm) (Waters, Dublin, Ireland) using an ultra-performance liquid chromatography (LC) system (Agilent 1290 Infinity II; Agilent Technologies) as described previously.[15] Mass spectrometry (MS) was performed using a high-resolution time-of-flight (TOF) mass spectrometer (5600 Triple TOF Plus, Sciex) equipped with an ESI source as previously reported.[16] Metabolite identities were manually annotated, taking into account the exact mass, the retention time of the standard references, MS/MS spectrum signatures which were compared with records in HMDB (https://hmdb.ca) and METLIN (https://metlin.scripps.edu), and literature records. Reference database identifiers were assigned according to HMDB and KEGG (https://www.kegg.jp). Metabolite quantitation was achieved using a cocktail of 45 spiked-in isotopically labeled internal standards that were purchased from Cambridge Laboratories, including l-phenylalanine-d8, l-tryptophan-d8, l-isoleucine-d10, l-asparagine-13C4, l-methionine-d3, l-valine-d8, l-proline-d7, l-alanine-d7, dl-serine-d3, dl-glutamic acid-d5, l-aspartic acid-d3, l-arginine-d7, l-glutamine-d5, l-lysine-d9, l-histidine-d55 taurine-d2, betaine-d11, urea-(13C,15N2), l-lactate-13C3, trimethylamine N-oxide-d9, choline-d13, malic acid-d3, citric acid-d4, succinic acid-d4, fumaric acid-d4, hypoxanthine-d3, xanthine-15N2, thymidine (13C10,15N2), inosine-15N4, cytidine-13C5, uridine-d2, methylsuccinic acid-d6, benzoic acid-d5, creatine-d3, creatinine-d3, glutaric acid-d4, glycine-d2, kynurenic acid-d5, l-citrulline-d4, l-threonine-(13C4,15N), l-tyrosine-d7, P-cresol sulfate-d7, sarcosine-d3, trans-4-hydroxy-l-proline-d3, and uric acid-(13C; 15N3). Metabolite peak area was normalized using its isotopically labeled internal standard if available, or otherwise another internal standard of the same class, comparable peak intensities, and similar retention time, and it was verified by examining coefficient of variance (CoV) in quality control samples. The severity of the disease condition was determined based on the guidelines for the diagnosis and management of COVID-19 patients (7th edition) by the National Health Commission of China. Detailed sample processing and LC–MS analysis methods were described in our previous paper.[17]
Figure 1.
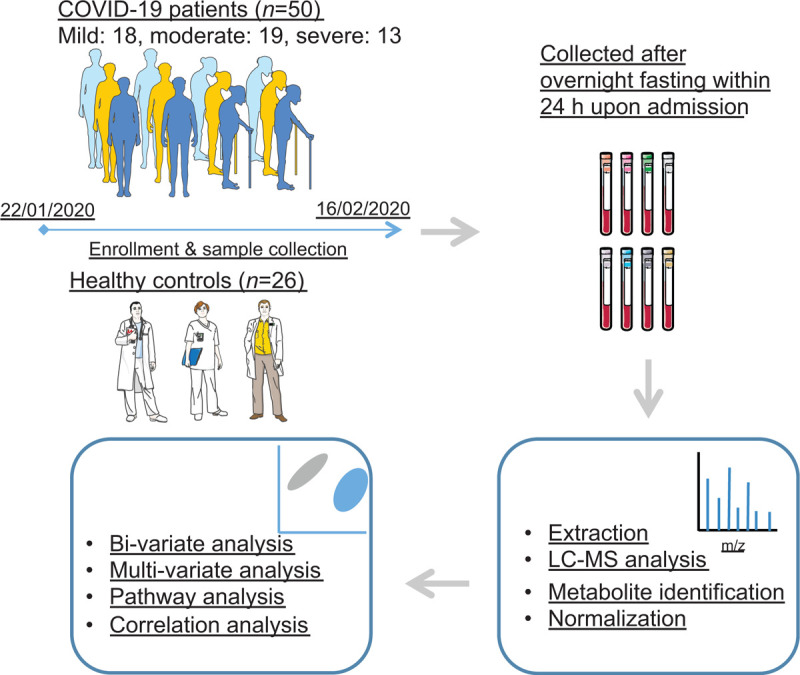
The schematic diagram of study participants, sample collection procedure, and analysis workflow.
Statistical analysis
Metabolite abundance was measured by peak area and was log-transformed before statistical analysis.
The principal component analysis (PCA) was conducted on centered and scaled values using R package “FactoMineR”.[18] The orthogonal partial least square discriminant analysis (OPLSDA) was performed using R package “ropls”.[19] Over-fitting was assessed by pR2Y and PQ2 derived from permutation analysis (20 times) with 7-fold cross-validation. Hierarchical clustering with complete linkage and Euclidean distance was visualized using R package “pheatmap”. Metabolite set enrichment analysis (MSEA)[20] was performed based on the metabolites with Welch's t test false discovery rate (FDR) < 0.05 over the small molecules pathway database[21] using R package “MetaboAnalystR”.[22] The over-representation test for MSEA is hypergeometric test using all the annotated metabolites that can be mapped to HMDB IDs as the reference metabolome. Only metabolite sets with more than two hits (significant metabolites) were included.
Different expression analyses were performed on the 358 metabolites, (model 1) between healthy controls (n = 26) and patients (n = 50), and (model 2) between controls and severity groups (mild = 18, moderate = 19, and severe = 13), respectively, using R package “limma”.[23] The linear models were adjusted for age, sex, and body mass index (BMI), and estimated log fold change was moderated by the empirical Bayes method toward a global trend. The Benjamini–Hochberg (BH) procedure was employed to control the FDR. The adjusted P-value (FDR) was considered statistically significant if it is lower than 0.05. Results from models 1 and 2 were combined and presented in Figure 2. The upset plots showing co-occurring metabolites among different comparisons were made using R package “UpSetR”.
Figure 2.
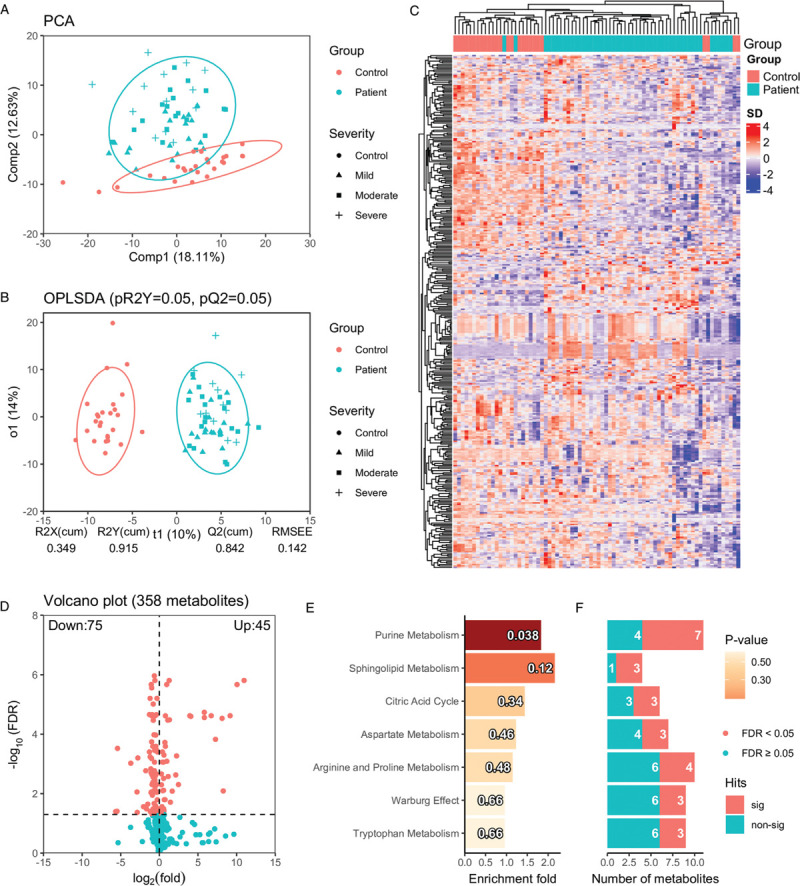
Global metabolic perturbation in COVID-19 patients compared with healthy controls. (A) The principal component analysis shows the overall distribution pattern in plasma metabolites in healthy controls and COVID-19 patients. The first and second components from the principal component analysis explained 18.11% and 12.63% total variance. Concentration ellipses are at a 95% level based on a multivariate normal distribution. (B) The OPLSDA analysis shows the classification of healthy controls and COVID-19 patients based on the annotated metabolites, where predictive component (t1) and first orthogonal component (o1) explain 10% and 14% total variance in X (X: metabolomics data, Y: class label). pR2Y and pQ2 were derived from repeated permutations (20 times) with 5-fold cross-validation. (C) The hierarchical clustering analysis using all the annotated metabolites. (D) The volcano plot shows log2 fold change (based on original peak area) and FDR (cut-off at 0.05) based on Welch t-test P-values of the annotated metabolite. (E) The barplot shows the enrichment fold for metabolite sets with more than 2 hits in increasing order of P-value from top to bottom. The P-values are indicated in each bar. The numbers of identified metabolites in each metabolite set that are statistically significant (FDR < 0.05) and not significant are shown (F). COVID-19: coronavirus disease 2019; OPLSDA: orthogonal partial least square discriminant analysis; FDR: false discovery rate.
Metabolic pathway analysis (MetPA)[24] was performed using differential metabolites (FDR < 0.5) from the linear models against the human metabolic pathway database from KEGG. P-values were derived from a hypergeometric test with the reference metabolome defined by all the annotated metabolites that can be mapped to KEGG IDs. Enrichment fold was calculated as the ratio of the observed number of differential metabolites in the pathway over the expected number. Pathway impact (range from 0 to 1) was defined as the sum of individual metabolite impact within a pathway network, which was derived from the number of connections (reactions) to other metabolites, such that highly connected metabolites impact the pathway at a higher level. Up-regulated and down-regulated metabolites were determined based on the log fold change from the linear models.
For the integration of metabolomics data and KEGG reaction information, the biochemical reactions were based on KEGG RPAIR (http://www.genome.jp/kegg/reaction/, ftp://ftp.gen-ome.jp/pub/db/rclass/rpair) substrate-product reaction database. Up-regulated and down-regulated metabolites were determined based on the log fold change and adjusted P-value (FDR < 0.05) from the linear models. The biochemical reaction network was generated using R package “igraph”.[25]
For enrichment analyses of Medical Subject Headings (MeSH) terms, MeSH terms associated with the metabolites were retrieved from Metab2MeSH (http://metab2mesh.ncibi.org), which is a database of metabolite-MeSH co-occurrence relationship generated by text mining of biomedical literature, via Cytoscape plugin “MetDisease”.[26] Hypergeometric test was employed for the over-representation analysis, using all the differential metabolites from the linear models that can be mapped to KEGG IDs as the reference.
To identify co-regulated metabolites and their association with clinical indices, weighted correlation network analysis was performed on the differential metabolites from the linear models using R package “WGCNA”.[27] Spearman correlation coefficients were calculated between module eigenvalues and clinical indices, the same for the metabolites assigned to each module. Only correlations with FDR < 0.05 were colored, while non-significant correlations were shown as white. Rows or columns without any significant correlations were excluded.
To identify potential metabolite biomarkers that can distinguish COVID-19 patients from healthy controls, as well as between different severity groups, a random forest (RF) model was employed. The RF model was chosen mainly for three reasons: (1) it can handle thousands of variables and is robust with respect to non-informative variables and collinearity; (2) RF model can estimate variable importance in the classification; and (3) It is less susceptible to over-fitting.[28] The whole data set was repeatedly split into a training set and an external validation set. The inner loop of repeated cross-validation trains and tunes an RF model, and an up-sampling step helps balance sample sizes of the groups. Also, the outer loop evaluates the model using hold-out samples. Receiver operating characteristic (ROC) was selected for model performance evaluation because it is less biased for unbalanced data, and was calculated using R package “pROC”.[29] A permutation procedure was also implemented to assess the likelihood of model over-fitting. The machine learning procedure was implemented using R package “caret”.
All statistical analyses were performed in R 4.0.2 (https://www.R-project.org/).
Results
Untargeted metabolomics analysis of plasma serum samples from 26 healthy control and 50 COVID-19 patients was carried out on an LC–MS platform. Four hundred and four metabolites were manually annotated and quantitated using internal standards, from which 358 metabolites were included in the analysis after removing lipid species covered in the targeted lipidomics data set in our previous paper.[13] The PCA (Fig. 2A) presented a strong association between disease status and plasma metabolome along with its second component, which accounts for 12.63% of the overall variance. Besides, mild and moderate cases tend to be closer to controls compared with severe cases. Similar to the PCA, the hierarchical clustering analysis (Fig. 2C) also achieved fair aggregation of healthy controls and COVID-19 patients and revealed distinct patterns of co-regulated metabolites. The OPLSDA (Fig. 2B) further confirmed that COVID-19 cases could be well distinguished from healthy controls, with good prediction generalizability (empirical P by 20 permutations: pR2Y = 0.05, pQ2 = 0.05). Seventy-five down-regulated and 45 up-regulated metabolites were identified by Welch t test (FDR < 0.05) and shown in the volcano plot (Fig. 2D), which were further shown to be enriched in purine metabolism (Fig. 2E/2F, P < 0.05, 7/11 hits). A large number (≥3) of significant metabolites were also found to locate in other pathways, like sphingolipid metabolism, citric acid cycle, aspartate metabolism, arginine and proline metabolism, Warburg effect, and tryptophan metabolism.
Baseline characteristics of the study cohort, including age, sex, and BMI were compared in the previous paper, showing positive associations between age (P < 0.001) and BMI (P = 0.013) with disease severity.[17] To account for potential confounders, two linear models, adjusting for age, sex, and BMI were constructed to compare healthy controls and COVID-19 patients, as well as between healthy controls and patients with different disease severity. Thirty-one metabolites were identified to be associated with disease status, as well as disease severity. Among them, 21 metabolites were down-regulated in patients, and also were decreased in the severe group, compared with the mild and moderate group; while 10 metabolites were increased in patients, and also were higher in the moderate group compared with the mild group (Fig. 3A). In total, 125 metabolites were down-regulated in the COVID-19 patients and 30 metabolites were up-regulated (Fig. 3B and 3C). Next, MetPA identified a steroid hormone biosynthesis pathway that was enriched by the differential metabolites from the linear models. Aldosterone, cortisol, and androsterone glucuronide were down-regulated in the severe group compared with the mild and the moderate group. In the comparison of healthy control and patients, the steroid hormone biosynthesis pathway was also identified among the top enriched pathways. Additionally, although P values were not significant (P > 0.05) for pathways like sphingolipid metabolism, TCA cycle, and purine metabolism, there were still a large fraction of metabolites that were differentially regulated in these pathways, indicating that these pathways were largely affected by the disease condition (Table 1). The annotated metabolites were then mapped to KEGG RPAIR reaction substrate-product database based on their KEGG IDs (Fig. 4). The majority of the metabolites were down-regulated in COVID-19 patients. Node size indicates the absolute log fold change of the metabolite. Based on their node sizes, sphinganine, sphinganine 1-phosphate, and S1P could be easily identified as the most significantly down-regulated metabolites (Fig. 4A). Besides, metabolites from the TCA cycle pathway, like fumaric acid, succinic acid, l-malic acid, and citric acid were also down-regulated. Differential metabolites from the linear models were further annotated by MeSH terms using Metab2MeSH (http://metab2mesh.ncibi.org) database and top enriched terms were shown in Figure 5 for each comparison. More MeSH terms were significantly enriched for the differential metabolites from the comparison of mild and severe patients, such as “genital diseases, female”, “sleep disorder, intrinsic”, “chronic disease”, etc. For comparison of healthy controls and patients, “water-electrolyte imbalance”, “tumor virus infections”, “Lesch-Nyhan syndrome” were the top three enriched terms.
Figure 3.
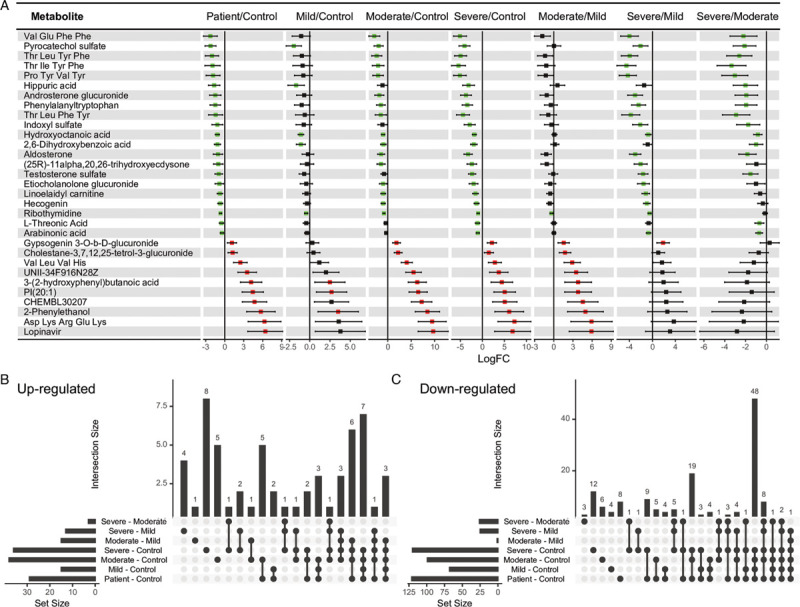
Differential analyses using linear models. (A) The forest plot shows log fold change (logFC) of 31 metabolites, adjusted for age, sex, and BMI using a linear model. Green color indicates logFC < 0 and FDR < 0.05, red color indicates logFC > 0 and FDR < 0.05, and the black color indicates FDR > 0.05. Two linear models were fitted: the first one compared COVID-19 patients (n = 50) with healthy controls (n = 26), and model 2 did pair-wise comparisons between healthy controls (n = 26) and patients in different severity groups (mild = 18, moderate = 19, and severe = 13). Only differential metabolites with FDR < 0.05 for patient vs. control, at least one FDR < 0.05 in severity subgroup vs. control, and at least one FDR < 0.05 in severity subgroup comparison are presented. (B) and (C) The upset plots show the number of co-occurring metabolites in each comparison. BMI: body mass index; FDR: false discovery rate; COVID-19: coronavirus disease 2019.
Table 1.
Results of MetPA of differential metabolites.
| Groups | KEGG Pathway | Hits/Total, Enrichment, Impact | P value | Metabolites (up-regulated/down-regulated) |
|---|---|---|---|---|
| Patient–control | ||||
| Sphingolipid metabolism (hsa00600) | 4/5,2.12,0.21 | 0.065 | Down-regulated:Sphingosine 1-phosphate (C06124), Sphinganine 1-phosphate (C01120), Sphinganine (C00836), Phytosphingosine (C12144) | |
| Citrate cycle (TCA cycle) (hsa00020) | 4/6,1.76,0.20 | 0.142 | Down-regulated:Succinate (C00042), (S)-Malate (C00149), Citrate (C00158), Fumarate (C00122) | |
| Steroid hormone biosynthesis (hsa00140) | 3/4,1.99,0.01 | 0.149 | Down-regulated:Aldosterone (C01780), Etiocholan-3alpha-ol-17-one 3-glucuronide (C11136), Androsterone glucuronide (C11135) | |
| Purine metabolism (hsa00230) | 5/9,1.47,0.16 | 0.211 | Up-regulated:Xanthine (C00385), Hypoxanthine (C00262)Down-regulated:IMP (C00130), Adenosine (C00212), Urate (C00366) | |
| Severe–mild | ||||
| Steroid hormone biosynthesis (hsa00140) | 4/4,15.00,0.04 | 5.87E-06 | Down-regulated:Aldosterone (C01780), Cortisol (C00735), Etiocholan-3alpha-ol-17-one 3-glucuronide (C11136), Androsterone glucuronide (C11135) | |
| Severe–moderate | ||||
| Steroid hormone biosynthesis (hsa00140) | 3/4,13.50,0.04 | 3.35E-04 | Down-regulated:Aldosterone (C01780), Cortisol (C00735), Androsterone glucuronide (C11135) | |
MetPA: metabolic pathway analysis.
Only the top pathways (ranked by P-value) with hits >2 are listed.
Figure 4.
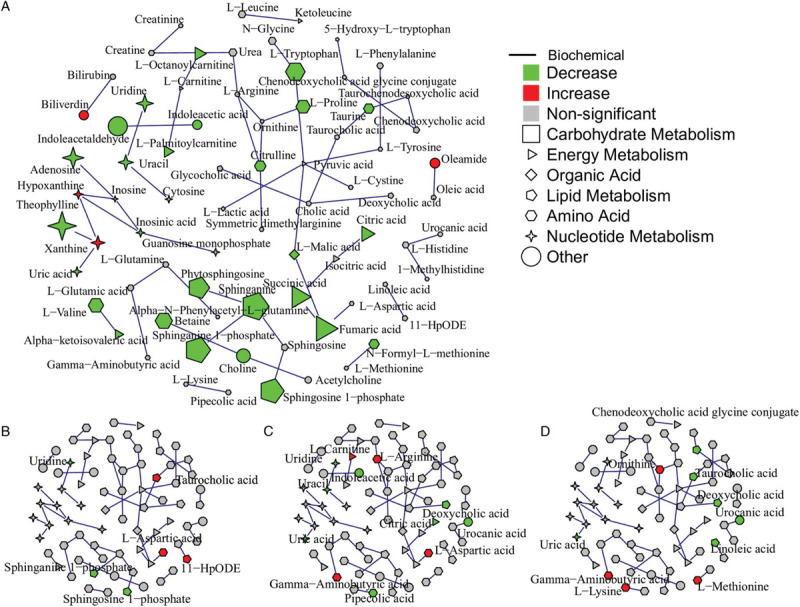
Integration of metabolomics data and KEGG reaction information in an undirected network. Node shape indicates biochemical functions of the metabolite. Edges were generated based on KEGG RPAIR substrate-product reaction database. (A) Differential metabolites (FDR < 0.05) from the comparison of healthy controls and patients are mapped to the network. Node size indicates the absolute log fold change of the metabolites. (B) to (D) Differential metabolites (P < 0.05) from the comparison of mild and moderate patients, mild and severe, moderate and severe are mapped to the network, respectively.
Figure 5.
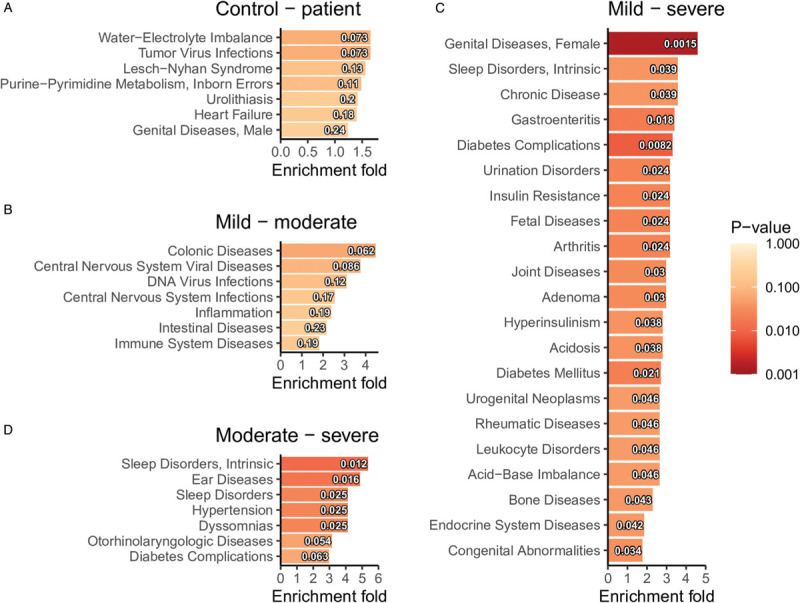
Enrichment analyses of MeSH terms based on the differential metabolites (FDR < 0.05 from the linear models) for each comparison: (A) control and patient, (B) mild and moderate, (C) mild and severe, and (D) moderate and severe. MeSH: medical subject headings; FDR: false discovery rate.
Subsequently, co-regulated metabolites were identified from 50 COVID-19 patients, and their associations with clinical indices were assessed using Spearman correlation. Nine modules were identified by weighted gene correlation network analysis (WGCNA) (Fig. 6A). Among these modules (Fig. 6B), the turquoise module was positively associated with total bilirubin, hemoglobin, and albumin. The yellow module was negatively associated with C-reactive protein, lactate dehydrogenase, and interleukin-6. The grey module was positively associated with serum creatinine. The black module was positively associated with the serum ferritin, and the brown module was negatively associated with the onset of symptoms to sampling in days. Individual metabolite's correlation with clinical indices was shown in Figure 6C. For example, short peptides in the turquoise module, like “Arg Trp Cys His”, “Asp Asp Phe”, “Met Glu Ser”, “Phe Asp Asp”, and “Pro Asp Val Val” were positively associated with hemoglobin, total bilirubin, and albumin consistent with the results in Figure 6B.
Figure 6.
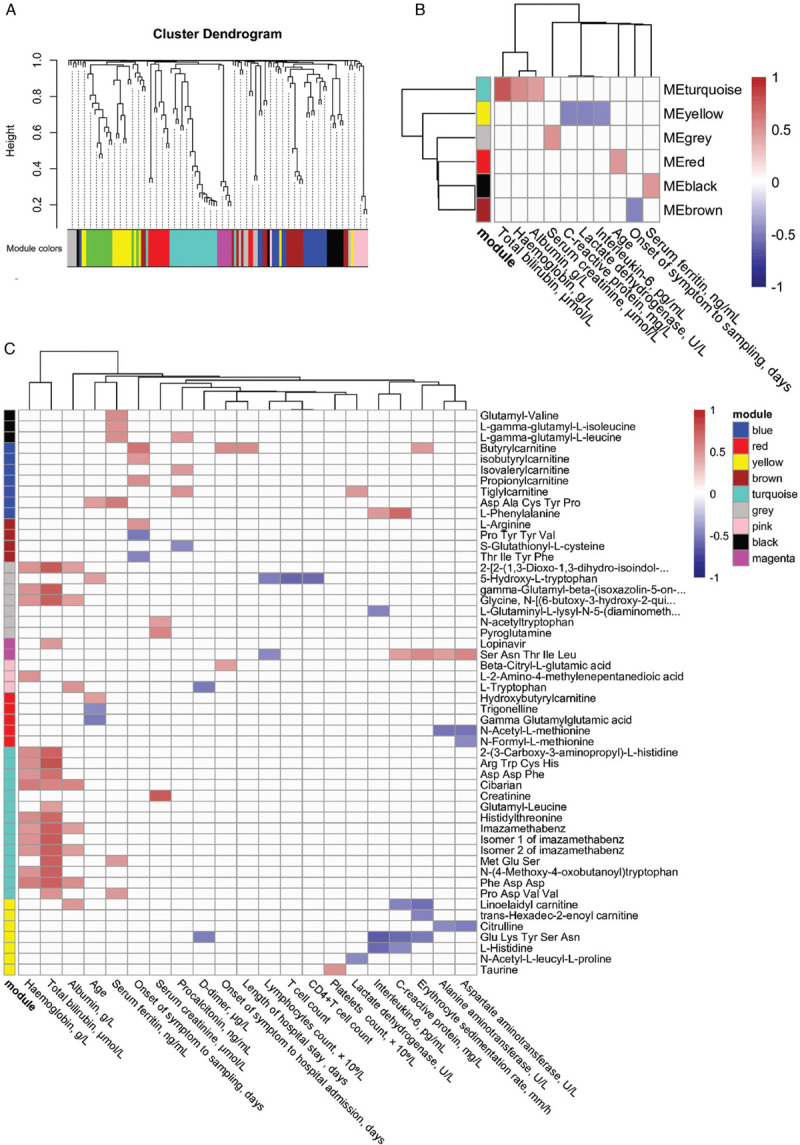
Weighted correlation network analysis and correlation with clinical indices. (A) Metabolite dendrogram obtained by average linkage hierarchical clustering. The color strip below the dendrogram shows the corresponding module assignment. (B) Correlation heatmap shows Spearman correlation (FDR < 0.05) between module eigenvalues and clinical indices. (C) The correlation heatmap shows the Spearman correlation (FDR < 0.05) of the metabolites in each module and clinical indices. FDR: false discovery rate.
To discover potential metabolite biomarkers that can distinguish healthy controls from COVID-19 patients, as well as more severe patients from milder cases, a conservative classification procedure with external validation and permutation was implemented (Fig. 7A). The RF model was able to classify controls and patients very well (median AUC: 1.000), while the median AUC was 0.600 for the permuted data (Fig. 7B). The model was also able to classify mild against moderate and severe cases, at a moderate accuracy (median AUC 0.750), compared with median AUC 0.583 for the permuted data. The severe patients could not be well separated from the mild and moderate cases, as the permuted data yielded the same AUC as the original data (P = 0.600). The top ten metabolites of the highest variable importance obtained from the corresponding RF model were listed in Figure 7B.
Figure 7.
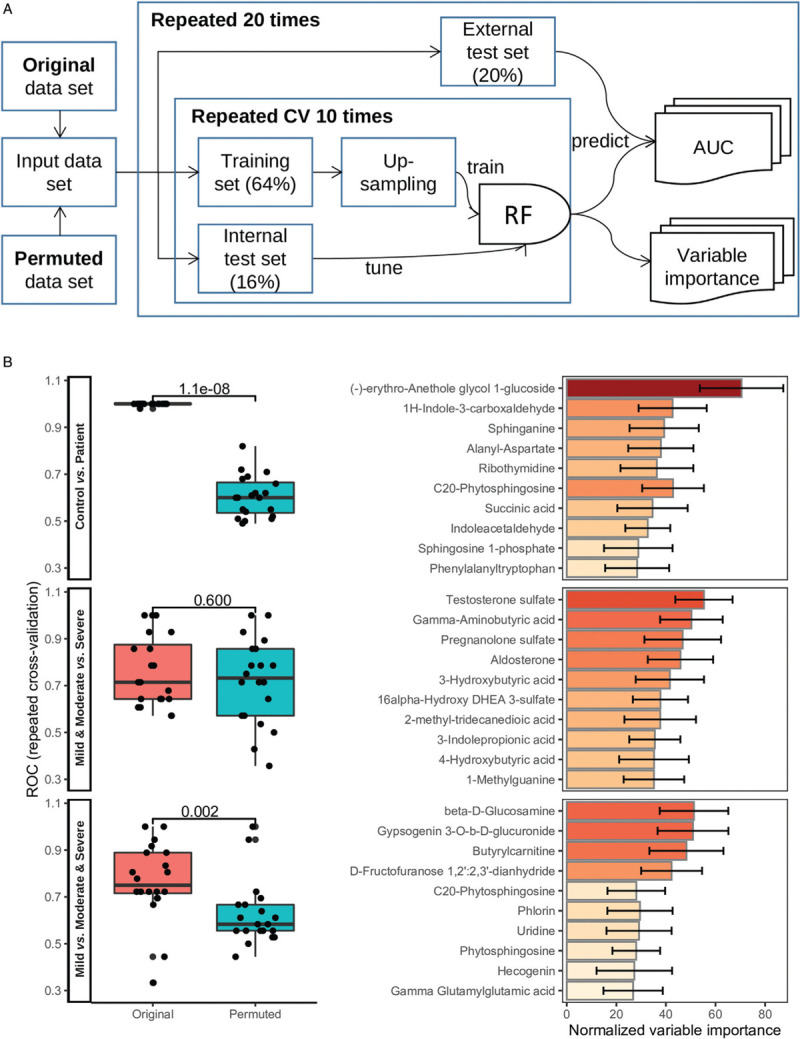
Discovery of potential metabolite biomarkers for COVID-19. (A) The schematic diagram shows the RF model training and validation workflow. (B) The boxplots show the area under the ROC based on the original and permuted data set in 20 repeated experiments, for the three models that classify controls against patients, mild and moderate against severe, and mild against moderate and severe, respectively. Mann-Whitney U test P values were indicated above the boxplot. The corresponding barplots show the normalized variable importance obtained from the RF models in the repeated experiments for the top 10 metabolites. COVID-19: coronavirus disease 2019; RF: random forest; ROC: receiver operating characteristic.
Discussion
The results from this study showed that plasma metabolites are associated with COVID-19 disease status and severity, and highlighted key pathways related to metabolic alterations in COVID-19 pathogenesis.
So far, several case–control studies have been published which investigated the association between blood metabolome and SARS CoV-2 virus infection, as well as disease severity and clinical outcome prognosis.[9,10,13,30,31] Overall, a profound metabolic disturbance was observed in COVID-19 patients compared with healthy individuals. Circulating levels of S1P in the sphingolipid metabolism pathway, kynurenine in the tryptophan–nicotinamide pathway, and suppression of energy metabolism were found to be potential biomarkers with good discriminant ability in multiple studies.
Sphingolipids are a class of lipids that are important signaling molecules. S1P playing a key role in sphingolipid metabolism, functions as a pro-survival signal, and enhances cell proliferation and differentiation. In our analysis, S1P, sphinganine 1-phosphate, and sphinganine, from the sphingolipid metabolism pathway were found to be down-regulated in COVID-19 patients. S1P was reported to be reduced in COPD and COVID-19 and is a good marker of disease severity.[17,32,33] Of note, the S1P–S1P receptor signaling system plays an important role in the inflammatory processes.[34]
TCA cycle metabolites were also reduced in COVID-19 patients compared with healthy controls. The same was also reported in several other clinical studies.[8,9] Enzymes in TCA cycle, including ACO2, IDH, OGDH, DLD, SDH, and MDH were reduced, while essential enzymes for fatty acids synthesis like ACAC and FASN were increased. An animal study that constructed a murine model by expressing ACE2 transgene in multiple tissues also found suppression of mitochondrial function based on blood metabolites and gene expression.[35] It was postulated that the reduction in TCA cycle metabolites could be due to viral replication competing for malic acid and aspartate for purine and pyrimidine nucleotide biosynthesis. Besides, hypoxanthine and xanthine in the purine metabolism pathway were found to be elevated in COVID-19 patients, in accordance with the previous studies.[9,36] Blood hypoxanthine concentration is a sensitive marker of hypoxia and it was proposed that an increased level of hypoxanthine could be produced from the breakdown of ATP, which was excreted to extracellular space, triggered by inflammation and hypoxia.[36] In summary, these pieces of evidence reveal energy metabolism dysregulation at a large scale in COVID-19.
We found that three out of nine metabolites in tryptophan metabolism were significantly different in COVID-19 patients compared with healthy controls (Fig. 2F). 5-Hydroxy-l-tryptophan was up-regulated in patients, and l-tryptophan, indole acetaldehyde were down-regulated. Tryptophan is an essential amino acid that can be metabolized to kynurenines, a family of compounds with important physiological roles, involved in inflammation, immune response, and excitatory neurotransmission. The tryptophan-kynurenine pathway accounts for more than 90% of tryptophan depletion, by enzyme Trp 2,3-dioxygenase in the liver and indoleamine 2,3-dioxygenase (IDO) in other tissues. It was proposed that Interferon IFN-γ-induced IDO depletes plasma tryptophan and produces kynurenine, underpinning the antibacterial, antiparasitic, and antiviral effects of cytokine.[37] On the other hand, 5-hydroxytryptophan (5-HTP) was reported to exhibit a proviral effect for the human parainfluenza virus.[38] It was shown in Figure 6C that tryptophan was negatively correlated with d-dimer, and positively correlated with albumin, suggesting an association with good liver function and vascular health. 5-HTP was negatively correlated with lymphocyte count, T cell count, and CD4+T cell count, and positively correlated with age, potentially associated with a worse prognosis. Taken together, the shift from tryptophan-kynurenine to tryptophan-5-HTP pathway could indicate the patients were at a stage of rapid virus replication, organ damage, and suboptimal immune response at the beginning of hospitalization.
Our results also showed that steroid hormone biosynthesis was down-regulated in the severe cases, including aldosterone, cortisol, etiocholan-3alpha-ol-17-one 3-glucuronide, and androsterone glucuronide. A recent study reported an association between high serum total cortisol concentrations and mortality from COVID-19,[39] which seems to contradict our results. But later correspondence to the article stated that both adrenocorticotropic hormone and cortisol are pulsatile and have large inter-individual variation.[40] A one-time point plasma cortisol measurement by untargeted LC–MS method might be biased, compared with the reference method. But its wide coverage of metabolites in the steroid hormone biosynthesis pathway can help shed light on the mechanism of cortisol in critically ill COVID-19 patients.
In this study, we profiled plasma metabolites of blood samples collected from 50 COVID-19 patients and 26 healthy controls upon hospital admission. This case–control study design is susceptible to sample bias, and the sample size is relatively small with respect to the large number of metabolites measured using an omics approach. Although common confounders such as age, sex, and BMI were adjusted in the linear models, residual confounding could still exist and other potential confounders were not included due to the small sample size. Although log fold change value was moderated using Bayes approach toward a common trend, subtle differences might be missed due to lack of power. Disease severity of COVID-19 patients was assessed at the point of blood sample collection, but the time from showing symptoms to hospital admission was different among patients (from 1 to 19 days, the median is 4 days). Another potential confounding factor is the treatment prescribed before blood collection (summary shown in the supplementary material of our previous paper[13]). A nested case-control within an ongoing cohort study that stores blood sample at baseline (healthy state), and also collect samples at different stages (showing symptoms, diagnosed, admitted to hospital, discharge, and follow-up), together with data from electronic health record would control for these potential confounders, avoid sample bias and address more meaningful clinical and biological questions, like the association of metabolome and disease progression in patients that follows different disease progression trajectories, etc.
Acknowledgments
The authors thank all the study participants, as well as the dedicated medical and research staff who fought against the COVID-19 pandemic across the world.
Funding
This work was supported by grants from the Youth Talent Lifting Project (2020-JCJQ-QT-034) and the National Science and Technology Major Project of the Ministry of Science and Technology of China (2017ZX10202102-004-002).
Author Contributions
Fu-Sheng Wang, Guang-Hou Shui, and Ji-Yuan Zhang conceived, designed, and supervised experiments. Jin-Wen Song, Xing Fan, Wen-Jing Cao, and Chao Zhang collected clinical samples. Wen-Jing Cao, Si-Yu Wang, Zhe Xu, Jun-Liang Fu, Ruo-Nan Xu, and Lei Huang collected clinical information. Jin-Wen Song, Sin Man Lam, Xing Fan, Wen-Jing Cao, He Tian, and Shao-Hua Zhang performed the experiments. Jin-Wen Song and Bo-Wen Li performed the statistical analysis. Jin-Wen Song, Sin Man Lam, Bo-Wen Li, Tian-Jun Jiang, Ming Shi, Fu-Sheng Wang, Ji-Yuan Zhang, and Guang-Hou Shui interpreted data. Bo-Wen Li, Xing Fan, Jin-Wen Song, He Tian, and Si-Yu Wang wrote the manuscript. All authors edited and approved the final manuscript.
Conflicts of Interests
Bo-Wen Li and Sin Man Lam are employees of LipidALL Technologies.
Editor note: Chao Zhang, Ruo-Nan Xu, and Fu-Sheng Wang are the Editorial Board Members of Infectious Diseases & Immunity. The article was subject to the journal's standard procedures, with peer review handled independently of these members and their research groups.
References
- [1].Johns Hopkins Coronavirus Resource Center. Available from: https://coronavirus.jhu.edu. Accessed April 18, 2021. [Google Scholar]
- [2].Guan W, Ni Z, Hu Y, et al. Clinical characteristics of coronavirus disease 2019 in China. N Engl J Med 2020;382(18):1708–1720. doi:10.1056/nejmoa2002032. [DOI] [PMC free article] [PubMed] [Google Scholar]
- [3].Zhou F, Yu T, Du R, et al. Clinical course and risk factors for mortality of adult inpatients with COVID-19 in Wuhan, China: a retrospective cohort study. Lancet 2020;395(10229):1054–1062. doi:10.1016/S0140-6736(20)30566-3. [DOI] [PMC free article] [PubMed] [Google Scholar]
- [4].Ye Q, Wang B, Mao J. The pathogenesis and treatment of the ‘Cytokine Storm’ in COVID-19. J Infect 2020;80(6):607–613. doi:10.1016/j.jinf.2020.03.037. [DOI] [PMC free article] [PubMed] [Google Scholar]
- [5].Yang L, Liu S, Liu J, et al. COVID-19: immunopathogenesis and Immunotherapeutics. Signal Transduct Target Ther 2020;5(1):1–8. doi:10.1038/s41392-020-00243-2. [DOI] [PMC free article] [PubMed] [Google Scholar]
- [6].Mangalmurti N, Hunter CA. Cytokine storms: understanding COVID-19. Immunity 2020;53(1):19–25. doi:10.1016/j.immuni.2020.06.017. [DOI] [PMC free article] [PubMed] [Google Scholar]
- [7].Costa dos Santos Junior G, Pereira CM, Kelly da Silva Fidalgo T, et al. Saliva NMR-based metabolomics in the war against COVID-19. Anal Chem 2020;92(24):15688–15692. doi:10.1021/acs.analchem.0c04679. [DOI] [PubMed] [Google Scholar]
- [8].Chen Y, Zheng Y, Yu Y, et al. Blood molecular markers associated with COVID-19 immunopathology and multi-organ damage. EMBO J 2020;39(24):e105896. doi:10.15252/embj.2020105896. [DOI] [PMC free article] [PubMed] [Google Scholar]
- [9].Wu D, Shu T, Yang X, et al. Plasma metabolomic and lipidomic alterations associated with COVID-19. Natl Sci Rev 2020;7(7):1157–1168. doi:10.1093/nsr/nwaa086. [DOI] [PMC free article] [PubMed] [Google Scholar]
- [10].Blasco H, Bessy C, Plantier L, et al. The specific metabolome profiling of patients infected by SARS-COV-2 supports the key role of tryptophan-nicotinamide pathway and cytosine metabolism. Sci Rep 2020;10(1):1–12. doi:10.1038/s41598-020-73966-5. [DOI] [PMC free article] [PubMed] [Google Scholar]
- [11].Shen B, Yi X, Sun Y, et al. Proteomic and metabolomic characterization of COVID-19 patient sera. Cell 2020;182(1):59–72. e15. doi: 10.1016/j.cell.2020.05.032. [DOI] [PMC free article] [PubMed] [Google Scholar]
- [12].Brunius C, Shi L, Landberg R. Large-scale untargeted LC–MS metabolomics data correction using between-batch feature alignment and cluster-based within-batch signal intensity drift correction. Metabolomics 2016;12(11):1–13. doi:10.1007/s11306-016-1124-4. [DOI] [PMC free article] [PubMed] [Google Scholar]
- [13].Thomas T, Stefanoni D, Reisz JA, et al. COVID-19 infection alters kynurenine and fatty acid metabolism, correlating with IL-6 levels and renal status. JCI Insight 2020;5(14):1–16. doi:10.1172/JCI.INSIGHT.140327. [DOI] [PMC free article] [PubMed] [Google Scholar]
- [14].Lu J, ManLam S, Wan Q, et al. High-coverage targeted lipidomics reveals novel serum lipid predictors and lipid pathway dysregulation antecedent to type 2 diabetes onset in normoglycemic Chinese adults. Diabetes Care 2019;42(11):2117–2126. doi:10.2337/dc19-0100. [DOI] [PubMed] [Google Scholar]
- [15].Tian H, Zhou Z, Shui G, et al. Extensive profiling of polyphenols from two trollius species using a combination of untargeted and targeted approaches. Metabolites 2020;10(3):119. doi:10.3390/metabo10030119. [DOI] [PMC free article] [PubMed] [Google Scholar]
- [16].Yuan M, Breitkopf SB, Yang X, et al. A positive/negative ion-switching, targeted mass spectrometry-based metabolomics platform for bodily fluids, cells, and fresh and fixed tissue. Nat Protoc 2012;7(5):872–881. doi:10.1038/nprot.2012.024. [DOI] [PMC free article] [PubMed] [Google Scholar]
- [17].Song JW, Lam SM, Fan X, et al. Omics-driven systems Interrogation of metabolic dysregulation in COVID-19 pathogenesis. Cell Metab 2020;32(2):188–202. e5. doi:10.1016/j.cmet.2020.06.016. [DOI] [PMC free article] [PubMed] [Google Scholar]
- [18].Lê S, Josse J, Husson F. FactoMineR: an R package for multivariate analysis. J Stat Softw 2008;25(1):253–258. doi:10.18637/jss.v025.i01. [Google Scholar]
- [19].Thévenot EA, Roux A, Xu Y, et al. Analysis of the human adult urinary metabolome variations with age, body mass index, and gender by implementing a comprehensive workflow for univariate and OPLS statistical analyses. J Proteome Res 2015;14(8):3322–3335. doi:10.1021/acs.jproteome.5b00354. [DOI] [PubMed] [Google Scholar]
- [20].Xia J, Wishart DS. MSEA: a web-based tool to identify biologically meaningful patterns in quantitative metabolomic data. Nucleic Acids Res 2010;38suppl. 2:71–77. doi:10.1093/nar/gkq329. [DOI] [PMC free article] [PubMed] [Google Scholar]
- [21].Jewison T, Su Y, Disfany FM, et al. SMPDB 2.0: Big improvements to the small molecule pathway database. Nucleic Acids Res 2014;42(D1):478–484. doi:10.1093/nar/gkt1067. [DOI] [PMC free article] [PubMed] [Google Scholar]
- [22].Chong J, Soufan O, Li C, et al. MetaboAnalyst 4.0: towards more transparent and integrative metabolomics analysis. Nucleic Acids Res 2018;46(W1):W486–W494. doi:10.1093/nar/gky310. [DOI] [PMC free article] [PubMed] [Google Scholar]
- [23].Ritchie ME, Phipson B, Wu D, et al. Limma powers differential expression analyses for RNA-sequencing and microarray studies. Nucleic Acids Res 2015;43(7):e47. doi:10.1093/nar/gkv007. [DOI] [PMC free article] [PubMed] [Google Scholar]
- [24].Xia J, Wishart DS, Valencia A. MetPA: a web-based metabolomics tool for pathway analysis and visualization. Bioinformatics 2011;27(13):2342–2344. doi:10.1093/bioinformatics/btq418. [DOI] [PubMed] [Google Scholar]
- [25].Csardi G, Nepusz T. The igraph software package for complex network research. InterJournal 2006;(8):1695. [Google Scholar]
- [26].Duren W, Weymouth T, Hull T, et al. MetDisease-connecting metabolites to diseases via literature. Bioinformatics 2014;30(15):2239–2241. doi:10.1093/bioinformatics/btu179. [DOI] [PMC free article] [PubMed] [Google Scholar]
- [27].Langfelder P, Horvath S. WGCNA: an R package for weighted correlation network analysis. BMC Bioinformatics 2008;9(1):559. doi:10.1186/1471-2105-9-559. [DOI] [PMC free article] [PubMed] [Google Scholar]
- [28].Breiman L. Random forests. Mach Learn 2001;45:5–32. [Google Scholar]
- [29].Robin X, Turck N, Hainard A, et al. pROC: an open-source package for R and S+ to analyze and compare ROC curves. BMC Bioinformatics 2011;12:77. doi:10.1186/1471-2105-12-77. [DOI] [PMC free article] [PubMed] [Google Scholar]
- [30].Overmyer KA, Shishkova E, Miller IJ, et al. Large-scale multi-omic analysis of COVID-19 severity. Cell Syst 2021;12(1):23–40. e7. doi:10.1016/j.cels.2020.10.003. [DOI] [PMC free article] [PubMed] [Google Scholar]
- [31].Su Y, Chen D, Yuan D, et al. Multi-omics resolves a sharp disease-state shift between mild and moderate COVID-19. Cell 2020;183(6):1479–1495. e20. doi:10.1016/j.cell.2020.10.037. [DOI] [PMC free article] [PubMed] [Google Scholar]
- [32].Marfia G, Navone S, Guarnaccia L, et al. Decreased serum level of sphingosine-1-phosphate: a novel predictor of clinical severity in COVID-19. EMBO Mol Med 2021;13(1):e13424. doi:10.15252/emmm.202013424. [DOI] [PMC free article] [PubMed] [Google Scholar]
- [33].Tibboel J, Reiss I, De Jongste JC, et al. Sphingolipids in lung growth and repair. Chest 2014;145(1):120–128. doi:10.1378/chest.13-0967. [DOI] [PubMed] [Google Scholar]
- [34].Obinata H, Hla T. Sphingosine 1-phosphate and inflammation. Int Immunol 2019;31(9):617–625. doi:10.1093/intimm/dxz037. [DOI] [PMC free article] [PubMed] [Google Scholar]
- [35].Li S, Ma F, Yokota T, et al. Metabolic reprogramming and epigenetic changes of vital organs in SARS-CoV-2 induced systemic toxicity. JCI Insight 2021;6(2):e145027. doi:10.1172/jci.insight.145027. [DOI] [PMC free article] [PubMed] [Google Scholar]
- [36].Doğan HO, Şenol O, Bolat S, et al. Understanding the pathophysiological changes via untargeted metabolomics in COVID-19 patients. J Med Virol 2021;93(4):2340–2349. doi:10.1002/jmv.26716. [DOI] [PubMed] [Google Scholar]
- [37].Badawy AAB. Kynurenine pathway of tryptophan metabolism: regulatory and functional aspects. Int J Tryptophan Res 2017;10. 1178646917691938. doi:10.1177/1178646917691938. [DOI] [PMC free article] [PubMed] [Google Scholar]
- [38].Rabbani MAG, Barik S. 5-Hydroxytryptophan, a major product of tryptophan degradation, is essential for optimal replication of human parainfluenza virus. Virology 2017;503:46–51. doi:10.1016/j.virol.2017.01.007. [DOI] [PMC free article] [PubMed] [Google Scholar]
- [39].Tan T, Khoo B, Mills EG, et al. Association between high serum total cortisol concentrations and mortality from COVID-19. Lancet Diabetes Endocrinol 2020;8(8):659–660. doi:10.1016/S2213-8587(20)30216-3. [DOI] [PMC free article] [PubMed] [Google Scholar]
- [40].Choy KW. Cortisol concentrations and mortality from COVID-19. Lancet Diabetes Endocrinol 2020;8(10):808. doi:10.1016/S2213-8587(20)30305-3. [DOI] [PMC free article] [PubMed] [Google Scholar]


