

Abstract
Human genetic adaptation to high altitudes (>2500 m) has been extensively studied over the last few years, but few functional adaptive genetic variants have been identified, largely owing to the lack of deep-genome sequencing data available to previous studies. Here, we build a list of putative adaptive variants, including 63 missense, 7 loss-of-function, 1,298 evolutionarily conserved variants and 509 expression quantitative traits loci. Notably, the top signal of selection is located in TMEM247, a transmembrane protein-coding gene. The Tibetan version of TMEM247 harbors one high-frequency (76.3%) missense variant, rs116983452 (c.248C > T; p.Ala83Val), with the T allele derived from archaic ancestry and carried by >94% of Tibetans but absent or in low frequencies (<3%) in non-Tibetan populations. The rs116983452-T is strongly and positively correlated with altitude and significantly associated with reduced hemoglobin concentration (p = 5.78 × 10⁻⁵), red blood cell count (p = 5.72 × 10⁻⁷) and hematocrit (p = 2.57 × 10⁻⁶). In particular, TMEM247-rs116983452 shows greater effect size and better predicts the phenotypic outcome than any EPAS1 variants in association with adaptive traits in Tibetans. Modeling the interaction between TMEM247-rs116983452 and EPAS1 variants indicates weak but statistically significant epistatic effects. Our results support that multiple variants may jointly deliver the fitness of the Tibetans on the plateau, where a complex model is needed to elucidate the adaptive evolution mechanism.
Keywords: Tibetan, adaptive genetic variant, high-altitude adaptation, next-generation sequencing (NGS), archaic ancestry, expression quantitative traits loci (eQTL), tissue-specific expression, hemoglobin concentration, hypoxia
INTRODUCTION
It is generally believed that long-term human inhabitation of the Tibetan highlands, where the oxygen pressure is much lower than at sea level (∼60%), is linked to a genetic adaptation to hypoxic environments [1]. Many genetic studies have been conducted to search for candidate loci associated with high-altitude adaptation (HAA) in Tibetans. The convergence of these studies strongly supports the crucial roles of two genes, EPAS1 and
EGLN1, as members of the hypoxia-inducible transcription factor (HIF) pathway in the HAA of Tibetans [2–11]. A major undertaking of subsequent studies is to determine the functional genetic variants of the HAA candidate genes identified from previous genome-wide scans. One successful example is a high-frequency missense mutation in EGLN1 contributing functionally to the Tibetans’ high-altitude phenotype in vitro [9–11]. However, most other attempts with the similar purpose of identifying functional variants in other genes, including EPAS1, have not been successful. Previous studies rely largely on the examination of some tagging single-nucleotide polymorphisms (SNPs) in individual candidate genes or SNP-array-based genome-wide scans. These strategies suffer from SNP ascertainment bias and thus possibly have less power to locate the functional variants [12,13], while only the whole-genome sequencing (WGS) offers near complete coverage of the genome, including non-coding regions [14]. More importantly, HAA involves a wide range of phenotypic variation. Like other complex traits, it is expected to be driven by enormously large numbers of variants spreading across the genome [15]. However, the lack of high-coverage WGS data in any single studies previously prevented the identification of functional variants associated with adaptive traits [9–11].
To obtain a comprehensive knowledge of the genome variation of Tibetan highlanders, and to gain further insights into the genetic bases of human adaptation to high altitudes, we complied a multi-omics dataset encompassing deep-sequenced genomes (30–60×) of 38 Tibetan highlanders (TIB) and 39 Han Chinese lowlanders (HAN) [16], RNA-Seq transcriptomes of 57 term placentas of Tibetans [17] and 62 quantitative traits in 2,849 Tibetan highlanders [18]. A systematic analysis of these data enabled us to search for known and novel candidate adaptive genetic variants (hereafter referred to as AGVs) on a whole-genome scale, while minimizing bias. These efforts are expected to facilitate further molecular-functional studies and provide a better understanding of the evolutionary mechanisms of human adaptation to life on the Himalayan plateau.
RESULTS
Candidate AGVs in Tibetan highlanders
We analysed 11.57 million biallelic single-nucleotide variants (SNVs) discovered in the deep-sequenced genomes, including 1.75 million (15.1%) novel SNVs not reported in dbSNP build 151 (Supplementary Table 1). Most of the SNVs (∼95%) act as modifiers in regulatory regions with mild impact, e.g. transcription factor binding variants, and are difficult to capture without whole-genome deep sequencing (Supplementary Table 2). The remaining 5% include 56,473 high-impact variants (3000 loss-of-function (LoF) variants and 53,473 missense variants) and 54,572 low-impact variants. By analysing the genetic variation within and between populations (see Methods), we identified 374 genomic regions with fine-mapped signals of positive selection. Of these regions, 254 contain at least one protein-coding gene and 66 regions do not overlap with any known genes (Supplementary Table 3).
As the aim of this study is to identify candidate AGVs specific to Tibetan highlanders, we screened the above genomic regions and retained those showing considerable divergence between Tibetan and non-Tibetan populations (see Methods). To this end, we built a list of 1,877 candidate AGVs with at least one of the three categories of biological effects (see Methods, Fig. 1A and B, and Supplementary Table 4): changing protein sequence (CPS), including 1 stop-lost variant, 2 stop-gained variants, 4 splice-donor variants and 63 missense variants (Table 1 and Supplementary Table 5); regulating gene expression (RGE), including 509 expression quantitative traits loci (eQTLs); unknown function but conserved in evolution (UCE), including 1,297 variants with a combined annotation dependent depletion (CADD) [19] score >15 or a genomic evolutionary rate profiling (GERP) [20] score >2. These candidate AGVs fell into 521 genes (hereafter referred to as candidate adaptive genes; Supplementary Table 6) in 319 fine-mapped candidate regions. Only 21 candidate adaptive genes have been formally reported in previous HAA studies on either human or non-human species inhabiting the highlands in Tibet, Ethiopia or South America (Supplementary Table 6), suggesting that the vast majority of the genes and regions we identified are novel candidates of HAA.
Figure 1.

The landscape of the candidate AGVs in TIB and the candidate adaptive genes involved in the hypoxia-induced pathways. (A) Manhattan plot of the CMS scores across the autosomes. The candidate AGVs are labeled according to their biological effect. CPS, changing protein sequence; RGE, regulating gene expression; UCE, unknown function but conserved in evolution. (B) Proportions of different types of candidate AGVs. A majority of the candidate AGVs are located in the non-coding regions, making our analyses more comprehensive than those of previous studies. (C) The functional enrichment of AGV-related genes. The full priori gene list for each pathway or category appears in Supplementary Table 7. ‘Prior literature’ indicates genes reported by previous studies on high-altitude adaptation in human and non-human species. Here, we only show the 10 categories with odds ratios >1 (the y-axis). The horizontal line in black indicates odds ratio at 1. The adjusted p values for the enrichment of each category are shown above the bars. The red bars indicate significant enrichments (adjusted p < 0.05). (D) HIF pathways and related reactions under normoxia and hypoxia. Candidate adaptive genes (in the blue boxes) are mapped to the pathways they could possibly be involved in. Genes highlighted in red are suggested to carry genomic segments introgressed from archaic hominids (see Methods).
Table 1.
Candidate AGVs with missense or loss-of-function mutationsa.
| SNP | Gene | Nucleotide | Amino acid | F ST | f TIB | f HAN | SNP | Gene | Nucleotide | Amino acid | F ST | f TIB | f HAN | ||
|---|---|---|---|---|---|---|---|---|---|---|---|---|---|---|---|
| rs116983452 | TMEM247 | c.248C > T | p.Ala83Val | 0.72 | 0.76 | 0.03 | rs6740879 | CCDC138 | c.344G > A | p.Arg115Lys | 0.16 | 0.22 | 0.03 | ||
| rs186996510 | EGLN1 | c.12C > G | p.Asp4Glu | 0.45 | 0.53 | 0.04 | rs10008489 | FRAS1 | c.118 T > C | p.Ter40ArgextTer23 | 0.15 | 0.87 | 0.60 | ||
| rs6679056 | OR10R2 | c.647A > G | p.Glu216Gly | 0.24 | 0.84 | 0.49 | rs6126344 | SALL4 | c.1520 T > G | p.Leu507Arg | 0.15 | 0.62 | 0.32 | ||
| rs1804020 | ZNF638 | c.1996G > A | p.Val666Met | 0.23 | 0.87 | 0.53 | rs1800517 | COL4A4 | c.3011C > T | p.Pro1004Leu | 0.15 | 0.63 | 0.33 | ||
| rs2838697 | SUMO3 | c.205G > T | p.Val69Phe | 0.22 | 0.78 | 0.42 | rs11062385 | KDM5A | c.2594 T > C | p.Met865Thr | 0.15 | 0.82 | 0.54 | ||
| rs863363 | OR10X1 | c.179 T > C | p.Ile60Thr | 0.21 | 0.84 | 0.51 | rs2289247 | GNL3 | c.1063G > A | p.Val355Met | 0.15 | 0.72 | 0.44 | ||
| rs2228313 | SREBF2 | c.2580G > C | p.Arg860Ser | 0.21 | 0.37 | 0.08 | rs6617 | SPCS1 | c.121C > G | p.Pro41Ala | 0.15 | 0.72 | 0.44 | ||
| rs2075939 | NCF4 | c.815 T > C | p.Leu272Pro | 0.20 | 0.93 | 0.65 | rs1029871 | NEK4 | c.673C > G | p.Pro225Ala | 0.15 | 0.72 | 0.44 | ||
| rs4946188 | ZUFSP | c.1135A > G | p.Asn379Asp | 0.20 | 0.55 | 0.22 | rs1459853 | GUCY1B3 | c.363 + 1G > A | NA | 0.14 | 0.62 | 0.33 | ||
| rs3827760 | EDAR | c.1205 T > C | p.Val402Ala | 0.20 | 0.32 | 0.05 | rs1136410 | PARP1 | c.2285 T > C | p.Val762Ala | 0.14 | 0.82 | 0.55 | ||
| rs17029277 | RP11-766F14.2 | c.95G > A | p.Arg32Gln | 0.20 | 0.91 | 0.62 | rs3744093 | RNF43 | c.139A > G | p.Ile47Val | 0.14 | 0.76 | 0.49 | ||
| rs4689254 | ZBTB49 | c.1042G > A | p.Ala348Thr | 0.20 | 0.88 | 0.58 | rs292592 | WDR91 | c.770C > T | p.Pro257Leu | 0.13 | 0.74 | 0.46 | ||
| rs2271111 | DOCK5 | c.3068A > G | p.Gln1023Arg | 0.19 | 0.88 | 0.59 | rs2305925 | CATSPERD | c.2227A > T | p.Thr743Ser | 0.13 | 0.79 | 0.53 | ||
| rs7105857 | COLCA2 | c.-285 + 2C > T | NA | 0.18 | 0.80 | 0.49 | rs6890099 | ATOX1 | c.-229 + 2 T > C | NA | 0.13 | 0.63 | 0.36 | ||
| rs2272843 | MOV10L1 | c.3536C > A | p.Ala1179Glu | 0.18 | 0.42 | 0.13 | rs2296129 | FAM209B | c.386A > C | p.Glu129Ala | 0.12 | 0.80 | 0.55 | ||
| rs2272051 | DUSP11 | c.107A > G | p.Asp36Gly | 0.18 | 0.58 | 0.26 | rs4434138 | STAB1 | c.6844A > G | p.Ile2282Val | 0.12 | 0.72 | 0.46 | ||
| rs1877031 | STARD3 | c.350G > A | p.Arg117Gln | 0.18 | 0.68 | 0.36 | rs3745640 | PRR22 | c.353C > T | p.Pro118Leu | 0.12 | 0.79 | 0.54 | ||
| rs2295283 | MIIP | c.499A > G | p.Lys167Glu | 0.18 | 0.78 | 0.46 | rs1048013 | CYP20A1 | c.1060C > T | p.Leu354Phe | 0.12 | 0.87 | 0.64 | ||
| rs2037814 | ALMS1 | c.2012 T > G | p.Val671Gly | 0.18 | 0.51 | 0.21 | rs2302190 | MTMR4 | c.838A > G | p.Ser280Gly | 0.12 | 0.89 | 0.68 | ||
| rs6762208 | SENP2 | c.872C > A | p.Thr291Lys | 0.18 | 0.51 | 0.21 | rs8073754 | SEPT4 | c.5G > A | p.Arg2Lys | 0.12 | 0.89 | 0.68 | ||
| rs8182086 | ZNF592 | c.2777G > A | p.Ser926Asn | 0.18 | 0.76 | 0.45 | rs12623638 | AC009965.2 | n.136 + 1G > A | NA | 0.11 | 0.82 | 0.58 | ||
| rs16853773 | PIK3C2B | c.100C > T | p.Arg34Cys | 0.18 | 0.82 | 0.51 | rs4665385 | AC074091.13 | c.196G > A | p.Gly66Arg | 0.11 | 0.80 | 0.56 | ||
| rs3803650 | SLC7A6OS | c.134G > A | p.Gly45Asp | 0.17 | 0.53 | 0.22 | rs1063478 | HLA-DMA | c.211G > A | p.Val71Ile | 0.11 | 0.91 | 0.71 | ||
| rs12648093 | NUDT6 | c.340 T > C | p.Cys114Arg | 0.17 | 0.21 | 0.01 | rs3824915 | ALX4 | c.104G > C | p.Arg35Thr | 0.10 | 0.74 | 0.50 | ||
| rs10747561 | LMBR1L | c.178G > A | p.Val60Ile | 0.17 | 0.49 | 0.19 | rs17773492 | LINC01118 | c.91A > G | p.Asn31Asp | 0.09 | 0.93 | 0.77 | ||
| rs7726005 | MGAT1 | c.668G > A | p.Arg223Gln | 0.16 | 0.93 | 0.69 | rs3865452 | ADCK4 | c.280A > G | p.Thr94Ala | 0.08 | 0.68 | 0.46 | ||
| rs5758511 | CENPM | c.7C > T | p.Arg3Ter | 0.16 | 0.76 | 0.46 |
aThe missense or loss-of-function (LoF, highlighted with underlined fonts) candidate AGVs showing the highest differentiation (FST) between TIB and HAN. fTIB and fHAN denote the adaptive allele frequency in TIB and HAN, respectively. Genes coding for non-coding RNAs (e.g. miRNA and LincRNA) are underlined, as the missense or LoF effects in these genes are hard to confirm. Variants were annotated based on the Ensembl database version 90 using Variant Effect Predictor (VEP). NA, not applicable. A full list of 70 missense or LoF candidate AGVs is given in Supplementary Table 5.
Potential functional and phenotypic effects of the candidate AGVs
Based on database and literature analyses, here we briefly summarize the potential functional and phenotypic effects of the candidate AGVs. There were three missense candidate AGVs (rs192690066, rs116983452 and rs12612916) identified in TMEM247, which encodes for transmembrane proteins and is located close to the well-studied EPAS1. In particular, rs116983452 had a larger composite multiple signal (CMS) score (19.85) over the other two missense loci, and it showed a greater genetic differentiation between TIB and HAN (FST = 0.72) than that of any other SNPs in EPAS1 and TMEM247. The missense candidate AGV in EGLN1, rs186996510, is the only functional causal mutation identified in the Tibetan people in previous studies [6,7,9,10,15]. The candidate AGV rs5758511 is a stop-gain polymorphism in CENPM. The derived allele at this locus was reported to be associated with reduced birth weight in the Europeans [21] and it presents a higher frequency in TIB (0.76) than in HAN (0.46) in our data. We did not identify any candidate CPS-AGV in EPAS1, but found a downstream intergenic variant rs1900592 showing the largest CMS score (23.76) among the candidates. According to the Genotype-Tissue Expression (GTEx) database [22], rs1900592 is an eQTL that regulates the expression of EPAS1 in blood. The region Chr11: 18344845–18479845 showed the second strongest CMS signal across the genome (Fig. 1A) and encompasses four candidate RGE-AGVs and two candidate UCE-AGVs. LDHAL6A, LDHA and LDHC belonging to the lactate dehydrogenase gene family are in this region and they are involved in anaerobic glycolysis. Other interesting candidate adaptive genes include HLA-DMA involved in immunity [23], FRAS1 associated with renal agenesis [24], SREBF2 related to female reproduction [25] and DISC1 associated with response to the ultraviolet (UV) exposure [5,26].
Enrichment of candidate AGVs in hypoxia-related pathways
As most of the candidate adaptive genes identified in our study are novel candidates of HAA and therefore could have not been well investigated, we used two intersecting approaches to infer the possible functional effects of them. First, we referred to genes involved in several hypoxia-related pathways because of their known functions. Second, we tested the associations between the candidate AGVs and phenotypes, as well as gene-expression levels in the Tibetans.
We collected genes involved in several hypoxia-related pathways defined by PathCards [27] and merged them with those that have been reported in previous HAA studies. The resulting set of 2,201 functional candidate genes is listed in Supplementary Table 7. We performed enrichment analysis (see Methods) and found that the 521 candidate adaptive genes were enriched in SUMOylation (odds ratio = 4.3, adjusted p = 0.01, Fisher’s exact test) and in the HIF pathway (odds ratio = 3.1, adjusted p = 0.03, Fisher’s exact test) (Fig. 1C). In addition, some genes appeared in the intersection of the candidate adaptive gene list and previous HAA studies (‘priori literatures’ in Supplementary Table 7), which was not likely to have occurred by chance (odds ratio = 4.0, adjusted p = 1.5 × 10⁻⁶, Fisher’s exact test).
To provide a more intuitive understanding of the roles that the candidate adaptive genes might play in HAA, we constructed a putative adaptive map of the hypoxia-related pathways for the Tibetan population, including the HIF pathway and its related pathways as listed in Supplementary Table 7 (see Methods, Fig. 1D). EPAS1, encoding HIF2α, is the central gene in the HIF pathway. We identified several candidate adaptive genes involved in the post-translational modifications of the HIFα proteins and they may strongly affect the stability and activity of HIFα. For instance, EGLN1 encoding an oxygen-dependent hydroxylase-domain enzyme called prolyl hydroxylase 2 (PHD2) may induce the degradation of HIFα under normoxia [28–31]. The SUMOylation of HIFα in the nucleus also relies on SENP1, SENP2, SUMO3 and CUL3 [32–35]. Increasing the oxygen delivery and reducing the oxygen consumption are the two primary responses to hypoxia. The former relies on the improvement of blood and vascular conditions (e.g. erythropoiesis and angiogenesis) and seven candidate adaptive genes (OR10X1, TRPC6, PRKCE, PIGF, NRXN1, BCL2 and TCF7L2) are related to this process; the latter mainly refers to the metabolism of glucose and lipids, in which ACO2, SLC37A4, LDHA, GDPD1, ZNF638 and SREBF2 may play crucial roles. We found that most of the genes presented in the pathway had significant interactions with EP300 (histone acetyltransferase p300, p = 2.65 × 10⁻⁴; Supplementary Fig. 1). EP300 is a co-activator of HIF1α [6,36,37] and it stimulates the hypoxia-induced genes, such as the vascular endothelial growth factor (VEGF) [37–39]. This gene has been reported to show signals of selection in the genome-wide comparisons between Tibetans and Han Chinese [6] and might contribute to HAA through regulating nitric oxide (NO) production in Tibetans according to a genetic-association test [40]. Taken together, these results emphasize the importance of post-translational modifications of EPAS1 and indicate that the regulation of HIF-induced downstream pathways underlies the response to hypoxic conditions in Tibetans.
Association of candidate AGVs with phenotypes in Tibetans
We next performed association studies of the candidate AGVs with 62 quantitative traits collected from 2,849 Tibetan samples (Supplementary Table 8) [18]. We applied a linear additive model and found that 73 candidate AGVs distributed in 17 genes were associated with at least one of these traits after correcting for multiple tests (Supplementary Table 9). Importantly, 61 of these candidate AGVs were located in seven continuous protein-coding genes on chromosome 2: EPAS1, TMEM247, ATP6V1E2, RHOQ, PIGF, CRIPT and SOCS5. The adaptive alleles at these loci showed strong associations with the reduced levels of red blood cell count (RBC, adjusted p = 3.10 × 10⁻⁷ – 0.045), hemoglobin (HGB, adjusted p = 2.90 × 10⁻⁵ – 0.045) and hematocrit (HCT, adjusted p = 1.21 × 10⁻⁶ – 0.046), which were proved to be adaptive traits of the Tibetan highlanders [2,5,41,42]. Moreover, except RHOQ and PIGF, the other five genes showed significant associations with uric acid (UA) level (top adjusted p = 1.89 × 10⁻⁵ – 0.024 for each gene)—a useful biomarker of vascular dysfunction (e.g. pulmonary hypertension) [43]. Our results also suggest that MFN2 was significantly associated with folate (adjusted p = 0.035). The folate-increasing effect of the MFN2 variant indicates the possibility of genetic compensation for the UV-induced folate degradation to support pregnancy and increase fertility at highlands [18]. It is also interesting that the PPP1R1B locus was associated with phosphorus. Phosphorus plays an important role in multiple biological processes, including oxidative phosphorylation, which is crucial for energy metabolism. PPP1R1B is associated with RBC and HGB in the populations with European ancestry [44], but these associations were not observed in the Tibetans studied here. It is notable that most of these associations (except that between rs1495099 in PPP1R1B and phosphorus) were confirmed when using an alternative approach—a mixed linear model-based leave one chromosome out association (MLMA-LOCO) analysis (see Methods; Supplementary Table 10). Additionally, several candidate AGVs were identified to be associated with the reduced height and the increased creatinine level in Tibetans using this approach. We found a weak association between EGLN1 and HGB in the Tibetan males (p = 0.038 at rs186996510, but not significant after correcting for multiple test), consistently with previous findings [4,9,18].
Association of candidate AGVs with gene expression in term placentas
Previous data showed that Tibetan women with high oxygen saturation have more surviving children than those with low oxygen saturation [45]. Gene expression in term placenta—a key organ for maternal–fetal oxygen exchange—may largely reflect the status and fitness of the fetus, but the data have never been reported by the GTEx Project [22]. Therefore, we performed a quantitative transcriptomics analysis to quantify the gene expression in 57 Tibetan term placentas. We tested the associations between the expression profiles of 592 candidate AGVs in the coding regions and 310 candidate adaptive genes, and identified 54 candidate AGVs that have cis-regulatory effects on 19 genes in term placenta (Supplementary Table 11 and Supplementary Fig. 2).
The eQTLs for each gene tended to be in extremely strong linkage (r2 > 0.5 for pairwise SNPs located <100 kb from each other in the 57 Tibetan genotypes for the eQTL study; r2 > 0.9 in the 2,849 Tibetan genotypes for the trait study and in the 38 Tibetan genomes), but with three exceptions including EPAS1, TMEM247 and CSF2RB (Supplementary Fig. 3). The aforementioned missense variant rs116983452 was significantly associated with the expression of EPAS1 (adjusted p = 0.003) and TMEM247 (adjusted p = 0.038). According to our data, the expression level is high for EPAS1 (in top 1% of the whole genome) but low for TMEM247 in Tibetans’ placentas, and both of them were down-regulated by the adaptive allele (T, derived allele) at rs116983452. Consistently, Peng et al. [17] also reported the down-regulation of EPAS1 transcription in placentas in the Tibetans. However, we could not determine the causality of this variant to the gene expression, as it is in strong linkage with several intronic eQTLs located in TMEM247 (rs1868079, r2 = 0.92; rs116871724, r2 = 0.92; rs79542054, r2 = 0.88), which is also the case for some other missense candidates showing substantial correlation with the gene expression (Supplementary Fig. 3). The missense variant rs3745640, which is also the top CMS signal in PRR22, was identified as an eQTL of DUS3L. It is in strong linkage with the synonymous rs10811 in DUS3L (r2 = 0.78). The most significant eQTL of SEPT3, rs2228313, is a missense candidate AGV in SREBF2. It is involved in the HIF pathway (Fig. 1D) and is in complete linkage with rs17848337 (r2 = 1) in SEPT3. Interestingly, the four eQTLs of GNL3 are all missense variants in an linkage disequilibrium (LD) block (pairwise r2 = 0.88–1), in which rs11177 and rs2289247 are the top two CMS signals in GNL3, while rs6617 and rs1029871 are candidate AGVs identified in SPCS1 and NEK4, respectively. Different roles that a variant could play in different genes also increased the difficulty to unravel the genetic basis of HAA. For instance, rs3865452 acts as a missense candidate AGV in ADCK4, but was identified to be the only eQTL of RAB4B, which is 60 kb downstream from ADCK4. RAB4B encodes a protein that is involved in vesicular trafficking [46] and is an important paralogue of EGLN2; EGLN2 is a HIF that plays an essential role in the response to hypoxia.
Colocalization of eQTLs and phenotype-associated signals
Some eQTLs are colocalized with phenotype-associated signals in three regions of the Tibetan genomes (Fig. 2). For instance, most of the eQTLs in EPAS1 and TMEM247 are exactly matched with the association signals of UA, RGB, RBC and HCT; the eQTLs of PGAP3 are only 3 kb downstream from a phosphorous-associated locus in PPP1R1B;
Figure 2.

Colocalization of eQTLs and phenotype-associated candidate AGVs. (A) Genome-wide distribution and linkage disequilibrium (LD) of the candidate AGVs. The candidate AGVs, eQTLs and phenotype-associated loci are indicated by inverted triangles in black, green and orange, respectively. The LD blocks were inferred using Haploview version 4.2 [104] and are presented using the standard color scheme. The three regions of colocalization are marked using ellipses and are labeled as ‘Coloc_Region 1’, ‘Coloc_Region 2’ and ‘Coloc_Region 3’, respectively. (B) Zoom-in plots of candidate AGVs in the three colocalization regions. In each plot, gene locations are shown above the chromosome. The cis-regulated genes are indicated by green bars, while others are indicated by gray bars. The eQTLs and phenotype-associated loci are indicated by inverted triangles in green and orange, respectively. In Coloc_Region 1, the color of each inverted triangle for the eQTL matches that of the bar for the gene regulated by this eQTL. The LD of pairwise SNPs was measured by r2 using Haploview version 4.2 [104].
the DUS3L eQTLs were significantly associated with the gamma-glutamyl transpeptidase (GGT) level (Fig. 2 and Supplementary Table 9). In the latter two regions, the eQTLs and phenotype-associated loci are almost in complete LD. We further asked whether it is a coincidence or a causal relationship that leads to such colocalization. Using a stepwise regression approach implemented in the R package coloc version 3.1 [47], we tested the jointly estimated coefficients of the significantly associated candidate AGVs for each trait as mentioned above and those for gene expression (see Methods). The results presented in Supplementary Table 12 suggest that the expression of EPAS1 and TMEM247 is likely to be responsible for the variation of UA, RGB, RBC and HCT (adjusted p > 0.05 for all tested loci) and so is the DUS3L expression for GGT (adjusted p > 0.05 for all tested loci). We are not able to test the colocalization of signals in the PGAP3 region, as only one phenotype-associated locus was identified but coloc considers two loci for each trait.
Tissue-specific expression patterns of candidate HAA-related genes
Based on our literature searches and data analysis, we selected 157 genes with potential functional relations with HAA from the candidate adaptive gene list and they were thus defined as candidate HAA-related genes (see Methods; Supplementary Table 6). We examined the expression profiles of the candidate HAA-related genes in GTEx and observed that 51 of them exhibited tissue-specific expression patterns in 11 tissue types (see Methods; Fig. 3). Here, the tissue-specific expression is determined following the GTEx Project [48] or defined as an observable higher expression level of a gene in a tissue or organ than in any others—in detail the median expression level of this gene in this tissue should be at least twice that in any other tissues and the lower quartile in this tissue should also be higher than the upper quartile of that in all the other tissues.
Figure 3.

A human-anatomy plot showing tissue- and organ-specific expression of the candidate HAA-related genes. The expression profiles for these genes were obtained from the Genotype-Tissue Expression (GTEx) database. All reported tissues and organs are shown, except for the cell lines. Genes reported to be HAA-related in Tibetans or showing significant associations with phenotypes in our analysis of 2,849 Tibetans are highlighted in red, while the others are in blue. A full list of the expression patterns of all candidate HAA-related genes is given in Supplementary Table 6. The human-anatomy image was constructed at pngtree.com.
The brain, which controls neural activity, is the most oxygen-dependent organ in the body. The acute hypoxia experienced at extremely high altitudes may give rise to severe neuropsychological outcomes, like loss of consciousness and transient ischemia [49]. PPP1R1B was the most strongly up-regulated gene in the brain. As discussed above, we identified a candidate AGV related to phosphorous in PPP1R1B. ANO3 is expressed in several regions of the human brain, particularly the putamen [50]. The angiogenic pathway in the putamen might be activated by hypoxia, based on an experimental study in rats [51]. Testes are male reproductive organs. Interestingly, sperm quality and quantity and testosterone levels are equivalent in men inhabiting high and low altitudes [49]; this equivalence might be the result of HAA. Two genes with outstanding signatures of natural selection, TMEM247 and ATP6V1E2, were specifically expressed in the testes, although at low levels. The biological function of TMEM247 is unclear; the protein encoded by ATP6V1E2 is a subunit of a sperm-specific V-ATPase that is expressed in acidic secretory acrosomes essential for fertilization [52]. Another signal is CATSPERD. Proteins coded by this gene were detected in spermatocytes and spermatids at different stages of spermatogenesis in mice [53]. In addition, EPAS1 and EGLN1 are specifically expressed in the lungs and the muscles, respectively. NOV, a blood-pressure-associated gene [54], is specifically expressed in the arteries. The arteries are crucial for the maintenance of sufficient blood flow and thus influence blood oxygen. Spleen is the primary erythropoietic organ producing RBCs [55] and one candidate HAA-related gene STAB1 is specifically expressed in the spleen. This gene was reported to be significantly associated with HCT level [44,56] and was down-regulated in response to hypoxia. Therefore, our results suggest that HAA is a complex biological process involving multiple organs and tissues.
Prioritization of the candidate adaptive genes
We further prioritized the candidate adaptive genes according to FIS (the functional importance score), which is a combined statistic of population differentiation and molecular functionality (see Methods; Supplementary Table 6). Strikingly, we found TMEM247, which has been poorly studied previously, appeared on the top of the list attributing to the key missense variant rs116983452 (c.248C > T; p.Ala83Val). The adaptive derived allele (T allele) at this locus is enriched in TIB (76.3%), while it is absent in African, European and American populations, and is in low frequencies in other East Asian populations (<3%) according to the 1000 Genomes dataset (see Fig. 4A for the contour density plots of rs116983452-T frequency). It is, to date, the most-differentiated functional variant identified between Tibetan and non-Tibetan populations. In fact, the genomic region that includes this variant is extremely divergent between TIB and HAN (maximum FST = 0.804) (Supplementary Fig. 4), in sharp contrast to the genome-wide average (FST = 0.015). The Tibetan-enriched allele was derived from archaic ancestry (Fig. 4B). It is strongly and positively correlated with altitude (r = 0.838, p value = 0.018) (Fig. 4C and Supplementary Fig. 5) and had a pronounced signature of nature selection (Fig. 4D). The selection coefficient estimated for rs116983452-T (s = 0.0035–0.0058) is higher than that estimated for the well-known missense variant (rs186996510) of EGLN1 (s = 0.0024–0.004), although both are greater than that of most genome-wide candidate AGVs (median s = 0.001–0.0016) (Supplementary Table 4 and Supplementary Table 14), assuming that all these candidate AGVs share one selection event, which occurred after the split of the highlanders (TIB) and the lowlanders (HAN).
Figure 4.

Signature of local adaptation at rs116983452 and its functional associations. (A) Global distribution of rs116983452-T. Each triangle represents a sampling locality for a population. The map is adapted from http://bzdt.ch.mnr.gov.cn (GS(2016)1665, approved by the Ministry of National Resources of the People’s Republic of China). (B) Median-joining network for TMEM247. The gray area highlights a group of Tibetan-enriched haplotypes with Denisovan origin, all of which carry rs116983452-T. (C) Correlation between the altitude and the derived allele frequency at rs116983452. Each dot represents an Asian population, from both public datasets and our unpublished data. Populations analysed in this plot include various Tibetan populations (labeled), as well as Uyghur, Tajik, Kazak, Hui, Han Chinese, Japanese and Malaysian peoples (unlabeled). (D) Estimation of extended haplotype diversity (EHH) in TIB and HAN around rs116983452. (E) Significant associations between rs116983452 and various quantitative traits. Associations validated in a larger Tibetan population are indicated with fonts in red. (F) The expression of TMEM247 in three groups of Tibetan samples with different genotypes.
The candidate gene-association analysis showed that rs116983452-T was significantly associated with UA (adjusted p = 0.031), HGB (adjusted p = 5.78 × 10⁻⁵), RBC (adjusted p = 5.72 × 10⁻⁷) and HCT (adjusted p = 2.57 × 10⁻⁶), and it had substantial influence on TMEM247 expression (Fig. 4E and F). Using 1,160 replication samples collected from four different altitudes, we validated the strong association between rs116983452-T and both altitude and the aforementioned hypoxia-related traits, e.g. HGB (adjusted p = 4.87 × 10⁻³) and HCT (adjusted p = 4.87 × 10⁻³) (Fig. 4E and Supplementary Table 15).
Differentiation of selection and association between TMEM247 and EPAS1
The adjacent physical locations (∼40 kb in distance) of TMEM247 and EPAS1 on the same chromosome raised the concern of a hitch-hiking effect, i.e. the observed signals at these genes might be correlated due to the LD. However, when examining the LD patterns of TMEM247 and EPAS1, we found that they are located in two different LD blocks, separated by a strong recombination hotspot (Supplementary Fig. 6A). The correlations among the key candidate AGVs (e.g. rs1900592 in EPAS1, rs192690066, rs116983452 and rs12612916 in TMEM247) and other reported candidates (e.g. the 5-SNP-motif with Denisovan ancestry, the Tibetan-enriched deletion and several other important SNPs [8,11–13]) in each gene is smaller than those between TMEM247 and EPAS1 (Supplementary Fig. 6B). These results might suggest a much more complex mechanism of HAA in this region: the coexistence of candidate AGVs regulating gene expression and those altering protein sequences. We then statistically evaluated the individual and joint contributions of the multiple variants in the two genes, i.e. EPAS1 and TMEM247, to the variation of adaptive phenotypes (RBC, HGB and HCT) in Tibetans using three models: (i) a simple linear-regression model considering either an EPAS1 variant or a TMEM247 variant, (ii) a binary linear-regression model considering both an EPAS1 variant and a TMEM247 variant and (iii) a binary linear-regression model considering an additional interaction term (see Methods). Taking rs4953354 reported in Beall et al. [2] as a representative candidate in EPAS1, we found TMEM247-rs116983452 explained a higher proportion of heritability of the phenotypes in Tibetans than the EPAS1 variant (effect size in the Model 1: −0.12 vs. –0.09 for RBC; −4.01 vs. –3.13 for HGB; −1.22 vs. –0.93 for HCT) (Fig. 5 and Supplementary Table 13). The TMEM247-rs116983452 variant masked the effects of EPAS1-rs4953354 (p of the two loci in Model 2: 1.27 × 10⁻⁶ vs. 0.71 for RBC; 1.68 × 10⁻⁴ vs. 0.37 for HGB; 1.77 × 10⁻⁵ vs. 0.39 for HCT) and improved the fit of the model (genetic contributions of Model 1 (EPAS1-rs4953354) and Model 2: 0.100 vs. 0.108, p = 1.27 × 10⁻⁶ for RBC; 0.143 vs. 0.148, p = 1.68 × 10⁻⁴ for HGB; 0.136 vs. 0.142, p = 1.77 × 10⁻⁵ for HCT). Similar results were observed in the comparison between TMEM247-rs116983452 and most of the other adaptive variants in EPAS1 (Supplementary Table 13). The epistatic interaction of TMEM247 and EPAS1 seems to be weak but statistically significant, in line with the loose correlation of the two genes indicated by the aforementioned LD pattern. Further investigation of these mechanisms will depend on the designation of many gene-expression and functional assays that separate the individual or joint contributions of each candidate AGV, which, though, is expected to be labor-intensive and time-consuming.
Figure 5.

Effects of EPAS1-rs4953354 and TMEM247-rs116983452 on the adaptive traits in Tibetans. The intronic SNP rs4953354 reported in Beall et al. in 2010 [2] was selected as a representative adaptive EPAS1 variant in comparison with the rs116983452 in TMEM247. The locations on chromosome 2 of the two genes are presented by the pink bars against the coordinates above and the positions of the two SNPs are indicated by arrows. For each SNP, the frequency of the adaptive allele and that of three genotypes are shown by blue bars. The genetic effects of rs4953354 and rs116983452 on red blood cell count (RBC), hemoglobin (HGB) and hematocrit (HCT) were tested using three linear-regression models, as illustrated in Methods. The effect size of each variant and the genetic contribution of each model are shown in the green bars below. Significant p values (p < 0.05) are denoted with asterisks. In Model 3, the effect size of the interaction of the two variants is not significant (p > 0.05) and thus is not shown in the figure. Detailed results can be found in Supplementary Table 13.
Distinct ancestral architectures between EGLN1 and TMEM247
EGLN1 and TMEM247 are the only two genes that harbor high-frequency missense functional candidate AGVs in the Tibetan highlanders. We therefore postulate that these two genes are functionally important and associated with the altitudinal adaptation of the Tibetan highlanders. It is noteworthy that archaic ancestry is completely absent from the entire EGLN1 gene region in both TIB and HAN (see Methods; Supplementary Fig. 7A). We estimated that the time to the most recent common ancestor (TMRCA) of the haplotypes carrying the key EGLN1 locus (rs186996510) [9,10] was 29,800 years (see Methods), which predates the Last Glacial Maximum (LGM)—a period of intense cold from ∼ 26,500 to 19,000 years before present (YBP) [57]. In contrast, elevated archaic ancestries in the Tibetans were observed in TMEM247 (Supplementary Fig. 7B). The unusually high frequency of archaic sequences and substantial differences between TIB and HAN—as well as the other populations—could not be explained by recent gene flow or random processes. This indicated that TMEM247 has been subjected to strong natural selection and likely contributes to the altitudinal adaptation of Tibetan highlanders. The surviving archaic sequences in TMEM247 in Tibetan highlanders could be dated back to ∼ 60,000 YBP, again pre-dating the LGM [16]. Assuming that the selection of rs116983452-T in TMEM247 occurred right after the archaic introgression, we estimated that the selection coefficient at this locus was 0.013–0.033 (Supplementary Table 14). The distinct and complicated ancestral architectures of EGLN1 and TMEM247 have many implications for Tibetan origins and their history in adapting to the plateau. Our results indicate that both archaic and modern human ancestries contribute to the HAA of the Tibetan highlanders and that human adaptation to high altitudes in Tibet is much more ancient than previously believed, as the key candidate AGVs facilitating the altitudinal adaptation of the Tibetan highlanders were likely derived from pre-LGM populations.
DISCUSSION
As human migrations to the Tibetan plateau are likely a series of ‘stochastic adventures’ rather than well-planned expeditions, a wide range of phenotypic variations driven by enormously large numbers of variants and genes spreading across the genome are expected to have been instrumental in human adaptation to the plateau [15]. The convergence of previous studies supports the roles of two genes that are part of the HIF pathway, EPAS1 and EGLN1, in the HAA of Tibetans [2–8]. However, our study provides a more comprehensive and prioritized list of candidate AGVs, of which only a few have been reported. It would facilitate further molecular-functional studies of HAAs and improve our understanding of human adaptation to the Himalayan plateau.
We analysed the same data—the whole-genome SNPs of 2,849 Tibetan samples—as Yang et al. [18] did, but used different strategies and criteria for the purpose of this study. Of the nine adaptive genes reported by Yang et al. [18], three (EPAS1, EGLN1 and NEK7) were identified as candidates in our study. We realized that the candidate loci in the other six genes showed minor genetic differentiations between Tibetan and Han Chinese (Table 1 in Yang et al. [18]) and thus were not considered as candidates according to our criteria for selecting candidate AGVs. It should also be noted that TMEM247, rather than EPAS1, presented as the top signal in our study, inconsistently with previous findings [58–60]. Despite EPAS1 variants also showing significant signals of positive selection (e.g. top FST = 0.8), when the biological effects (e.g. variant type and conservation) were taken into account, the top signals in EPAS1 (including rs372272284 reported by Jeong et al. [59]) were filtered out due to the mild biological impact and the signals in TMEM247 (e.g. rs116983452) survived. We believe it is essential to consider both statistical signals and biological effects of variants in the identification of candidate AGVs, as they are more likely to be the adaptive genetic variants.
Functional investigations will hopefully resolve which candidate AGVs are causal for adaptation and how these candidate AGVs have contributed to the altitudinal adaptations of the Tibetan highlanders. However, the challenges are obvious. For example, determining the causality and consequence of altitudinal adaptation is difficult, with many candidate AGVs discovered from whole-genome data. In the present case of TMEM247, which is located in a region encompassing seven genes and many genetic variants, it is difficult and complex to determine which are the ‘drivers’ and which are ‘passengers’. For instance, the causality or independency of EPAS1 and TMEM247 to the phenotypes in Tibetans could not be exclusively determined by the cross-conditional association analyses, although they are in different LD blocks (Supplementary Table 16). Therefore, we give higher weights to variants that are highly differentiated between populations with elevated archaic ancestry and strong association with the adaptive traits, such as the Tibetan-enriched missense rs116983452-T located in TMEM247.
Withstanding the challenging environmental conditions of the Tibetan highlands must have been a very long evolutionary process, possibly even longer than the history of most of modern Eurasian populations. This has been well illustrated by dating ages of candidate AGVs in the two outstanding genes (EGLN1 and TMEM247) with distinct ancestry make-up. In the Tibetan genome, the entire EGLN1 gene derived its ancestry exclusively from modern human groups (Supplementary Fig. 7A), while the TMEM247 variants derived their ancestry mostly from archaic groups (Supplementary Fig. 7B). Therefore, it is evident that both anatomically modern humans (AMH) and non-AMH ancestries contributed to the HAA of the Tibetan highlanders. However, the key candidate AGVs as identified in the two outstanding genes (EGLN1 and TMEM247) with distinct ancestries, either AMH- or non-AMH-originated, traced their origins back to ∼30,000 years ago and thus could be derived dominantly from pre-LGM populations, indicating ancient adaptation of humans to the Himalayan plateau.
Our data and analysis also suggest latecomers to the plateau might have typically inherited candidate AGVs from predecessors via genetic admixture, rather than via the creation of one or more candidate AGVs de novo. Supporting this hypothesis, most of the candidate AGVs identified in this study were standing variants, while hard sweeps are rare. Although founder effects could mimic positive selection on standing variants, we do not think that would be the case in our study, as it would influence the whole genome, rather than a single locus. Indeed, selection on standing variants may be common in human adaptation to local environments, as ‘archaic adaptive introgression’ has been suggested by many recent studies [11,61–66]. Knowing ancestral origins of the candidate AGVs is imperative, being aware of genetic continuity of early highland-foragers and present-day Tibetans [16] and understanding ‘borrowed fitness’ as a driving force of adaptive evolution is helpful for further investigations of the genetic mechanism of human adaptation to local environments.
Our results suggest that human HAA, associated with a wide range of complex traits, is driven by enormously large numbers of variants spreading across the genome, of which only a few have been identified. Moreover, even considering a single certain adaptive trait, we argue that more than one variant may jointly deliver the fitness even in a closely linked genomic region, suggesting the epistatic effect or genetic interaction has to be considered carefully. However, detecting interactions among variables is a well-known challenge in statistics and data mining [67]. For example, a complete model that includes all variants and all interaction terms may require too many degrees of freedom and is thus not feasible. For this reason, interactions are only tested for TMEM247-rs116983452 and those EPAS1 variants that have a statistically significant independent main effect. Those DNA sequence variations that have an interaction effect, but no or minimal main effect, could have been missed. Modeling multi-variant adaptation is not the currency of human genetics and evolution, but may open a window to understanding human adaptation to high altitude.
METHODS
Samples and WGS
Peripheral blood samples were collected from 33 Tibetan and 5 Sherpa individuals living in six prefectures (Lhasa, Chamdo, Nagqu, Nyingchi, Shannan and Shigatse) in the Tibet Autonomous Region, and blood samples of 39 Han Chinese individuals were collected from diverse regions in China. Each individual was third (or more)-generation offspring of non-consanguineous marriages of members of the same nationality. All samples were collected with informed consent and approved by the Biomedical Research Ethics Committee of Shanghai Institutes for Biological Sciences (Shanghai, China). Prior to sequencing and analysis, all samples were stripped of personal identifiers (if any existed). All procedures were in accordance with the ethical standards of the Responsible Committee on Human Experimentation and the Helsinki Declaration of 1975, as revised in 2000. Briefly, WGS with a target high coverage (30–60×) was performed on Illumina HiSeq X Ten following Illumina-provided protocols with standard library preparation in WuXi NextCODE at Shanghai. Details regarding sample collection and genome sequencing have previously been described [16]. The raw data can be downloaded from National Omics Data Encyclopedia (NODE, http://www.biosino.org/node; accession number: ND00000013EP) or BIG Data Center (http://bigd.big.ac.cn/; accession number: PRJCA000246). Variant calling was carried out with the HaplotypeCaller module in the Genome Analysis Toolkit (GATK) [68,69] on a combined sample set, including 77 samples from this study and 182 additional unpublished deep-sequenced samples from diverse Asian populations. Then, data filtration was carried out in each single population using VCFtools (https://vcftools.github.io/index.html) [70] by removing SNVs that significantly deviated from the Hardy-Weinberg equilibrium (p < 10−6) or with a missing rate of more than 20%. Finally, 11.43 million SNVs were retained for further analyses.
Genotype imputation and haplotype phasing
Haplotypes of 22 autosomes of 77 Tibetan and Han Chinese genomes were inferred using SHAPEIT version 2.r837 (https://mathgen.stats.ox.ac.uk/genetics_software/shapeit/shapeit.html) [71], together with the other 182 Asian samples mentioned above. No reference population was used in haplotype phasing, as it would substantially reduce the marker density, especially for the isolated highlander population. Then we applied a sample-independent mask to remove regions with low mappability or low complexity where variant calling can be challenging, following the Simons Genome Diversity Project [72].
The SNP-array data of 2,849 Tibetans were obtained from https://www.wmubiobank.org [18] and were imputed with a pipeline suggested by IMPUTE2 (http://mathgen.stats.ox.ac.uk/impute/impute_v2.html) [73]. First, the genotypes of 526,123 SNPs were phased with SHAPEIT version 2.r837 [71]. Then, for each 5 Mb non-overlapping genome segment, genotypes were imputed by IMPUTE2 [73], using 1,025 deep-sequenced whole genomes of diverse Asian populations (unpublished) as a reference panel. Consequently, 29,411,284 SNPs were obtained for this dataset.
Transcriptomic variants of 57 Tibetan placenta tissue samples were downloaded from the BIG Data Center (http://bigd.big.ac.cn/; accession numbers: PRJCA000268 and PRJCA000269) [17]. Genotypes were called using the GATK pipeline [74]. Because calling SNPs from RNA-Seq data tends to underestimate the proportion of heterozygotes, we counted the reads for reference and alternative alleles to adjust the possible underestimation [75]. Using this method, we obtained the genotype information of 1,528,173 SNPs in the coding regions.
Genomic annotation of SNVs
The ancestral allele of each SNV was determined based on the ancestral sequences released by the 1000 Genomes Project. Genetic variant types were provided by Variant Effect Predictor (VEP, http://www.ensembl.org/info/docs/tools/vep/index.html) [76], which assigns each genetic variant to at least one of the 34 types based on the sequence ontology. Variants with high or moderate functional impact, including missense variants, transcript ablation, splice-acceptor variants, splice-donor variants, stop-gained variants, frameshift variants, stop-lost variants, start-lost variants, transcript amplification, in-frame insertion and in-frame deletion, are assorted to the biological effect of CPS. We further scanned the remaining variants for those with biological effects of RGE, consisting of the eQTLs provided by the GTEx database (http://www.gtexportal.org/home/) [77]. We searched for eQTLs in a total number of 202,789 eQTLs obtained from 44 tissues in the GTEx. For each tissue, if a gene contains eQTLs, we selected the eQTL(s) showing the most significant p value(s) as a representative. For SNPs belonging to neither CPS nor RGE, if it shows high conservation score, e.g. GERP > 2 (http://cadd.gs.washington.edu) [20] or CADD > 15 (http://mendel.stanford.edu/SidowLab/downloads/gerp/) [19], it is assorted to the biological effect of UCE. SNPs were mapped to genes according to the Ensembl database version 90 (GRCh37, https://asia.ensembl.org/index.html) [78].
Collection of hypoxia-related pathways (genes) and functional-enrichment analysis
We focused on the adaptive patterns of some genes of particular interest, including genes involved in hypoxia-related pathways defined by PathCards (https://pathcards.genecards.org/); genes reported to be related to hypoxia in previous experimental studies; and genes identified previously as local adaptation in highlanders. A full list of priori candidate genes can be found in Supplementary Table 7. We integrated these genes into a map of hypoxia-induced pathways (Fig. 1D) and then reviewed the pathways and related genes. We calculated the odds ratio to evaluate the enrichment of the candidate adaptive genes in each pathway. Each pathway was tested independently as follows:
 |
where A1 denotes the number of candidate adaptive genes involved in the hypoxia-related pathway; A2 denotes the number of candidate adaptive genes not involved in the hypoxia-related pathway; N1 denotes the number of non-candidate adaptive genes involved in the hypoxia-related pathway; and N2 denotes the number of non-candidate adaptive genes not involved in the hypoxia-related pathway. The sum of A1, A2, N1 and N2 is the total number of genes across the genome. An odds ratio significantly above 1 (p < 0.05, the Fisher’s exact test) indicated that the candidate adaptive genes are enriched in the hypoxia-related pathway (Fig. 1C and Supplementary Table 7).
Detection of natural selection and identification of candidate AGVs
We detected signatures of natural selection primarily based on four population genetic statistics for analysing genetic variation within and between populations: FST, calculated for each SNP following Weir and Cockerham [79] using an in-house computer script; the difference in the allele frequency (ΔAF) between TIB and HAN; the integrated haplotype score (iHS) [80] in TIB, estimated with Selscan version 1.2.0 (https://github.com/szpiech/selscan) [81]; and the cross-population extended haplotype homozygosity (XP-EHH) [82], also estimated in Selscan [81] using HAN as the reference population for TIB. We further conducted CMS analysis [83] using estimates of the above four statistics as inputs. These analyses were restricted to the 4.63 million SNPs with minor allele frequencies >0.05 and known ancestral alleles. The CMS score for each selected SNP was calculated as follows:
 |
where pi is the empirical p value of the ith test. We divided the whole genome into overlapping regions, each spanning 30 kb, with a step of 15 kb. We considered one region as an adaptive candidate if more than 30% of the variants encompassed had significant CMS scores (in the top 1% across the whole genome). Using this approach, 374 candidate regions were identified in total (Supplementary Table 3).
Candidate AGVs were further selected from the 374 candidate regions, using three criteria. First, selected SNPs had significant CMS scores (in the top 1% across the whole genome). Second, selected SNPs were likely to be highly differentiated between TIB and HAN (>5 × average FST across the genome). To avoid signals attributed to HAN, we ensured that the allele frequency (AF) in TIB was different from that of HAN, and different from the average AF in East Asian populations annotated by VEP. Third, we required the selected SNPs to have possible biological effects, e.g. CPS, RGE and UCE. For each candidate AGV, the allele with a higher frequency in TIB over HAN was regarded as the adaptive allele.
Calculating the FIS for each gene
Based on the conservation score (CS) provided by the various annotation methods (i.e. CADD [19], GERP [20], SIFT [84] and PolyPhen [85]), we measured the accumulated effects of each candidate AGV in the TIB population relative to the HAN population as
 |
where FISi is the functional importance score calculated by the ith method; and ΔAF is the difference in AF between TIB and HAN. We then defined an integrated score for the jth candidate AGV based on the rank of FIS in each of the n methods as:
 |
For each gene carrying at least one candidate AGV, we selected the candidate AGV showing the highest Rank (which indicated the greatest degree of functional importance) as the key candidate AGV for that gene. The Rank of the key candidate AGV represents the functional importance of the gene.
In this analysis, we used the conservation scores provided by CADD and GERP. Negative GERP scores, indicating evolutionary neutrality, were converted to 0. We weighted the conservation score according to the biological effects of the candidate AGVs, giving candidate AGVs with CPS or RGE effects the maximum CS. Gene rankings are shown in Supplementary Table 6.
Estimating the associations of candidate AGVs with phenotypes in Tibetans
We conducted the association analysis to detect phenotype-associated candidate AGVs in the 2,849 Tibetan subjects inhabiting the Tibetan plateau in Sichuan, China [18]. Two approaches were applied, based on a linear model and a mixed linear model, respectively. We first applied a principal component analysis to the 2,849 Tibetan samples, using 26,520 independent SNPs that were over 100 kb distant from each other. Then, we performed the linear-regression analysis under the additive model implemented in PLINK version 1.07 (http://zzz.bwh.harvard.edu/plink/) [86] and, alternatively, MLMA-LOCO analysis implemented in GCTA version 1.26.0 [87], taking sex and the first five principal components (PCs) as covariates. Of the 1,877 candidate AGVs, 1,865 were included in the association tests, as the genotypes for the other 12 loci were not successfully imputed. Each of the 62 phenotypes (Supplementary Table 8) was tested independently. To control the genome-wide type I error rate, we used Benjamini-Hochberg (BH) FDR correction, which is implemented in R version 3.2.1 [88], to account for multiple testing. We strictly tested 115,630 (= 1,865 × 62) independent hypotheses and used p < 0.05 as a significant level.
Two approaches were applied to test whether EPAS1 and TMEM247 have independent effects on the adaptive phenotypes of Tibetans. For each trait (e.g. RBC, HGB and HCT), we tested three possible linear-regression models on any pair of variants (denoted as 1 and 2):
 |
 |
 |
where Y is the phenotype vector, X is the genotype vector for each variant, α is the baseline phenotype level, β1 and β2 are effect sizes for two respective variants, β3 is the joint effect size of the two variants and ɛ represents stochastic uncertainties. Model 1 tests for the independent effect of each variant in either EPAS1 or TMEM247 on the phenotypes; Model 2 estimates the influence of two variants—one in EPAS1 and the other in TMEM247—on the phenotypes; Model 3 includes an additional interaction variant of the two variants based on Model 2. Next, we applied analysis of variance (ANOVA) to compare the fits of two models (e.g. Model 1 vs. Model 2 and Model 2 vs. Model 3) to evaluate the necessity of each variant to the phenotypic variation and to examine possible interactions between variants. We analysed pairwise combinations of variants—one in EPAS1 and the other in TMEM247—that are associated with RBC, HGB or HCT, respectively. Several EPAS1 variants reported to be adaptive candidates, e.g. rs4953354, rs372272284 and rs149594770, are also included in our analysis [2,17,59]. Sex and the first five PCs were used as covariates. The alternative approach is the cross-conditional association analysis, in which each phenotype-associated locus in EPAS1 and TMEM247 (Supplementary Table 9) were tested as a covariate for the other loci. We performed the linear-regression analysis for each variant–phenotype pair independently, under the additive model implemented in PLINK version 1.07 (http://zzz.bwh.harvard.edu/plink/) [86]. Again, sex and the first five PCs were used as additional covariates.
Detecting the expression quantitative trait loci (eQTLs)
Using the RNA-Seq data from 57 Tibetan placenta tissue samples [17], we explored the impact of the candidate AGVs on gene expression. First, we mapped the preprocessed reads to the reference genome using STAR (http://code.google.com/p/rna-star/) [89] and the resulting bam files were used as inputs to the RSEM program (http://github.com/deweylab/RSEM) to estimate the gene-expression levels [7]. Linear regressions between gene-expression levels and the imputed allele dosage of 592 coding candidate AGVs were performed using ‘MatrixEQTL’ in R package. Batch was included in the model as a covariate. Using p < 0.05 (BH-FDR correction for 183,520 (= 592 × 310) tests) as a cutoff, we considered a candidate AGV as an eQTL variant if it was associated with the expression level of a gene no more than 100 kb distant from the candidate AGV. Such genes, in this case, were determined to be cis-associated with the candidate AGV (Supplementary Table 11).
Colocalization test for the eQTLs and the phenotype-associated loci
We scanned each 100 kb window across the genome for the colocalization of eQTLs and phenotype-associated loci in Tibetans and found three genomic regions encompassing both signals. The zoom-in plots of the three regions are shown in Fig. 2B. Each region was tested independently using the imputed full genotype data of 57 Tibetans and those of 2,849 Tibetans. For each gene–phenotype pair, we selected a set of four SNPs (two eQTLs and two phenotype-associated loci) and went through all the combinations. For the region on chromosome 2, we treated EPAS1 and TMEM247 separately considering that they are in different LD blocks (Supplementary Fig. 6A). The EPAS1 analysis was restricted to the signals located in EPAS1 (the intergenic variant rs1900592 was also included), while the TMEM247 analysis included all the signals in TMEM247 and five other downstream genes in the same LD block. We performed the statistical test using an R package coloc version 3.1 [47] and conducted BH-FDR correction for multiple tests (1,000 tests (= 360 SNP sets for UA + 280 SNP sets for RBC + 150 SNP sets for RGB + 210 SNP sets for HCT) for EPAS1; 30,840 tests (= 780 SNP sets for UA + 12,750 SNP sets for RBC + 7,410 SNP sets for RGB + 9,900 SNP sets for HCT) for TMEM247; 15 tests for DUS3L). We did not test the colocalization of signals in the PGAP3 region on chromosome 17, as only one phenotype-associated locus was identified in this region but coloc analyses consider two loci for each trait. Adjusted p < 0.05 was used to reject the null hypothesis of a shared causal variant for the gene expression and phenotype variation.
Selecting for HAA-related candidate genes
HAA-related candidate genes were further selected from the 521 candidate adaptive genes using these criteria: (i) selected genes should be associated with HAA-related traits (70 in total, listed in Supplementary Table 17) or involved in hypoxia-related pathways in previous studies or in public databases (Supplementary Table 7) or (ii) selected genes should be significantly associated with any of the 62 quantitative traits measured in the 2,849 Tibetan samples (listed in Supplementary Table 8). The 157 candidate HAA-related genes are highlighted in Supplementary Table 6.
Estimating the correlation between adaptive AF of the candidate AGVs and altitude
To investigate possible relationship between the candidate AGVs and the altitude, we grouped the 33 sequenced Tibetan individuals according to the geographical regions and calculated the correlation between the frequency of the adaptive allele and altitude. The Tibetan samples were grouped into seven regional populations based on altitude: Lhasa (n = 3, at 3,650 m), Nyingchi (n = 2, at 3,000 m), Chamdo (n = 6, at 3,240 m), Shannan (n = 7, at 3,573 m), Shigatse (n = 8, at 3,853 m), Nagqu (n = 3, at 4,522 m) and Dingri (n = 4, at 4,300 m). The results are shown in Supplementary Table 4. When assessing the altitudinal correlation of the key locus in TMEM247 (rs116983452-T), we additionally included 5 Sherpa samples, 39 HAN samples and other Asian samples covering a wider geographical area (unpublished data). The altitude was determined by where the recruited sample currently resided. The correlation coefficient (r) was estimated using R version 3.2.1 [88].
Identification of archaic sequences in modern human genomes and local ancestry inference for TMEM247 and EGLN1
We identified genomic segments of non-modern-human origin using ArchaicSeeker version 2.1, an improved version of ArchaicSeeker [16], in this study. Compared with the old version, ArchaicSeeker version 2.1 adopted a hidden Markov model to determine the precise boundaries of the introgressed segments and used a likelihood-based segmental matching algorithm to assign the accurate ancestry to each segment. Using this method, we detected archaic segments in the TIB genomes, especially in TMEM247.
The archaic ancestry in TMEM247 was further confirmed by the S*-statistic analysis [90], which helps to identify genomic segments that could not have been derived from modern human genomes [90,91]. We calculated S* for each 50-kb region of the genome, stepping by 20 kb. The significance of S* for each segment can be calculated by simulating a null distribution of S* in the case of no archaic human introgression. This simulation was performed with ms (http://home.uchicago.edu/~rhudson1/source/mksamples.html) [92], using the demographic parameters well established in previous publications (Supplementary Fig. 8 and Supplementary Table 18) [93,94]. The full sequence data of Africans (YRI), Europeans (CEU) and East Asians (CHB) from the 1000 Genomes Project Phase III panel (http://www.1000genomes.org/data) were used in simulation. The recent explosions of the three continental populations were also taken into consideration following Vernot et al. [90].
To investigate the fine-scale genetic make-up of some interesting regions, specifically TMEM247 and EGLN1, we developed a method based on the results of ChromoPainter (https://people.maths.bris.ac.uk/∼madjl/finestructure-old/chromopainter_info.html) [95] to obtain the ancestry make-up of a particular genomic region in TIB. The major advantage of this method is that it does not require more than one individual in each of the reference panels, which is different from most existing methods for local ancestral inference [95–98]. We first applied ChromoPainter, using Han Chinese genomes and available archaic genomes, including an Altai Neanderthal genome (https://www.ebi.ac.uk/ena/data/view/PRJEB1265) [99], a Denisovan genome (https://www.ebi.ac.uk/ena/data/view/PRJEB2263) [100] and a 45,000-year-old Siberian genome (Ust’-Ishim, https://www.ebi.ac.uk/ena/data/view/PRJEB6622) [101] as reference data. The Ust’-Ishim genome was included based on the observation that Tibetans share a considerable proportion of their ancestry with Siberian populations. The African genomes (YRI) were also integrated into our reference population panel to avoid the false-positive inference of archaic ancestral segments.
SNPs with more than 50% missing genotypes and their 100-bp flanking regions (both upstream and downstream) were filtered out prior to the analysis. A recombination map with a mean recombination rate of 1 cM per Mbp was used to avoid any bias introduced by a prior recombination map based on some particular populations. For each run of the analysis, −ip and -b commanders were used to maximize over-copying proportions using an E-M algorithm and obtain the matrix of probability of each recipient copy of each donor at every site. To provide a comparable sample size for the five reference populations, we selected one individual from each of them and ran 4212 replications of ChromoPainter to make full use of the reference samples (1 Denisovan × 1 Neanderthal × 1 Ust’-Ishim × 39 Han × 108 YRI = 4,212). Then, we obtained 4,212 matrices of the copy probability of each haplotype of TIB individuals at each site and used them to determine the ancestry of each allele. We denoted the copy probability as Pijkl, where i is the number of ancestry combinations (i = 1, 2, …, 4,212), j is the inferred ancestry (j = jMod for modern human ancestry; j = jArch for archaic hominin ancestry), k denotes the haplotypes of the admixed populations and l denotes the physical position.
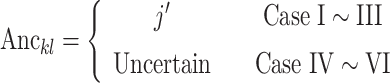 |
where Case I: 
Case II: 
Case III: 
Case IV: 
Case V: 
Case VI: None of Case I ∼ V
At a given site, we counted the runs of Pijkl larger than 0.8 for each reference population. For the sites with possible modern human ancestry, if the maximum count of runs was larger than 421 (10% of total runs) for a particular reference population, then the ancestry of the allele at that site was inferred as the reference population, while, for a potential archaic site, we required the counts of runs of  to be smaller than 42 (1% of total runs) and that of
  to be smaller than 421. In other cases, the site was treated as an uncertain ancestry.
Based on inferred local ancestry, we classified the genomic segments of TIB into six categories: Denisovian-like sequences, Neanderthal-like sequences, Ust’-Ishim-like sequences, Han-Chinese-like sequences, African-like sequences and sequences with uncertain ancestry (the ancestry could not be determined based on the reference sequence possibly due to an unknown archaic origin or the high similarity among different reference sequences).
Validation studies of rs116983452
To further validate rs116983452 in larger samples, we collected samples from 1,160 native Tibetans living at Lhasa (n = 285, at 3,680 m), Kangma (n = 148, at 4,700 m), Bange (n = 478, at 4,801 m) and Langkazi (n = 249, at 5,018 m). Molecular inversion probes [102] were used to genotype rs116983452 in the 1,160 Tibetans. We measured 24 physiological traits for these individuals: serum NO level, systolic pulmonary arterial pressure, degree of blood oxygen saturation, HGB, RBC, HCT, mean red cell volume, red cell distribution width, platelets, lymphocyte count, systolic pressure, diastolic blood pressure, heart rate, peak expiratory flow rate (PEF), maximum ventilatory volume (MVV), forced expiratory flow (FEF), forced expiratory volume in 1 second (FEV1), forced vital capacity (FVC), FEV1/FVC (FFR), height, weight, body mass index (BMI), chest circumference and hip circumference.
We evaluated the genetic association between rs116983452 and 24 physiological traits using PLINK 1.07 [86], under the additive model. We split four populations with the association analysis and then performed a meta-analysis by testing the homogeneity of different population datasets. Sex, age and altitude were treated as covariates where applicable. Especially, BMI was added into the list of covariates when analysing the lung functions, including PEF, MVV, FEF, FEV1, FVC and FFR. For multiple test correction, we used BH-FDR control to adjust the p value across the 24 traits.
Estimating the TMRCA
The TMRCAs of haplotypes carrying the adaptive allele at rs116983452 in TMEM247 and at rs186996510 in EGLN1 were independently calculated in the 38 Tibetan samples, based on the average pairwise nucleotide differences of the haplotypes ( ) as follows:
 |
where n is the number of sequences in a given region and πij is the nucleotide difference between the two sequences i and j (i ≠ j).
The TMRCA was then estimated as
 |
where μab is the local mutation rate of a genomic region with length lab started from position a to position b. The value of μab was estimated as
 |
where dHum–AncHumChimp denotes the nucleotide difference between human reference genome and the Human-Chimp-Ancestor of region ab. THum–HumChimp is the divergence time between humans and chimps and was here set to 13 million years.
TMEM247 and ATP6V1E2 were in an LD block (Supplementary Fig. 6). Therefore, we considered the entire block in this calculation, the boundary of which (Chr2:46657114–46772997) was identical to that of the TIB-specific haplotype reported in Lu et al. [16]. To eliminate the inter-ancestral recombination, we used 26 TIB-specific markers (Supplementary Table 19) as integral TIB-specific haplotypes. Interestingly, most of the haplotypes carrying rs116983452-T, 53 in total, also carry the derived alleles at these 26 loci. The TMRCA of these 53 haplotypes was estimated to be 56,200 ± 24,800 years. In EGLN1, there were 40 haplotypes carrying rs186996510-G and the TMRCA was estimated to be 29,800 ± 24,200 years.
We used startmrca [103] in R package to validate the TMRCAs of haplotypes carrying rs116983452-T. startmrca uses a hidden Markov model taking into account the length distribution of the shared ancestral haplotype, the accumulation of derived mutations and the surrounding background haplotype diversity. We ran this analysis five times, each including 15,000 iterations. We took the acceptable TMRCA estimations in the last 6,000 iterations of each run as the final results. A mutation rate of 1.25 × 10⁻⁸ per site per generation was used for this estimation. Consistently with our previous TMRCA analysis, startmrca estimated a TMRCA of 58,100 ± 2,800 years.
Estimation of selection coefficient
Here, we applied a simple deterministic model of selective sweep with additive genetic effects, using the following formula, which is the same as that used in a previous study [60]:
 |
We assumed that selection began right after the split of the Tibetan and the Han Chinese. We therefore used an estimated divergence time of 9,000–15,000 years (360–600 generations, assuming a generation time of 25 years) between TIB and HAN [16] as an approximation of the onset of selection (t) in TIB. We took the AF in HAN and TIB as approximates of the initial AF (p0) and the current AF (pt), respectively. For rs116983452, we also applied an alternative hypothesis, which assumed that selection occurred right after the introgression of the beneficial allele in TIB from the Denisovan. For this analysis, we used the TMRCA of haplotypes carrying the derived allele at rs116983452, which was estimated to be around 60,000 YBP (2,400 generations), as an approximate of t and estimated p0 to be 1/2Ne (Ne = ∼ 1,000–3,000 around 60,000 years ago; see Supplementary Table 14 for more details).
Supplementary Material
Acknowledgements
We are extremely grateful to all participants who contributed to this study.
FUNDING
This work was supported by the Strategic Priority Research Program (XDB13040100 to S.X.) and Key Research Program of Frontier Sciences (QYZDJ-SSW-SYS009 to S.X.) of the Chinese Academy of Sciences (CAS), the National Natural Science Foundation of China (NSFC) (91731303, 31525014, 31961130380 and 31771388 to S.X.; 31501011 to Y.L.; 31771389 to Y.Y. (Yuan Yuan); 81522014 to Z.J.; 31871256 and 31601046 to H.L.; 31460286, 31660307 and 31260252 to L.K.), the Program of Shanghai Academic Research Leader (16XD1404700 to S.X.), the UK Royal Society-Newton Advanced Fellowship (NAF\R1\191094 to S.X.), the National Key Research and Development Program (2016YFC0906403 to S.X.; 2017YFA0105300 to Z.J.; 2016YFF0202301 to Y.Y. (Yajun Yang)), Shanghai Municipal Science and Technology Major Project (2017SHZDZX01 to S.X.), Science and Technology Commission of Shanghai Municipality (STCSM, 19YF1455200 to L.D.; 16YF1413900 to H.L.), NSFC Research Fund for International Young Scientists (31850410477 to A.K.) and CAS President’s International Fellowship for Postdoctoral Researchers (2016 PB036 to A.K.). S.X. is Max-Planck Independent Research Group Leader and member of CAS Youth Innovation Promotion Association. This work was also supported by the National Program for Top-notch Young Innovative Talents of the ‘Wanren Jihua’ Project and the UK Royal Society-Newton Mobility Grants (IE160943 to S.X.). The funders had no role in the study design, data collection and analysis, decision to publish or preparation of the manuscript.
AUTHOR CONTRIBUTIONS
S.X. conceived of and designed the study and supervised the project. L.K., A.K., B.S. and Y.Y. (Yajun Yang) contributed to sample collection. Z.J., J.Y., F.L. and J.Q. contributed the SNP genotype and phenotype data of Tibetans. Y.L. managed laboratory work and contributed to data analysis. S.X. and Y.Y. (Yajun Yang) contributed reagents and materials. D.L., C.Z., X.W., K.Y. and Y.G. developed the pipeline for processing NGS data and performed variant-calling analysis. D.L. and C.Z. phased the genotype data and K.Y. imputed the data. L.D., C.Z., Y.L., H.C., Q.F., X.Z. and H.L. performed population genetic analysis. Y.Y. (Yuan Yuan) and L.T. analysed RNA-Seq data. J.L., Y.P. and X.G. annotated the adaptive genetic variant; Y.H. and B.S. conducted replication and validation studies. D.L. and K.Y. analysed archaic introgression. S.X., L.D. and C.Z. wrote the main paper and prepared for the additional files. All authors discussed the results and implications and commented on the manuscript.
Conflict of interest statement . None declared.
REFERENCES
- 1. Beall CM. Two routes to functional adaptation: Tibetan and Andean high-altitude natives. Proc Natl Acad Sci USA 2007; 104: 8655–60. [DOI] [PMC free article] [PubMed] [Google Scholar]
- 2. Beall CM, Cavalleri GL, Deng Let al. Natural selection on EPAS1 (HIF2alpha) associated with low hemoglobin concentration in Tibetan highlanders. Proc Natl Acad Sci USA 2010; 107: 11459–64. [DOI] [PMC free article] [PubMed] [Google Scholar]
- 3. Ng SB, Buckingham KJ, Lee Cet al. Exome sequencing identifies the cause of a mendelian disorder. Nat Genet 2010; 42: 30–5. [DOI] [PMC free article] [PubMed] [Google Scholar]
- 4. Simonson TS, Yang Y, Huff CDet al. Genetic evidence for high-altitude adaptation in Tibet. Science 2010; 329: 72–5. [DOI] [PubMed] [Google Scholar]
- 5. Yi X, Liang Y, Huerta-Sanchez Eet al. Sequencing of 50 human exomes reveals adaptation to high altitude. Science 2010; 329: 75–8. [DOI] [PMC free article] [PubMed] [Google Scholar]
- 6. Peng Y, Yang ZH, Zhang Het al. Genetic variations in Tibetan populations and high-altitude adaptation at the Himalayas. Mol Biol Evol 2011; 28: 1075–81. [DOI] [PubMed] [Google Scholar]
- 7. Xu S, Li S, Yang Yet al. A genome-wide search for signals of high-altitude adaptation in Tibetans. Mol Biol Evol 2011; 28: 1003–11. [DOI] [PubMed] [Google Scholar]
- 8. Lou H, Lu Y, Lu Det al. A 3.4-kb copy-number deletion near EPAS1 is significantly enriched in high-altitude Tibetans but absent from the Denisovan sequence. Am J Hum Genet 2015; 97: 54–66. [DOI] [PMC free article] [PubMed] [Google Scholar]
- 9. Xiang K, Ouzhuluobu and Peng Y et al. Identification of a Tibetan-specific mutation in the hypoxic gene EGLN1 and its contribution to high-altitude adaptation. Mol Biol Evol 2013; 30: 1889–98. [DOI] [PubMed] [Google Scholar]
- 10. Lorenzo FR, Huff C, Myllymaki Met al. A genetic mechanism for Tibetan high-altitude adaptation. Nat Genet 2014; 46: 951–6. [DOI] [PMC free article] [PubMed] [Google Scholar]
- 11. Huerta-Sanchez E, Jin X and Asan, et al. altitude adaptation in Tibetans caused by introgression of Denisovan-like DNA. Nature 2014; 512: 194–7. [DOI] [PMC free article] [PubMed] [Google Scholar]
- 12. Hanaoka M, Droma Y, Basnyat Bet al. Genetic variants in EPAS1 contribute to adaptation to high-altitude hypoxia in Sherpas. PLoS One 2012; 7: e50566. [DOI] [PMC free article] [PubMed] [Google Scholar]
- 13. Hackinger S, Kraaijenbrink T, Xue Yet al. Wide distribution and altitude correlation of an archaic high-altitude-adaptive EPAS1 haplotype in the Himalayas. Hum Genet 2016; 135: 393–402. [DOI] [PMC free article] [PubMed] [Google Scholar]
- 14. Meienberg J, Bruggmann R, Oexle Ket al. Clinical sequencing: Is WGS the better WES? Hum Genet 2016; 135: 359–62. [DOI] [PMC free article] [PubMed] [Google Scholar]
- 15. Boyle EA, Li YI, Pritchard JK. An expanded view of complex traits: From polygenic to omnigenic. Cell 2017; 169: 1177–86. [DOI] [PMC free article] [PubMed] [Google Scholar]
- 16. Lu D, Lou H, Yuan Ket al. Ancestral origins and genetic history of Tibetan highlanders. Am J Hum Genet 2016; 99: 580–94. [DOI] [PMC free article] [PubMed] [Google Scholar]
- 17. Peng Y, Cui CY, He YXet al. Down-regulation of EPAS1 transcription and genetic adaptation of Tibetans to high-altitude hypoxia. Mol Biol Evol 2017; 34: 818–30. [DOI] [PMC free article] [PubMed] [Google Scholar]
- 18. Yang J, Jin ZB, Chen Jet al. Genetic signatures of high-altitude adaptation in Tibetans. Proc Natl Acad Sci USA 2017; 114: 4189–94. [DOI] [PMC free article] [PubMed] [Google Scholar]
- 19. Kircher M, Witten DM, Jain Pet al. A general framework for estimating the relative pathogenicity of human genetic variants. Nat Genet 2014; 46: 310–5. [DOI] [PMC free article] [PubMed] [Google Scholar]
- 20. Cooper GM, Stone EA, Asimenos Get al. Distribution and intensity of constraint in mammalian genomic sequence. Genome Res 2005; 15: 901–13. [DOI] [PMC free article] [PubMed] [Google Scholar]
- 21. Horikoshi M, Yaghootkar H, Mook-Kanamori DOet al. New loci associated with birth weight identify genetic links between intrauterine growth and adult height and metabolism. Nat Genet 2013; 45: 76–82. [DOI] [PMC free article] [PubMed] [Google Scholar]
- 22. Consortium G. The genotype-tissue expression (GTEx) project. Nat Genet 2013; 45: 580–5. [DOI] [PMC free article] [PubMed] [Google Scholar]
- 23. Weber DA, Evavold BD, Jensen PE. Enhanced dissociation of HLA-DR-bound peptides in the presence of HLA-DM. Science 1996; 274: 618–20. [DOI] [PubMed] [Google Scholar]
- 24. Vrontou S, Petrou PMeyer BIet al. Fras1 deficiency results in cryptophthalmos, renal agenesis and blebbed phenotype in mice. Nat Genet 2003; 34: 209–14. [DOI] [PubMed] [Google Scholar]
- 25. Merath KM, Chang B, Dubielzig Ret al. A spontaneous mutation in Srebf2 leads to cataracts and persistent skin wounds in the lens opacity 13 (lop13) mouse. Mamm Genome 2011; 22: 661–73. [DOI] [PMC free article] [PubMed] [Google Scholar]
- 26. Foll M, Gaggiotti OE, Daub JTet al. Widespread signals of convergent adaptation to high altitude in Asia and America. Am J Hum Genet 2014; 95: 394–407. [DOI] [PMC free article] [PubMed] [Google Scholar]
- 27. Belinky F, Nativ N, Stelzer Get al. PathCards: Multi-source consolidation of human biological pathways. Database (Oxford) 2015; 2015. [DOI] [PMC free article] [PubMed] [Google Scholar]
- 28. Sarkar S, Banerjee PK, Selvamurthy W.. High altitude hypoxia: An intricate interplay of oxygen responsive macroevents and micromolecules. Mol Cell Biochem 2003; 253: 287–305. [DOI] [PubMed] [Google Scholar]
- 29. Smith TG, Robbins PA, Ratcliffe PJ. The human side of hypoxia-inducible factor. Br J Haematol 2008; 141: 325–34. [DOI] [PMC free article] [PubMed] [Google Scholar]
- 30. Epstein AC, Gleadle JM, McNeill LAet al. C. elegans EGL-9 and mammalian homologs define a family of dioxygenases that regulate HIF by prolyl hydroxylation. Cell 2001; 107: 43–54. [DOI] [PubMed] [Google Scholar]
- 31. Li F, Sonveaux P, Rabbani ZNet al. Regulation of HIF-1alpha stability through S-nitrosylation. Mol Cell 2007; 26: 63–74. [DOI] [PMC free article] [PubMed] [Google Scholar]
- 32. Agbor TA, Cheong A, Comerford KMet al. Small ubiquitin-related modifier (SUMO)-1 promotes glycolysis in hypoxia. J Biol Chem 2011; 286: 4718–26. [DOI] [PMC free article] [PubMed] [Google Scholar]
- 33. Cheng J, Kang X, Zhang Set al. SUMO-specific protease 1 is essential for stabilization of HIF1alpha during hypoxia. Cell 2007; 131: 584–95. [DOI] [PMC free article] [PubMed] [Google Scholar]
- 34. D'Ignazio L, Rocha S. Hypoxia induced NF-kappaB. Cell 2016; 5: 10. [DOI] [PMC free article] [PubMed] [Google Scholar]
- 35. Gill G. SUMO and ubiquitin in the nucleus: Different functions, similar mechanisms? Genes Dev 2004; 18: 2046–59. [DOI] [PubMed] [Google Scholar]
- 36. Anokhina EB, Buravkova LB. Mechanisms of regulation of transcription factor HIF under hypoxia. Biochemistry (Mosc) 2010; 75: 151–8. [DOI] [PubMed] [Google Scholar]
- 37. Teufel DP, Freund SM, Bycroft Met al. Four domains of p300 each bind tightly to a sequence spanning both transactivation subdomains of p53. Proc Natl Acad Sci USA 2007; 104: 7009–14. [DOI] [PMC free article] [PubMed] [Google Scholar]
- 38. Zhang B, Day DS, Ho JWet al. A dynamic H3K27ac signature identifies VEGFA-stimulated endothelial enhancers and requires EP300 activity. Genome Res 2013; 23: 917–27. [DOI] [PMC free article] [PubMed] [Google Scholar]
- 39. Gray MJ, Zhang J, Ellis LMet al. HIF-1alpha, STAT3, CBP/p300 and Ref-1/APE are components of a transcriptional complex that regulates Src-dependent hypoxia-induced expression of VEGF in pancreatic and prostate carcinomas. Oncogene 2005; 24: 3110–20. [DOI] [PubMed] [Google Scholar]
- 40. Zheng WS, He YX, Cui CYet al. EP300 contributes to high-altitude adaptation in Tibetans by regulating nitric oxide production. Zool Res 2017; 38: 163–70. [DOI] [PMC free article] [PubMed] [Google Scholar]
- 41. Moore LG, Armaza F, Villena Met al. Comparative aspects of high-altitude adaptation in human populations. Adv Exp Med Biol 2000; 475: 45–62. [DOI] [PubMed] [Google Scholar]
- 42. Arestegui AH, Fuquay R, Sirota Jet al. High altitude renal syndrome (HARS). J Am Soc Nephrol 2011; 22: 1963–8. [DOI] [PubMed] [Google Scholar]
- 43. Dimitroulas T, Giannakoulas G, Dimitroula Het al. Significance of serum uric acid in pulmonary hypertension due to systemic sclerosis: A pilot study. Rheumatol Int 2011; 31: 263–7. [DOI] [PubMed] [Google Scholar]
- 44. Astle WJ, Elding H, Jiang Tet al. The allelic landscape of human blood cell trait variation and links to common complex disease. Cell 2016; 167: 1415–29. [DOI] [PMC free article] [PubMed] [Google Scholar]
- 45. Beall CM, Song K, Elston RCet al. Higher offspring survival among Tibetan women with high oxygen saturation genotypes residing at 4,000 m. Proc Natl Acad Sci USA 2004; 101: 14300–4. [DOI] [PMC free article] [PubMed] [Google Scholar]
- 46. He H, Dai F, Yu Let al. Identification and characterization of nine novel human small GTPases showing variable expressions in liver cancer tissues. Gene Expr 2002; 10: 231–42. [DOI] [PMC free article] [PubMed] [Google Scholar]
- 47. Plagnol V, Smyth DJ, Todd JAet al. Statistical independence of the colocalized association signals for type 1 diabetes and RPS26 gene expression on chromosome 12q13. Biostatistics 2009; 10: 327–34. [DOI] [PMC free article] [PubMed] [Google Scholar]
- 48. Melé M, Ferreira PG, Reverter Fet al. The human transcriptome across tissues and individuals. Science. 2015; 348: 660–5. [DOI] [PMC free article] [PubMed] [Google Scholar]
- 49. Swenson ER, Bärtsch P. High altitude: Human adaptation to hypoxia. New York: Springer, 2014. [Google Scholar]
- 50. Charlesworth G, Plagnol V, Holmström Kira Met al. Mutations in ANO3 cause dominant craniocervical dystonia: Ion channel implicated in pathogenesis. Am J Hum Genet 2012; 91: 1041–50. [DOI] [PMC free article] [PubMed] [Google Scholar]
- 51. Molina F, Rus A, Peinado MAet al. Short-term hypoxia/reoxygenation activates the angiogenic pathway in rat caudate putamen. J Biosci 2013; 38: 363–71. [DOI] [PubMed] [Google Scholar]
- 52. Sun-Wada GH, Imai-Senga Y, Yamamoto Aet al. A proton pump ATPase with testis-specific E1-subunit isoform required for acrosome acidification. J Biol Chem 2002; 277: 18098–105. [DOI] [PubMed] [Google Scholar]
- 53. Chung JJ, Navarro B, Krapivinsky Get al. A novel gene required for male fertility and functional CATSPER channel formation in spermatozoa. Nat Commun 2011; 2: 153. [DOI] [PMC free article] [PubMed] [Google Scholar]
- 54. Wain LV, Verwoert GC, O'Reilly PFet al. Genome-wide association study identifies six new loci influencing pulse pressure and mean arterial pressure. Nat Genet 2011; 43: 1005–11. [DOI] [PMC free article] [PubMed] [Google Scholar]
- 55. Kam HY, Ou LC, Thron CDet al. Role of the spleen in the exaggerated polycythemic response to hypoxia in chronic mountain sickness in rats. J Appl Physiol 1999; 87: 1901–8. [DOI] [PubMed] [Google Scholar]
- 56. Bosco MC, Puppo M, Santangelo Cet al. Hypoxia modifies the transcriptome of primary human monocytes: Modulation of novel immune-related genes and identification of CC-chemokine ligand 20 as a new hypoxia-inducible gene. J Immunol 2006; 177: 1941. [DOI] [PubMed] [Google Scholar]
- 57. Clark PU, Dyke AS, Shakun JDet al. The last glacial maximum. Science 2009; 325: 710–4. [DOI] [PubMed] [Google Scholar]
- 58. Hu H, Petousi N, Glusman Get al. Evolutionary history of Tibetans inferred from whole-genome sequencing. PLoS Genet 2017; 13: e1006675. [DOI] [PMC free article] [PubMed] [Google Scholar]
- 59. Jeong C, Witonsky DB, Basnyat Bet al. Detecting past and ongoing natural selection among ethnically Tibetan women at high altitude in Nepal. PLoS Genet 2018; 14: e1007650. [DOI] [PMC free article] [PubMed] [Google Scholar]
- 60. Jeong C, Alkorta-Aranburu G, Basnyat Bet al. Admixture facilitates genetic adaptations to high altitude in Tibet. Nat Commun 2014; 5: 3281. [DOI] [PMC free article] [PubMed] [Google Scholar]
- 61. Abi-Rached L, Jobin MJ, Kulkarni Set al. The shaping of modern human immune systems by multiregional admixture with archaic humans. Science 2011; 334: 89–94. [DOI] [PMC free article] [PubMed] [Google Scholar]
- 62. Ding Q, Hu Y, Xu Set al. Neanderthal origin of the haplotypes carrying the functional variant Val92Met in the MC1R in modern humans. Mol Biol Evol 2014; 31: 1994–2003. [DOI] [PubMed] [Google Scholar]
- 63. Ding Q, Hu Y, Xu Set al. Neanderthal introgression at chromosome 3p21.31 was under positive natural selection in east Asians. Mol Biol Evol 2014; 31: 683–95. [DOI] [PubMed] [Google Scholar]
- 64. Mendez FL, Watkins JC, Hammer MF. A haplotype at STAT2 Introgressed from neanderthals and serves as a candidate of positive selection in Papua New Guinea. Am J Hum Genet 2012; 91: 265–74. [DOI] [PMC free article] [PubMed] [Google Scholar]
- 65. Racimo F, Sankararaman S, Nielsen Ret al. Evidence for archaic adaptive introgression in humans. Nat Rev Genet 2015; 16: 359–71. [DOI] [PMC free article] [PubMed] [Google Scholar]
- 66. Mendez FL, Watkins JC, Hammer MF. Global genetic variation at OAS1 provides evidence of archaic admixture in Melanesian populations. Mol Biol Evol 2012; 29: 1513–20. [DOI] [PubMed] [Google Scholar]
- 67. Freitas AA. Understanding the crucial role of attribute interaction in data mining. Artif Intell Rev 2001; 16: 177–99. [Google Scholar]
- 68. McKenna A, Hanna M, Banks Eet al. The genome analysis toolkit: A MapReduce framework for analyzing next-generation DNA sequencing data. Genome Res 2010; 20: 1297–303. [DOI] [PMC free article] [PubMed] [Google Scholar]
- 69. DePristo MA, Banks E, Poplin Ret al. A framework for variation discovery and genotyping using next-generation DNA sequencing data. Nat Genet 2011; 43: 491–8. [DOI] [PMC free article] [PubMed] [Google Scholar]
- 70. Danecek P, Auton A, Abecasis Get al. The variant call format and VCFtools. Bioinformatics 2011; 27: 2156–8. [DOI] [PMC free article] [PubMed] [Google Scholar]
- 71. Delaneau O, Marchini J, Zagury JF. A linear complexity phasing method for thousands of genomes. Nat Methods 2011; 9: 179–81. [DOI] [PubMed] [Google Scholar]
- 72. Mallick S, Li H, Lipson Met al. The Simons genome diversity project: 300 genomes from 142 diverse populations. Nature 2016; 538: 201–6. [DOI] [PMC free article] [PubMed] [Google Scholar]
- 73. Howie BN, Donnelly P, Marchini J. A flexible and accurate genotype imputation method for the next generation of genome-wide association studies. PLoS Genet 2009; 5: e1000529. [DOI] [PMC free article] [PubMed] [Google Scholar]
- 74. Engstrom PG, Steijger T, Sipos Bet al. Systematic evaluation of spliced alignment programs for RNA-seq data. Nat Methods 2013; 10: 1185–91. [DOI] [PMC free article] [PubMed] [Google Scholar]
- 75. Castel SE, Levy-Moonshine A, Mohammadi Pet al. Tools and best practices for data processing in allelic expression analysis. Genome Biol 2015; 16: 195. [DOI] [PMC free article] [PubMed] [Google Scholar]
- 76. McLaren W, Gil L, Hunt SEet al. The Ensembl variant effect predictor. Genome Biol 2016; 17: 122. [DOI] [PMC free article] [PubMed] [Google Scholar]
- 77. Keen JC, Moore HM. The genotype-tissue expression (GTEx) project: Linking cliinical data with molecular analysis to advance personalized medicine. J Pers Med 2015; 5: 22–9. [DOI] [PMC free article] [PubMed] [Google Scholar]
- 78. Hubbard T, Barker D, Birney Eet al. The Ensembl genome database project. Nucleic Acids Res 2002; 30: 38–41. [DOI] [PMC free article] [PubMed] [Google Scholar]
- 79. Weir BS. Estimating F-statistics: A historical view. Philos Sci 2012; 79: 637–43. [DOI] [PMC free article] [PubMed] [Google Scholar]
- 80. Voight BF, Kudaravalli S, Wen Xet al. A map of recent positive selection in the human genome. PLoS Biol 2006; 4: e72. [DOI] [PMC free article] [PubMed] [Google Scholar]
- 81. Szpiech ZA, Hernandez RD. Selscan: An efficient multithreaded program to perform EHH-based scans for positive selection. Mol Biol Evol 2014; 31: 2824–7. [DOI] [PMC free article] [PubMed] [Google Scholar]
- 82. Sabeti PC, Varilly P, Fry Bet al. Genome-wide detection and characterization of positive selection in human populations. Nature 2007; 449: 913–8. [DOI] [PMC free article] [PubMed] [Google Scholar]
- 83. Grossman SR, Shlyakhter I, Karlsson EKet al. A composite of multiple signals distinguishes causal variants in regions of positive selection. Science 2010; 327: 883–6. [DOI] [PubMed] [Google Scholar]
- 84. Ng PC, Henikoff S.. SIFT: Predicting amino acid changes that affect protein function. Nucleic Acids Res 2003; 31: 3812–4. [DOI] [PMC free article] [PubMed] [Google Scholar]
- 85. Adzhubei IA, Schmidt S, Peshkin Let al. A method and server for predicting damaging missense mutations. Nat Methods 2010; 7: 248–9. [DOI] [PMC free article] [PubMed] [Google Scholar]
- 86. Purcell S, Neale B, Todd-Brown Ket al. PLINK: A tool set for whole-genome association and population-based linkage analyses. Am J Hum Genet 2007; 81: 559–75. [DOI] [PMC free article] [PubMed] [Google Scholar]
- 87. Yang J, Lee SH, Goddard MEet al. GCTA: A tool for genome-wide complex trait analysis. Am J Hum Genet 2011; 88: 76–82. [DOI] [PMC free article] [PubMed] [Google Scholar]
- 88. Ihaka R, Gentleman R.. R: A language for data analysis and graphics. J Comput Graph Stat 1996; 5: 299–314. [Google Scholar]
- 89. Dobin A, Davis CA, Schlesinger Fet al. STAR: Ultrafast universal RNA-seq aligner. Bioinformatics 2013; 29: 15–21. [DOI] [PMC free article] [PubMed] [Google Scholar]
- 90. Vernot B, Akey JM. Resurrecting surviving Neandertal lineages from modern human genomes. Science 2014; 343: 1017–21. [DOI] [PubMed] [Google Scholar]
- 91. Plagnol V, Wall JD. Possible ancestral structure in human populations. PLoS Genet 2006; 2: e105. [DOI] [PMC free article] [PubMed] [Google Scholar]
- 92. Hudson RR. Generating samples under a Wright-fisher neutral model of genetic variation. Bioinformatics 2002; 18: 337–8. [DOI] [PubMed] [Google Scholar]
- 93. Tennessen JA, Bigham AW, O'Connor TDet al. Evolution and functional impact of rare coding variation from deep sequencing of human exomes. Science 2012; 337: 64–9. [DOI] [PMC free article] [PubMed] [Google Scholar]
- 94. Gravel S, Henn BM, Gutenkunst RNet al. Demographic history and rare allele sharing among human populations. Proc Natl Acad Sci USA 2011; 108: 11983. [DOI] [PMC free article] [PubMed] [Google Scholar]
- 95. Lawson DJ, Hellenthal G, Myers Set al. Inference of population structure using dense haplotype data. PLoS Genet 2012; 8: e1002453. [DOI] [PMC free article] [PubMed] [Google Scholar]
- 96. Baran Y, Pasaniuc B, Sankararaman Set al. Fast and accurate inference of local ancestry in Latino populations. Bioinformatics 2012; 28: 1359–67. [DOI] [PMC free article] [PubMed] [Google Scholar]
- 97. Price AL, Tandon A, Patterson Net al. Sensitive detection of chromosomal segments of distinct ancestry in admixed populations. PLoS Genet 2009; 5: e1000519. [DOI] [PMC free article] [PubMed] [Google Scholar]
- 98. Brisbin A, Bryc K, Byrnes Jet al. PCAdmix: Principal components-based assignment of ancestry along each chromosome in individuals with admixed ancestry from two or more populations. Hum Biol 2013; 84: 343–64. [DOI] [PMC free article] [PubMed] [Google Scholar]
- 99. Prufer K, Racimo F, Patterson Net al. The complete genome sequence of a Neanderthal from the Altai Mountains. Nature 2014; 505: 43–9. [DOI] [PMC free article] [PubMed] [Google Scholar]
- 100. Meyer M, Kircher M, Gansauge MTet al. A high-coverage genome sequence from an archaic Denisovan individual. Science 2012; 338: 222–6. [DOI] [PMC free article] [PubMed] [Google Scholar]
- 101. Fu Q, Li H, Moorjani Pet al. Genome sequence of a 45,000-year-old modern human from western Siberia. Nature 2014; 514: 445–9. [DOI] [PMC free article] [PubMed] [Google Scholar]
- 102. Cantsilieris S, Stessman HA, Shendure Jet al. Targeted capture and high-throughput sequencing using molecular inversion probes (MIPs). Methods Mol Biol 2017; 1492: 95–106. [DOI] [PMC free article] [PubMed] [Google Scholar]
- 103. Smith J, Coop G, Stephens Met al. Estimating time to the common ancestor for a beneficial allele. Mol Biol Evol 2018; 35: 1003–17. [DOI] [PMC free article] [PubMed] [Google Scholar]
- 104. Barrett JC, Fry B, Maller Jet al. Haploview: Analysis and visualization of LD and haplotype maps. Bioinformatics 2005; 21: 263–5. [DOI] [PubMed] [Google Scholar]
Associated Data
This section collects any data citations, data availability statements, or supplementary materials included in this article.