

Abstract
The dynamic nature of resting-state functional magnetic resonance imaging (fMRI) brain activity and connectivity has drawn great interest in the past decade. Specific temporal properties of fMRI brain dynamics, including metrics such as occurrence rate and transitions, have been associated with cognition and behaviors, indicating the existence of mechanism distruption in neuropsychiatric disorders. The development of new methods to manipulate fMRI brain dynamics will advance our understanding of these pathophysiological mechanisms from native observation to experimental mechanistic manipulation. In the present study, we applied repeated transcranial direct current stimulation (tDCS) to the right dorsolateral prefrontal cortex (rDLPFC) and the left orbitofrontal cortex (lOFC), during multiple simultaneous tDCS-fMRI sessions from 81 healthy participants to assess the modulatory effects of stimulating target brain regions on fMRI brain dynamics. Using the rDLPFC and the lOFC as seeds, respectively, we first identified two reoccurring co-activation patterns (CAPs) and calculated their temporal properties (e.g., occurrence rate and transitions) before administering tDCS. The spatial maps of CAPs were associated with different cognitive and disease domains using meta-analytical decoding analysis. We then investigated how active tDCS compared to sham tDCS in the modulation of the occurrence rates of these different CAPs and perturbations of transitions between CAPs. We found that by enhancing neuronal excitability of the rDLPFC and the lOFC, the occurrence rate of one CAP was significantly decreased while that of another CAP was significantly increased during the first 6 min of stimulation. Furthermore, these tDCS-associated changes persisted over subsequent testing sessions (both during and before/after tDCS) across three consecutive days. Active tDCS could perturb transitions between CAPs and a non-CAP state (when the rDLPFC and the lOFC were not activated), but not the transitions within CAPs. These results demonstrate the feasibility of modulating fMRI brain dynamics, and open new possibilities for discovering stimulation targets and dynamic connectivity patterns that can ensure the propagation of tDCS-induced neuronal excitability, which may facilitate the development of new treatments for disorders with altered dynamics.
Keywords: Transcranial direct current stimulation, Co-activation patterns, Dorsolateral prefrontal cortex, Orbitofrontal cortex, Brain dynamics, Neuronal excitability
1. Introduction
Functional magnetic resonance imaging (fMRI) has been widely used to investigate the brain’s functional activity and connectivity by means of the blood oxygenation level-dependent (BOLD) signal which is a proxy for neural activity (Logothetis et al., 2001). Studies have shown that the brain is intrinsically organized with spatial patterns of temporal BOLD correlations even without any explicit stimulation or task. Those networks are generally referred to as ‘resting-state networks (RSNs)’ (Biswal et al., 1995), and can provide novel insights into the brain’s functional organization for development (Dosenbach et al., 2010), behaviors (Finn et al., 2015), and diseases (Buckner et al., 2009).
Recent studies have challenged the conventional assumptions that the temporal BOLD correlations remain constant and that RSNs are invariant through the entire fMRI scan by showing that resting-state brain activity and functional connectivity can vary considerably in different temporal scales (Hutchison et al., 2013; Lurie et al., 2020; Zalesky et al., 2014). The sliding window approach is one of the most widely applied tools to track the fMRI temporal dynamics by evaluating functional connectivity across consecutive temporal windows of 30–60 s over the fMRI scan (Hindriks et al., 2016; Hutchison et al., 2013). Other time-resolved approaches that can provide enhanced temporal resolution by evaluating brain dynamics at a framewise level have also drawn attention (Bolton et al., 2020a). For instance, Liu and Duyn found that averaging the whole brain spatial maps at a few critical time points when the seed (i.e., region of interest) signal intensity is above a specific threshold can resemble maps obtained from conventional linear correlation (Liu and Duyn, 2013). Moreover, spatial maps at these critical time frames can be temporally decomposed into multiple reoccurring spatial patterns (i.e., co-activation patterns, CAPs). Compared to the sliding window approach, CAP analysis has fewer model assumptions and is more suitable for investigations into the co-activation between predefined regions of interest (ROIs) and other brain areas (Liu et al., 2018).
Studies investigating temporal properties of fMRI brain dynamics have explored the abnormal occurrences of disease-specific dynamic brain connectomics in a variety of neuropsychiatric disorders, such as chronic low back pain (Tu et al., 2020), migraine (Tu et al., 2019a), Alzheimer’s disease (Fu et al., 2019), autism (Fu et al., 2018), and Parkinson’s disease (Kim et al., 2017). Moreover, studies have shown that the temporal organization of brain dynamics is not random but may follow specific sequential orders/states (Ma and Zhang, 2018). The transitions between these different dynamic states reflect the intrinsic architecture of the human brain (Kringelbach and Deco, 2020), and could be perturbed by psychological states (e.g., emotions), physiological states (e.g., sleep, coma), or pathological states (e.g., neuropsychiatric disorders) (Deco et al., 2019).
Recent developments in transcranial electrical stimulation (e.g., transcranial direct current stimulation, tDCS) have advanced interest from observing native neural responses to mechanistic manipulation (Chase et al., 2020; Polanía et al., 2018). By stimulating a targeted brain region (e.g., anodal tDCS to enhance neuronal excitability, while cathodal tDCS to inhibit neuronal excitability), tDCS allows researchers to make inferences between the neural processes and specific behaviors, such as learning, memory, perception, and motor actions (Filmer et al., 2014). In parallel, tDCS has also been used to relieve symptoms of different disorders such as chronic pain (Fregni et al., 2007), autism (Amatachaya et al., 2014), depression (Loo et al., 2012), Alzheimer’s disease (Ferrucci et al., 2008), and Parkinson’s disease (Broeder et al., 2015).
Combining fMRI brain dynamics and tDCS can mutually promote our understandings of both fields. In a concurrent tDCS-fMRI model, findings from active tDCS (i.e., anodal and cathodal) and sham tDCS can be contrasted to allow for the elimination of well-known non-physiological noises (e.g., head motion, vigilance, heartbeat) that confound fMRI brain dynamics (Lurie et al., 2020). Target brain regions can be continuously stimulated (while the participant is restful and passively receiving the stimulation) to modulate brain dynamics as compared to ‘rest’. Studying brain dynamics during stimulation may reveal temporal alterations and perturb transitions in the underlying networks (Deco et al., 2019; Ozdemir et al., 2020) which cannot be discovered through conventional static functional connectivity (Keeser et al., 2011; Wörsching et al., 2017).
In this study, we combined repeated tDCS over three consecutive days and a time-resolved fMRI analytical approach to study and perturb brain dynamics in 81 healthy participants who were randomized into three tDCS groups: 1) anodal at the right dorsolateral prefrontal cortex (rDLPFC) and cathodal at the left orbitofrontal cortex (lOFC); 2) cathodal at the rDLPFC and anodal at the lOFC and 3) sham tDCS. fMRI data were collected before, during, and after tDCS application on the first and third days. We first performed high-dimensional clustering of CAPs and identified reoccurring whole-brain fMRI brain dynamics (i.e., the rDLPFC and lOFC CAPs) before applying tDCS. We then investigated the occurrences and transitions of brain dynamics during and after tDCS application. We hypothesized that the active but not the sham tDCS could modulate the temporal dynamics of CAPs, including the occurrence rates and transition probabilities.
2. Methods
2.1. Participants
Healthy participants without any psychiatric or neurologic disorders were enrolled in the study. Four participants were dropped after the randomization (N = 3 and 1 for cathodal and sham groups, respectively; due to scheduling issues or device dysfunction). The final sample consisted of 81 participants (37 females, mean ± SD age: 27.4 ± 6.4), with 27 participants in each of the three tDCS groups. All participants finished the experiment. Participants in the three groups were not significantly different in age (F(2,78) = 0.17, p = 0.84) and gender (χ2 = 0.40, p = 0.82). The study was approved by the Massachusetts General Hospital Institutional Review Board. Informed consent was obtained from all participants. The study was originally designed to investigate the modulation effects of tDCS on placebo and nocebo responses (Tu et al., 2021); however, this manuscript only focused on how tDCS can perturb the brain dynamics. Please see the orignal publication for more details of the study (Tu et al., 2021).
2.2. tDCS setup
Participants were randomized into three tDCS groups (anodal, cathodal, and sham; Fig. 1B), and received corresponding tDCS on three consecutive days. For each session, tDCS was applied at 2 mA for 20 min using the StarStim system (Neuroelectrics, Spain). The MRI-compatible electrodes, consisting of a sponge cover and a carbon rubber core (circular shape contact area 8 cm2), both radiotranslucid materials, were used to stimulate the rDLPFC and the lOFC (details of the electrode can be found in the Neuroelectrics user manual and Figure S1). These two regions were selected as stimulation targets since they are important regions involved in various cognitive processes and have been used as targets for non-invasive neuromodulation in treating many neuropsychiatric disorders (Demirtas-Tatlidede et al., 2013).
Fig. 1. Study protocol.
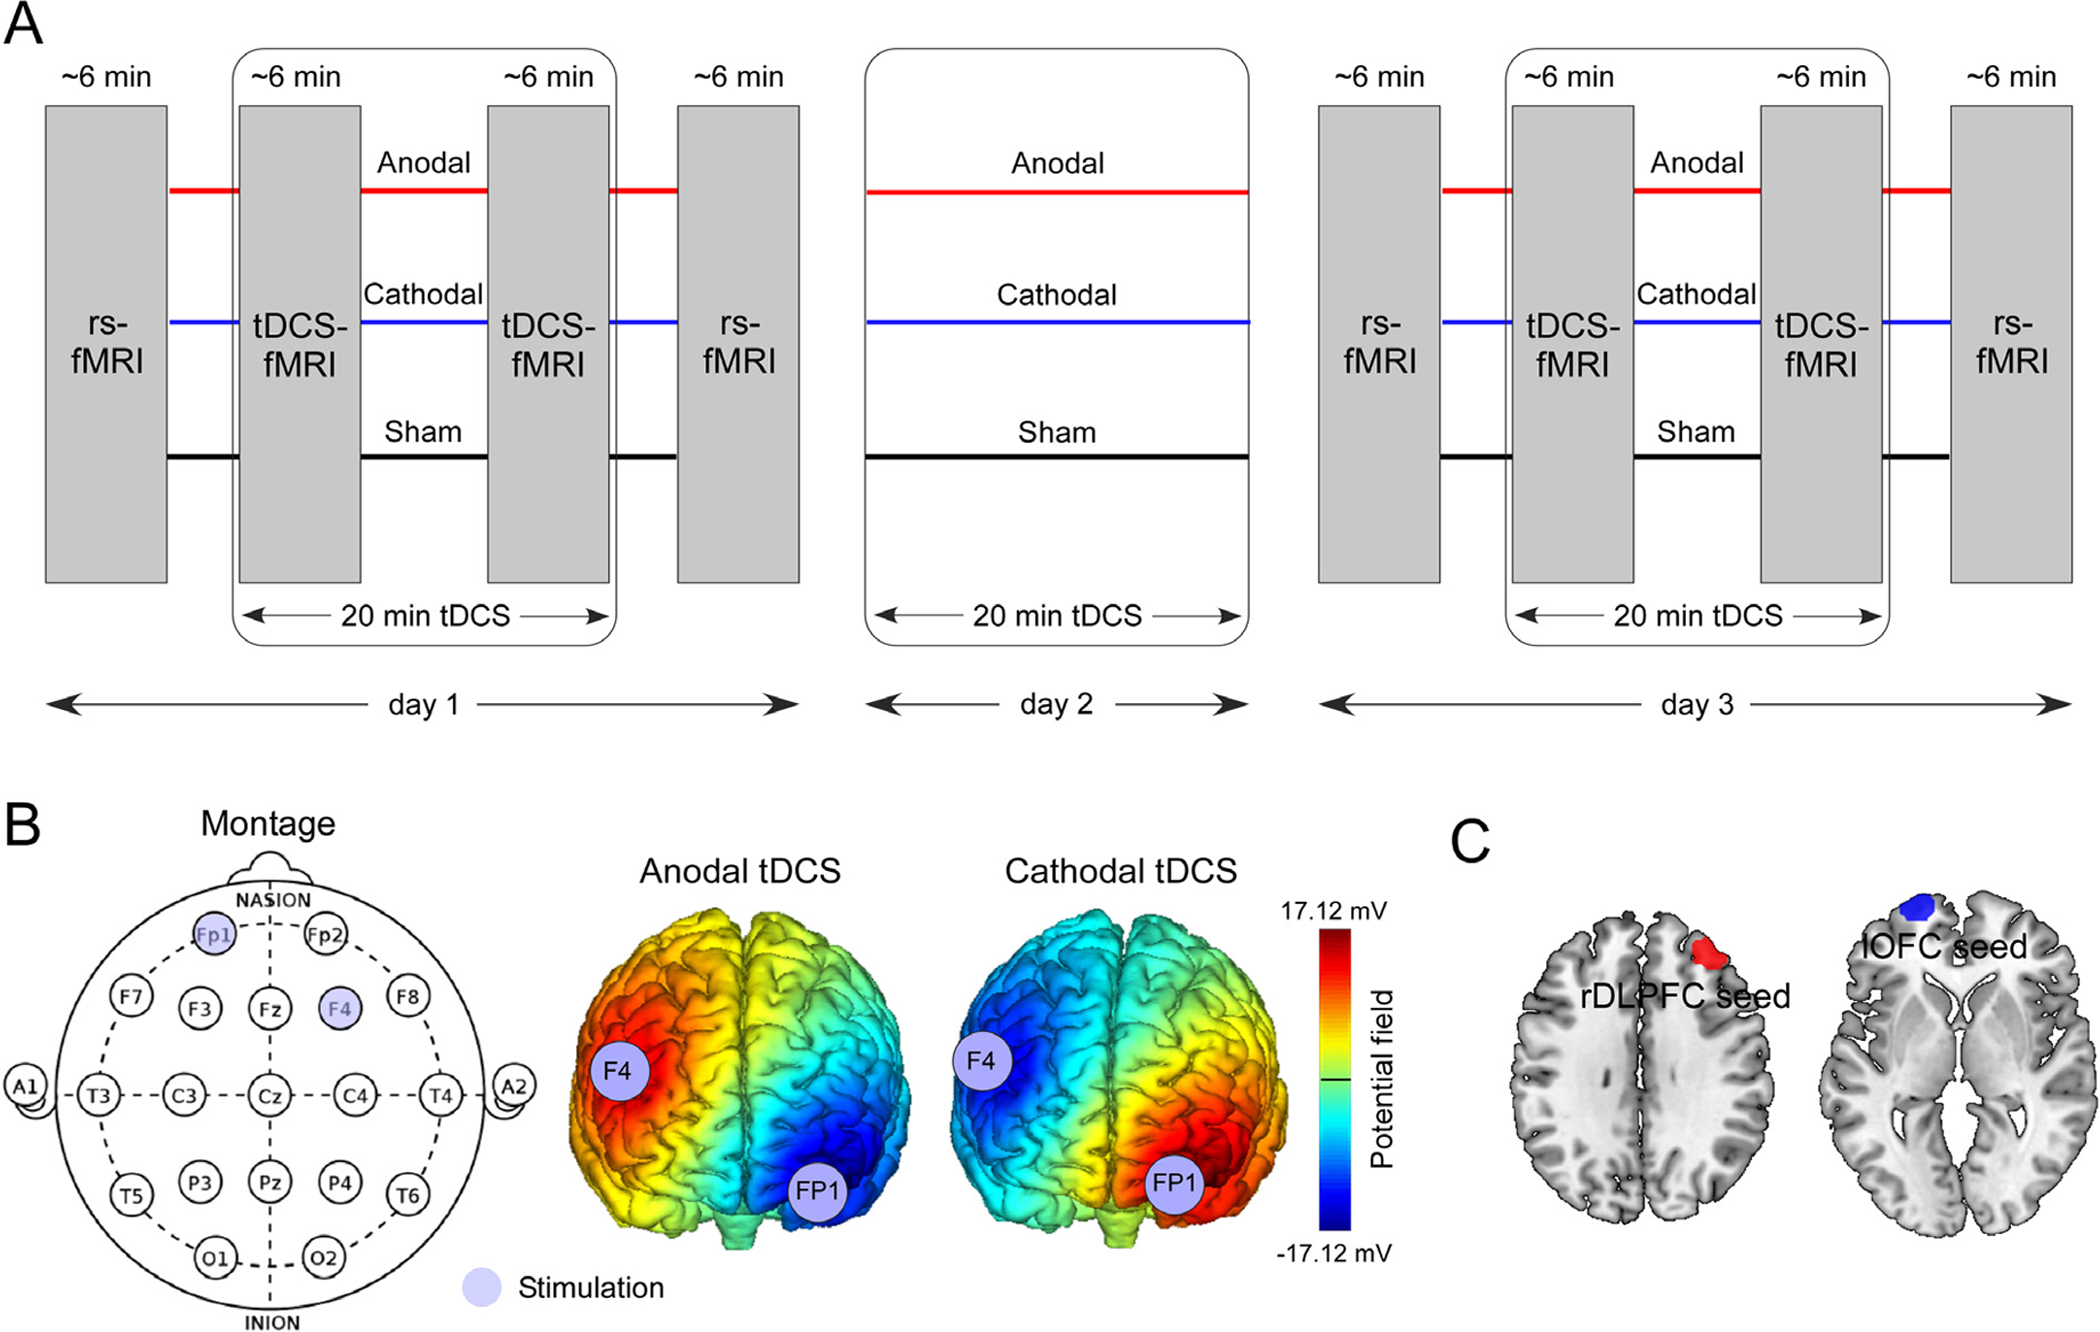
A. 20 min anodal, cathodal, and sham tDCS were applied on 3 consecutive days according to a double-blind, between-subject design. fMRI data were collected before the tDCS session (rs-fMRI), during the first 6 min of tDCS session (tDCS-fMRI), during the last 6 min of tDCS session (tDCS-fMRI), and after the tDCS session (rs-fMRI). rsfMRI: resting-state fMRI. B. The anodal electrode was placed over F4 and the cathodal electrode above FP1 for the rDLPFC excitability enhancement. The anodal electrode was placed over FP1 and the cathodal electrode above F4 for the lOFC excitability enhancement. Color bar indicates the strength of the potential field. For sham tDCS treatment, stimulation was applied only at ramp periods at the beginning and end of sham stimulation to mimic the somatosensory effect of active tDCS for 15 s. C. The rDLPFC seed (MNI coordinates: x = 36, y = 44, z = 32; radius = 10 mm) and the lOFC seed (MNI coordinates: x = −22, y = 65, z = −2; radius = 10 mm)used in functional connectivity analyses. Areas outside the cortex were rejected.
To enhance the rDLPFC excitability and inhibit the lOFC excitability (anodal group), the anodal electrode was placed over F4 and the cathodal electrode over FP1. To inhibit the rDLPFC excitability and enhance the lOFC excitability (cathodal group), the cathodal electrode was placed over F4 and the anodal electrode over the FP1 (Fig. 1 and Figure S1). Stimulation started and finished with a 15 s gradual current ramp-up and ramp-down to decrease subjects’ discomfort. For sham tDCS, the electrodes were placed at the same positions but the current was applied only for the 15 s ramp up/down phases at the beginning and the end of a 20 min sham-stimulation period, to simulate the potential experience of local tingling sensation that active stimulation produces but without sustained effect on cortical activity. This setup of sham tDCS is widely accepted in tDCS studies to blind subjects (Palm et al., 2013), and subjects in this study were not able to distinguish between active and sham tDCS. The impedances were kept below 10 kΩ for both stimulation electrodes. The randomization and double-blinded setup of tDCS were conducted by a team member who was not involved in the experiments and analyses of the study, before initiating the first experiment. The double-blinded tDCS modes were configured in the StarStim system software to blind both operators/analysts and participants. We measured the sensations evoked by active and sham tDCS in the last half of enrolled participants using a questionnaire of sensations related to transcranial electrical stimulation (Antal et al., 2017). The results showed that the sensations were not significantly different across the three tDCS groups (F(2,28) = 0.35, p = 0.71; F(2,28) = 2.25, p = 0.12; F(2,28) = 1.56, p = 0.23 for day 1, day 2, and day 3 tDCS sessions respectively, Figure S2).
2.3. MRI acquisition
Eight fMRI scans were collected in the first (day 1) and the third (day 3) tDCS sessions (Fig. 1A), including one before applying tDCS (pre-tDCS), two simultaneously during the application of tDCS (one during the first 6 min [tDCS-early], another during the last 6 min [tDCS-late]), and one immediately after the application of tDCS (post-tDCS). All MRI data were acquired using a 32 channel radio-frequency head coil in a 3T Siemens scanner at the Massachusetts General Hospital Martinos Center for Biomedical Imaging. During the fMRI scan, subjects were asked to keep their eyes open and to blink normally while looking at a darkened screen for approximately 6 min. Functional data encompassing the whole brain were acquired with gradient echo planar imaging (echo time: 30 ms, repetition time: 3000 ms, flip angle: 90°, slice thickness: 3 mm, interslice gap: 0.88 mm, and 44 slices) and a total of 124 vol were collected. T1-weighted high-resolution brain structural images were acquired with a 3-dimensional multi-echo magnetization-prepared rapid gradient-echo sequence (repetition time: 2200 ms, echo time: 1.54 ms, slice thickness 1 mm, flip angle: 7°, and 176 sagittal slices covering the whole brain).
For the concurrent tDCS-fMRI sessions, tDCS was applied in the MRI scanner using the Neuroelectrics’ ‘Multi-Channel MRI Extension Kit’. MRI-compatible electrodes were used inside the tDCS cap, which subjects wore inside the scanner. The electrode leads on Neuroelectrics’ ‘MRI Harness’ were then attached to the cap electrodes, and the Harness was plugged into the patch panel in the MRI scan room. On the opposite side of the patch panel in the MRI control room, an ‘MRI Filter’ was attached. The tDCS device was connected to the Filter inside the control room and always remained outside of the MRI scan room. The subject was instructed to wear the cap inside the MRI, and was asked to lay down and keep still in the MRI machine. The device was connected for all experiment sessions, but was turned off during pre/post-DCS sessions. For the sham session, the device was turned on with the ‘sham’ setup configured in the StarStim system software to blind both operators/analysts and participants. The imaging was started after the stimulation ramp up, and before the stimulation ramp down.
In order to test the reproducibility of the identified CAPs, we included a dataset consisting of twenty-four healthy subjects who received four MRI sessions separated by at least 7 days. This dataset was reported in our previous study (Tu et al., 2019b). In brief, twenty-four subjects received 8 min of resting-state fMRI, and the MRI sequence was identical to the dataset we reported above, except the total length of the scan.
2.4. fMRI data preprocessing and quality control
fMRI data were preprocessed using the CONN toolbox version 18b (https://www.nitrc.org/projects/conn). The first five volumes were removed for signal equilibrium and participants’ adaptation to the scanner’s noise. Preprocessing steps included a standard pipeline (slice-timing correction, realignment, unwarping, spatial normalization, and smoothing with a 6 mm full-width at half-maximum [FWHM] Gaussian kernel). White matter, cerebrospinal fluid signals, and the linear trends of 6 motion parameters, were included as nuisances regressors which were regressed out from the fMRI data. The fMRI data were then band-pass filtered from 0.01 Hz to 0.08 Hz.
We performed quality control for each fMRI runs using MRIQC (https://mriqc.readthedocs.io/en/stable/), to compare the data quality between tDCS groups and between tDCS on and tDCS off runs. For quality control, we focused on two typical metrics, temporal signal-to-noise ratio (tSNR) and mean framewise displacement (FD; measures head motion during scan) (Figures S3 and S4).
2.5. Co-activation analytical framework
In conventional seed-based connectivity analysis, connectivity maps are obtained by correlating the time-series of the seed region with the time-series of all other voxels in the brain. CAP analysis has shown that similar connectivity maps can be obtained by temporally averaging the spatial maps of the time frames when the seed amplitude exceeds a certain threshold. Temporal clustering of these extracted spatial maps can yield multiple CAPs that are functionally relevant and reoccur during an fMRI scan (Liu and Duyn, 2013). Fig. 2 shows the analytical framework to identify CAPs. We performed the analyses using the TbCAPs toolbox (Bolton et al., 2020b). In brief, we consider an fMRI data matrix Xn ∈ ℝV×T for a particular subject, where V is the number of voxels in the whole brain and T is the number of time frames during the scan. In the first step, the data matrix Xn needs to be temporally z-scored at each voxel to have:
| (1) |
| (2) |
Fig. 2. Framework of co-activation pattern (CAP) analysis.

A. Critical time points (i.e., frames) when seed time course exceed a threshold were identified, and fMRI spatial maps were extracted from these critical time points. B. Spatial maps from all subjects were concatenated and K-means clustering was performed to identify CAPs. C. The occurrences and transitions of CAPs were computed. CAP 0 represents the state in which the seed (e.g., the rDLPFC) is not strongly activated.
Then we define a seed region S (e.g., the rDLPFC in Fig. 2A) to probe the interactions with the rest of the brain. The amplitude of the seed region at a time frame can be written as:
| (3) |
where |S| denotes the number of voxels in S. According to (Liu and Duyn, 2013), we only consider critical time points (i.e., frames) T+ ∈ T when the seed time course An(t) exceeds a threshold, and construct the set of spatial maps extracted from these critical time points, as , n = 1, …, N. Here we used a threshold of 1 (since the data were z-scored, we would retain about 16% of time points; a detailed explanation for the reasoning behind this choice can be found in (Bolton et al., 2020b); we also retained 20% frames to validate our results) and scrubbed the frame if the head motion (i.e., instantaneous frame displacement) was larger than 0.5 mm (see Figure S5 for the numbers of frames discarded in different sessions and groups). After constructing the set for each subject, we concatenate spatial maps from subjects and perform clustering into reoccurring states using K-means clustering by optimizing:
| (4) |
where K is the number of states to derive, and ck is the spatial map of CAP k. The dist function depends on the type of distance to use in the algorithm, which in the current study was the spatial correlation between two spatial maps. The number of clusters, K, is a key parameter for clustering. As suggested by (Bolton et al., 2020b; Zoller et al., 2019), we applied consensus clustering to determine the best K for large scale fMRI data (see Supplementary Material for details).
The clustering analysis was only performed on the baseline data (i.e., pre-tDCS data on Day 1) across all subjects. We then assigned the frames in the following other sessions (during and after tDCS) to the identified CAPs by calculating the distance between each frame data and cluster centroids (i.e., assign the frame to the CAP with highest spatial correlation). In addition, a frame was assigned to a CAP only when the spatial correlation was sufficiently high compared to the distribution of spatial correlations obtained from the clustering analysis of baseline data (i.e., exceeds the 5th percentile of the distribution) (Bolton et al., 2020b). In this way, we were able to track the reoccurring CAPs which were referenced to the baseline data, and investigate the changes of occurrences and transitions induced by tDCS. Note that the occurrence rate of each CAP represents the proportion of its corresponding number of frames from all identified critical time points. The transitions include K CAPs and a non-CAP state (here we denoted it as CAP 0) when the seed (e.g., the rDLPFC) is not strongly activated (i.e., frames does not exceed the threshold). The transitions are bi-directional between CAPs.
In the present study, we selected the rDLPFC and the lOFC as two seeds since the anodal and cathodal tDCS were aimed to enhance neuronal excitability in these two regions, respectively. The coordinates (x = 36, y = 44, z = 32 for the rDLPFC; x = −22, y = 65, z = −2 for the lOFC) were defined based on the 10–20 electrode system (F4 electrode and FP1 electrode) projected onto the MNI cortical space (Cutini et al., 2011; Okamoto et al., 2004). The seeds were a sphere with a 10-mm radius, comparable to that used by Miranda and colleagues (Miranda et al., 2006), and areas outside the cortex were rejected using the whole brain mask.
In order to validate the reproducibility of the rDLPFC CAPs, we performed the analysis separately on each of the four sessions in the longitudinal test-retest dataset (see MRI acqusitions and (Tu et al., 2019b) for details). If the CAPs are reproducible, we will be able to see very similar spatial maps across four sessions, and these maps will also have very high similarity to the maps we identified from the tDCS dataset. In addition, the occurrence rates of the same CAP will not differ significantly across sessions.
2.6. Meta-analytical decoding
To associate the spatial maps of different CAPs with cognitive and disease domains, we performed a meta-analytical decoding to make reverse inferences from the term-to-activation mappings in Neurosynth (http://neurosynth.org) (Chang et al., 2013). In brief, meta-analytical decoding computed the spatial similarity between the spatial maps of CAP and meta-analytic reverse inference maps in the Neurosynth database. We then visualized the strength of association between each term and each of the CAPs using polar plots. The relevant terms were selected based on the functions of DLPFC and OFC, and they were categorized into two domains: cognitive and disease domains. For DLPFC, the cognitive terms included ‘language’, ‘memory’, ‘social cognition’, ‘execution’, ‘reward’, and ‘attention’, while the disease terms included ‘pain’, ‘depression’, ‘autism’, ‘dementia’, ‘anxiety’, and ‘schizophrenia’. For OFC, the cognitive terms included ‘emotion’, ‘reward’, ‘social cognition’, ‘value’, ‘decision making’, and ‘attention’, while the disease terms included ‘pain’, ‘depression’, ‘autism’, ‘addiction’, ‘bipolar’, and ‘obsessive-compulsive disorder’. We stored the spatial maps at Neurovault (https://neurovault.org/) for interactive meta-analytical decoding of all other terms in the Neurosynth database (https://neurosynth.org/decode/).
3. Results
3.1. The rDLPFC CAPs at baseline
Using the pre-tDCS fMRI data and the rDLPFC as the seed, we identified two reoccurring CAPs, with 54% and 46% occurrence rates, respectively, from the pre-tDCS fMRI data (Fig. 3A). The number of CAPs was determined by the consensus clustering approach, showing K = 2 provided the most robust clustering performing in a range from K = 2 to 10 (Figure S6). The visualizations of both CAPs in low dimensional space is shown in Figure S7. In the first CAP, we observed co-activations in the anterior cingulate cortex (ACC), the contralateral lDPFC, and bilateral inferior parietal lobe (IPL). In the second CAP, the rDLPFC co-activated with the supplementary motor area (SMA), bilateral insula, and bilateral postcentral gyrus (PoCG), while co-deactivation was seen with the default mode network (i.e., medial prefrontal cortex [mPFC], post-cingulate cortex [PCC], and bilateral angular gyrus).
Fig. 3. The rDLPFC and lOFC CAPs at baseline.

A. Spatial maps for the two rDLPFC CAPs. In the first CAP, the rDLPFC co-activated with the anterior cingulate cortex (ACC), the contralateral lDPFC, and bilateral inferior parietal lobe (IPL). In the second CAP, the rDLPFC co-activated with the supplementary motor area (SMA), bilateral insula (INS), and bilateral postcentral gyrus (PoCG), while co-deactivated with the default mode network (i.e., medial prefrontal cortex [mPFC], post-cingulate cortex [PCC], and bilateral angular gyrus). B. Polar maps for the meta-analytical decoding of topics in cognitive and disease domains, respectively. C. Transition probability matrix for the two CAPs and the non-CAP (when the rDLPFC was not activated). D. Spatial maps for the two lOFC CAPs. In the first CAP, the lOFC co-activated with the DMN (mPFC, PCC, and angular gyrus) and superior frontal gyrus (SFG), while co-deactivated with the bilateral PoCG. In the second CAP, the lOFC co-deactivated with the subgenual and pregenual ACC, SFG, and bilateral inferior temporal (IT) lobe. E. Polar maps for the meta-analytical decoding of topics in cognitive and disease domains, respectively. F. Transition probability matrix for the two CAPs and the non-CAP (when the lOFC was not activated).
Meta-analytical decoding (Fig. 3B) showed that the first CAP had positive associations with memory (r = 0.1, p < 0.001) and reward (r = 0.1, p < 0.001), while strong negative associations were seen with language (r = −0.14, p < 0.001) and execution (r = −0.13, p < 0.001) topic maps from Neurosynth. In contrast, the second CAP had strong positive associations with execution (r = 0.26, p < 0.001), attention (r = 0.12, p < 0.001), and pain (r = 0.29, p < 0.001), while strong negative associations were seen with memory (r = − 0.11, p < 0.001) and social cognition (r = −0.15, p < 0.001) topic maps.
Fig. 3C shows the transition probability matrix between the two CAPs (CAP 1 and CAP 2) and the non-CAP (CAP 0). In general, the brain stayed in CAP 0 with 75% probability. The direct transitions between the two CAPs were rare (<1%). In most instances, one CAP needed to switch to the non-CAP before switching to another CAP.
In the validation dataset (Figures S8 and S9), the rDLPFC CAPs were highly reproducible across four sessions and the pre-tDCS session according to the observations (panel A) and spatial correlations (panel B) of their spatial maps. The occurrence rates of the CAPs were also not significantly different across four sessions (F3,92 = 1.07, p = 0.37, one-way repeated measures ANOVA; only one ANCOVA was performed since the occurrence rates of CAP 1 and CAP 2 were proportionally changed, i.e., the sum equals to 100% for each subject).
3.2. The lOFC CAPs at baseline
Using pre-tDCS fMRI data and the lOFC as the seed, we identified two reoccurring CAPs (as determined by consensus clustering; Supplementary Figure S3), with 51% and 49% occurrence rates, respectively, from the pre-tDCS fMRI data (Fig. 3D). The visualization of both CAPs in low dimensional space is shown in Figure S4. In the first CAP, we observed co-activations in the DMN (mPFC, PCC, and angular gyrus) and superior frontal gyrus (SFG), while deactivation was observed in the bilateral PoCG. In the ond CAP, the lOFC co-deactivated with the subgenual and pregenual ACC, SFG, and bilateral inferior temporal lobe.
Meta-analytical decoding (Fig. 3E) showed that the first CAP had positive associations with reward (r = 0.1, p < 0.001), value (r = 0.1, p < 0.001), and social cognition (r = 0.12, p < 0.001), while strong negative associations were seen with attention (r = −0.13, p < 0.001) and pain (r = −0.22, p < 0.001) topic maps from Neurosynth. In contrast, the second CAP had strong negative associations with emotion (r = −0.1, p < 0.001) and reward (r = −0.1, p < 0.001) topic maps.
Fig. 3F shows the transition probability matrix between the two CAPs (CAP 1 and CAP 2) and the non-CAP (CAP 0). Similar to the rDLPFC, the brain stayed in CAP 0 with 75% probability. The direct transitions between the two CAPs were rare (<1%). In most instances, one CAP needed to switch to the non-CAP before switching to another CAP.
In the validation dataset (Figures S10 and S11), the lOFC CAPs were highly reproducible across four sessions and the pre-tDCS session according to the observations (panel A) and spatial correlations (panel B) of their spatial maps. The occurrence rates of the lOFC CAPs were also not significantly different across four sessions (F3,92 = 0.30, p = 0.82, one-way repeated measures ANOVA).
3.3. Anodal tDCS perturb the rDLPFC CAPs dynamics
After the baseline pre-tDCS session, we aimed to enhance neuronal activations in the rDLPFC using the anodal tDCS over three consecutive days and collected two sessions (tDCS-early and tDCS-late) of concurrent tDCS-fMRI on day 1 and day 3, respectively. We investigated the changes of occurrences and transition probabilities of both CAPs in the following seven fMRI sessions (i.e., early tDCS, late tDCS, and post tDCS on day 1, pre tDCS, early tDCS, late tDCS, and post tDCS on day 3; Fig. 4A), in the participants who received anodal tDCS as compared to those who received sham tDCS. The left panel of Fig. 4A shows the difference in occurrence rate between the pre-tDCS session on day 1 (i.e., the baseline) and each of the seven fMRI sessions. Compared to sham tDCS, the anodal tDCS significantly decreased the occurrence rate of the first CAP and increased the occurrence rate of the second CAP in the early tDCS session, and then remained at significantly decreased/elevated levels in the following sessions (two-sample t-test between the (anodalearly/late/post-anodalpre) and (shamearly/late/post-shampre); p values were corrected for multiple comparisons using false-discovery rate [FDR] across 7 comparisons in day 1 and day 3 for each CAP). Fig. 4B shows the changes of transition probabilities across the two CAPs and the non-CAP, between the pre-tDCS session on day 1 and each of the following seven fMRI sessions. We observed that the anodal tDCS significantly reduced the transition probability of bi-directional switches between CAP 0 and CAP 1 (two-sample t-test between the (anodalearly/late/post-anodalpre) and (shamearly/late/post-shampre); p values were corrected for multiple comparisons accounted for all 63 possible switches in the matrix [excluding the baseline column] using FDR), but did not have consistent and significant effects on the switches between the baseline and CAP 2 as well as between CAP 1 and CAP 2. Using a different threshold (20%) to select critical time points, we observed consistent and similar findings for the rDLPFC CAPs and tDCS-perturbed brain dynamics (Figure S12).
Fig. 4. Anodal tDCS perturbs the rDLPFC CAPs dynamics.

A. Anodal tDCS in three consecutive days significantly decreased the occurrence rate of CAP 1 and increased the occurrence rate of CAP 2. In contrast, sham tDCS did not have any effect on the occurrence rates. Errorbars represent the standard error of the mean. The blue dashed lines indicate the differences between the anodal and sham groups. The lines and asterisks at the top/bottom of the plots indicate statistically significant differences between the anodal and sham groups using the two-sample t-test. Multiple comparisons were corrected using FDR. B. The transitions across the two CAPs (CAP 1 and CAP 2) and the non-CAP (CAP 0, i.e., baseline). Transitions are bi-directional, for example, (0,1) indicates the switch from CAP 0 to CAP 1, while (1,0) indicates the switch from CAP 1 to CAP 0. (0,0), (1,1), and (2,2) indicate unswitched transitions (i.e., stay in the same CAP in the next frame). The matrices show the changes of transition probabilities between the pre-tDCS session on day 1 and each of the following seven fMRI sessions. Compared to the sham group, the anodal tDCS significantly reduced the transition probability of the bi-directional switch between CAP 0 and CAP 1. Asterisks indicate p<0.05 for two-sample t-test and corrected for multiple comparisons using FDR.
3.4. Cathodal tDCS perturb the lOFC CAPs dynamics
Using cathodal tDCS, we aimed to enhance neuronal activations in the lOFC (Fig. 5A). The left panel of Fig. 5A shows the difference in occurrence rate between the pre-tDCS session on day 1 (i.e., the baseline) and each of the following seven fMRI sessions. Compared to sham tDCS, cathodal tDCS significantly increased the occurrence of the first CAP and decreased the occurrence rate of the second CAP in the early tDCS session, then remained at significantly elevated/decreased level in the following sessions (two-sample t-test between the (cathodalearly/late/post-cathodalpre) and (shamearly/late/post-shampre); p values were corrected for multiple comparisons using FDR across 7 comparisons in day 1 and day 3 for each CAP). Fig. 5B shows the changes of transition probabilities across the two CAPs and one non-CAP, between the pre-tDCS session on day 1 and each of the following seven fMRI sessions. We observed that cathodal tDCS significantly decreased the transition probabilities of the bi-directional switches between CAP 2 and baseline (two-sample t-test between the (cathodalearly/late/post-cathodalpre) and (shamearly/late/post-shampre); p values were corrected for multiple comparisons accounted for all 63 possible switches in the matrix using FDR). Similar to anodal tDCS, cathodal tDCS did not have significant effects on the transitions between CAP 1 and CAP 2. Using a different threshold (20%) to select critical time points, we observed consistent and similar findings for the lOFC CAPs and tDCS-perturbed brain dynamics (Figure S13).
Fig. 5. Cathodal tDCS perturbs the lOFC CAPs dynamics.

A. Cathodal tDCS in three consecutive days significantly increased the occurrence rate of CAP 1 and decreased the occurrence rate of CAP 2. The blue dashed lines indicate the differences between the cathodal and sham groups. Errorbars represent the standard error of the mean. The lines and asterisks at the top/bottom of the plots indicate statistically significant differences between the cathodal and sham groups using the two-sample t-test. Multiple comparisons were corrected using FDR. B. Compared to the sham group, cathodal tDCS significantly decreased the transition probabilities of the bi-directional switches between CAP 2 and CAP 0. Asterisks indicate p<0.05 for two-sample t-test and corrected for multiple comparisons using FDR.
4. Discussion
The human brain is never truly at rest but instead engaged in constant intrinsic and condition-dependent dynamics even while not performing an explicit task. These whole-brain dynamics can be characterized by reoccurring brain states with different occurrence frequencies and transition probabilities (Deco et al., 2019; Kringelbach and Deco, 2020). In this study, we tested the feasibility of using repeated tDCS to perturb dynamic brain states in healthy participants. We found that anodal tDCS at the rDLPFC could significantly modulate the occurrence rates of the two different and reoccurring rDLPFC CAPs, and perturb the transitions between these CAPs and the non-CAP state (i.e., when the rDLPFC is not activated during the fMRI scan). Similarly, cathodal tDCS significantly modulated the occurrence rates of the two different and reoccurring lOFC CAPs, and perturbed the transitions between the lOFC CAPs and the non-CAP state. In contrast, sham tDCS did not have any significant effects on the occurrence rates and transition probabilities of the CAPs. These findings provide the first experimental evidence that direct electrical stimulation-induced neural excitability could modulate brain dynamics and transitions of brain states represented by fMRI CAPs.
In the past decade, studies using resting-state fMRI have challenged the conventional assumption that fMRI brain activity is static throughout an entire scan. Using different time-resolved fMRI methods, studies have revealed the dynamic and time-varying nature of resting-state brain activity and found that the fMRI brain dynamics could be represented by a series of connectomic or spatial patterns (Bolton et al., 2020a; Lurie et al., 2020; Preti et al., 2017). Those brain patterns are inter-switchable in specific orders, representing reoccurring brain states (Ma and Zhang, 2018). The temporal dynamics of brain states could be modulated by psychological states (e.g., negative emotion) (Gaviria et al., 2019), physiological states (e.g., wakefulness) (Damaraju et al., 2020; Patanaik et al., 2018), and pathological states (e.g., brain disorders) (Fu et al., 2018; Kim et al., 2017; Tu et al., 2020, 2019a). Therefore, developing approaches to modulate brain dynamics could interfere with these physiological processes and more importantly has the potential to advance treatments for pathological conditions.
Several previous studies have combined brain stimulation (e.g., transcranial magnetic stimulation, [TMS]) and electroencephalography (EEG) to investigate the perturbation-elicited changes in brain activity. These studies demonstrated stimulation-induced brain-wide spatiotemporal propagation may be helpful for assessing consciousness and treating patients in minimally conscious state (Casali et al., 2013; Ferrarelli et al., 2010). In addition, TMS was able to create transitions between the EEG-based DMN and dorsal attention network (DAN), which were associated with individual cognitive abilities (Ozdemir et al., 2020). A very recent study used whole-brain modeling and a unique fMRI dataset of human sleep to show the possibility of forcing transitions between different fMRI brain states using direct electrical stimulation (Deco et al., 2019). Our study used multiple sessions of concurrent tDCS-fMRI data as well as fMRI data before and after tDCS to provide direct evidence of perturbing fMRI brain dynamics with external stimulation. We have found that active tDCS could not only modulate the occurrence rates of brain states but also their transition probabilities, which is consistent with the conclusion of the aforementioned modeling study (Deco et al., 2019).
Among different approaches to fMRI time-resolving methods, we chose the CAP analysis because compared to other tools it yields patterns of whole-brain activity and focuses on the interactions with a seed region of interest by retaining only the timepoints when it exceeds a threshold of activity (Liu and Duyn, 2013). Since tDCS targets a specific region to either enhance or inhibit neuronal excitability, CAP analysis could therefore demonstrate the whole-brain co-activation patterns with the stimulated region. For example, using the rDLPFC as a seed, we identified two CAPs that had relatively close occurrence rates before tDCS applications. These two CAPs had different spatial patterns (i.e., the first CAP showed co-activation in ACC, while the second CAP showed co-activation in insula, PoCG, and SMA, as well as co-deactivation in the DMN) and were associated with different meta-analytical topic maps (e.g., the first CAP had a strong negative association with execution while the second CAP had a strong positive association with execution). During and after anodal tDCS, the occurrence rate of the first CAP was decreased by up to 15% while the occurrence rate of the second CAP was proportionally increased. By simultaneously decreasing the occurrence rate of execution-negative CAP and increasing the occurrence rate of execution-positive CAP, we would expect that anodal tDCS at the rDLPFC may enhance participants’ executive function, which has been shown previously in multiple studies in both healthy and patients population (Doruk et al., 2014; Imburgio and Orr, 2018; Sarkis et al., 2014). In a very recent study, the occurrence rates of CAPs (i.e., the co-activations in insula, DLPFC, DMN, and ACC; a similar spatial pattern to the rDLPFC CAP 2 in the present study) were found to be decreased in autism patients (Marshall et al., 2020). Therefore, it is possible that using anodal tDCS to increase the occurrence rate of CAP 2 may be helpful for patients with autism.
Developments in tDCS have extended interest from observing neural responses to mechanistic manipulation (Chase et al., 2020; Polanía et al., 2018), but the underlying neural mechanisms of tDCS remain unclear. Applying tDCS to enhance behaviors is still in a ‘black box’, which heavily limits the potential of tDCS in clinical applications. Interestingly, although we used 20 min continuous stimulation and repeated tDCS over three consecutive days, the effects were significant for both anodal and cathodal tDCS in the first 6 min of the stimulation (i.e., tDCS-early fMRI session on day 1) timepoint and remained significant and stable in the following sessions (perhaps due to the floor and ceiling effect (Polanía et al., 2018)). These results suggest that fMRI brain dynamics are very sensitive to external stimulation and have residual effects even after stimulation is halted. Importantly, since we used sham tDCS as a control, the common confounders when estimating fMRI brain dynamics (e.g., vigilance, head motion) could be largely controlled (Lurie et al., 2020).
There are several limitations in the present study. First, we did not record fMRI data in the second tDCS session (i.e., day 2). It is unknown whether the effects on fMRI brain dynamics were consistent in this session. Second, although we observed that fMRI brain dynamics were very sensitive to tDCS, it is still unknown when the effects would eventually be extinguished.
In conclusion, we used active and sham tDCS to test the feasibility of perturbing fMRI brain dynamics with non-invasive brain stimulation. Our findings provide the first experimental evidence that active but not sham stimulation could modulate both the occurrences and transitions of brain dynamics represented by the fMRI CAPs. Given the relevance of fMRI brain dynamics in psychological, physiological, and pathological states, this may open new possibilities for discovering stimulation targets and dynamic connectivity patterns that can ensure the propagation of tDCS-induced neuronal excitability in both healthy and patient populations.
Supplementary Material
Acknowledgment
This project is supported by R01 AT008563 from NIH/NCCIH.
Footnotes
Declaration of Competing Interests
JAC is a scientific advisor for Apex Neuroscience. J.K has a disclosure to report (holding equity in a startup company (MNT) and a patent to develop new peripheral neuromodulation tool), but declare no conflict of interest. All other authors declare no conflict of interest.
Supplementary materials
Supplementary material associated with this article can be found, in the online version, at doi:10.1016/j.neuroimage.2021.118100.
Data and code availability
fMRI data can be requested from the corresponding author. The spatial maps of CAPs will be deposited to Neurovault (https://neurovault.org/). Matlab codes for analyzing CAPs are available in the TbCAPs toolbox (https://c4science.ch/source/CAP_Toolbox/).
References
- Amatachaya A, Auvichayapat N, Patjanasoontorn N, Suphakunpinyo C, Ngernyam N, Aree-Uea B, Keeratitanont K, Auvichayapat P, 2014. Effect of anodal transcranial direct current stimulation on autism: a randomized double-blind crossover trial. Behav. Neurol 2014, 173073. doi: 10.1155/2014/173073. [DOI] [PMC free article] [PubMed] [Google Scholar]
- Antal A, Alekseichuk I, Bikson M, Brockmöller J, Brunoni AR, Chen R, Cohen LG, Dowthwaite G, Ellrich J, Flöel A, Fregni F, George MS, Hamilton R, Haueisen J, Herrmann CS, Hummel FC, Lefaucheur JP, Liebetanz D, Loo CK, McCaig CD, Miniussi C, Miranda PC, Moliadze V, Nitsche MA, Nowak R, Padberg F, Pascual-Leone A, Poppendieck W, Priori A, Rossi S, Rossini PM, Rothwell J, Rueger MA, Ruffini G, Schellhorn K, Siebner HR, Ugawa Y, Wexler A, Ziemann U, Hallett M, Paulus W, 2017. Low intensity transcranial electric stimulation: safety, ethical, legal regulatory and application guidelines. Clin. Neurophysiol doi: 10.1016/j.clinph.2017.06.001. [DOI] [PMC free article] [PubMed] [Google Scholar]
- Biswal B, Zerrin Yetkin F, Haughton VM, Hyde JS, 1995. Functional connectivity in the motor cortex of resting human brain using echo-planar mri. Magn. Reson. Med 34, 537–541. doi: 10.1002/mrm.1910340409. [DOI] [PubMed] [Google Scholar]
- Bolton TAW, Morgenroth E, Preti MG, Van De Ville D, 2020a. Tapping into multi-faceted human behavior and psychopathology using fMRI brain dynamics. Trends Neurosci doi: 10.1016/j.tins.2020.06.005. [DOI] [PubMed] [Google Scholar]
- Bolton TAW, Tuleasca C, Wotruba D, Rey G, Dhanis H, Gauthier B, Delavari F, Morgenroth E, Gaviria J, Blondiaux E, Smigielski L, Van De Ville D, 2020b. TbCAPs: a toolbox for co-activation pattern analysis. Neuroimage 211, 116621. doi: 10.1016/j.neuroimage.2020.116621. [DOI] [PubMed] [Google Scholar]
- Broeder S, Nackaerts E, Heremans E, Vervoort G, Meesen R, Verheyden G, Nieuwboer A, 2015. Transcranial direct current stimulation in Parkinson’s disease: neurophysiological mechanisms and behavioral effects. Neurosci. Biobehav. Rev doi: 10.1016/j.neubiorev.2015.08.010. [DOI] [PubMed] [Google Scholar]
- Buckner RL, Sepulcre J, Talukdar T, Krienen FM, Liu H, Hedden T, Andrews-Hanna JR, Sperling RA, Johnson KA, 2009. Cortical hubs revealed by intrinsic functional connectivity: mapping, assessment of stability, and relation to Alzheimer’s disease. J. Neurosci 29, 1860–1873. doi: 10.1523/JNEUROSCI.5062-08.2009. [DOI] [PMC free article] [PubMed] [Google Scholar]
- Casali AG, Gosseries O, Rosanova M, Boly M, Sarasso S, Casali KR, Casarotto S, Bruno MA, Laureys S, Tononi G, Massimini M, 2013. A theoretically based index of consciousness independent of sensory processing and behavior. Sci. Transl. Med doi: 10.1126/scitranslmed.3006294. [DOI] [PubMed] [Google Scholar]
- Chang LJ, Yarkoni T, Khaw MW, Sanfey AG, 2013. Decoding the role of the insula in human cognition: functional parcellation and large-scale reverse inference. Cereb. Cortex 23, 739–749. doi: 10.1093/cercor/bhs065. [DOI] [PMC free article] [PubMed] [Google Scholar]
- Chase HW, Boudewyn MA, Carter CS, Phillips ML, 2020. Transcranial direct current stimulation: a roadmap for research, from mechanism of action to clinical implementation. Mol. Psychiatry doi: 10.1038/s41380-019-0499-9. [DOI] [PMC free article] [PubMed] [Google Scholar]
- Cutini S, Scatturin P, Zorzi M, 2011. A new method based on ICBM152 head surface for probe placement in multichannel fNIRS. Neuroimage 54, 919–927. doi: 10.1016/j.neuroimage.2010.09.030. [DOI] [PubMed] [Google Scholar]
- Damaraju E, Tagliazucchi E, Laufs H, Calhoun VD, 2020. Connectivity dynamics from wakefulness to sleep. Neuroimage 220, 117047. doi: 10.1016/j.neuroimage.2020.117047. [DOI] [PMC free article] [PubMed] [Google Scholar]
- Deco G, Cruzat J, Cabral J, Tagliazucchi E, Laufs H, Logothetis NK, Kringelbach ML, 2019. Awakening: predicting external stimulation to force transitions between different brain states. Proc. Natl. Acad. Sci. U. S. A 116, 18088–18097. doi: 10.1073/pnas.1905534116. [DOI] [PMC free article] [PubMed] [Google Scholar]
- Demirtas-Tatlidede A, Vahabzadeh-Hagh AM, Pascual-Leone A, 2013. Can non-invasive brain stimulation enhance cognition in neuropsychiatric disorders? Neuropharmacology doi: 10.1016/j.neuropharm.2012.06.020. [DOI] [PMC free article] [PubMed] [Google Scholar]
- Doruk D, Gray Z, Bravo GL, Pascual-Leone A, Fregni F, 2014. Effects of tDCS on executive function in Parkinson’s disease. Neurosci. Lett 582, 27–31. doi: 10.1016/j.neulet.2014.08.043. [DOI] [PubMed] [Google Scholar]
- Dosenbach N, Nardos B, Cohen A, Fair D, 2010. Prediction of individual brain maturity using fMRI. Science (80-.) 329, 1358–1361. doi: 10.1126/science.1194144. [DOI] [PMC free article] [PubMed] [Google Scholar]
- Ferrarelli F, Massimini M, Sarasso S, Casali A, Riedner BA, Angelini G, Tononi G, Pearce RA, 2010. Breakdown in cortical effective connectivity during midazolam-induced loss of consciousness. Proc. Natl. Acad. Sci. U. S. A 107, 2681–2686. doi: 10.1073/pnas.0913008107. [DOI] [PMC free article] [PubMed] [Google Scholar]
- Ferrucci R, Mameli F, Guidi I, Mrakic-Sposta S, Vergari M, Marceglia S, Cogiamanian F, Barbieri S, Scarpini E, Priori A, 2008. Transcranial direct current stimulation improves recognition memory in Alzheimer disease. Neurology 71, 493–498. doi: 10.1212/01.wnl.0000317060.43722.a3. [DOI] [PubMed] [Google Scholar]
- Filmer HL, Dux PE, Mattingley JB, 2014. Applications of transcranial direct current stimulation for understanding brain function. Trends Neurosci. 37, 742–753. doi: 10.1016/j.tins.2014.08.003. [DOI] [PubMed] [Google Scholar]
- Finn ES, Shen X, Scheinost D, Rosenberg MD, Huang J, Chun MM, Papademetris X, Constable RT, 2015. Functional connectome fingerprinting: identifying individuals using patterns of brain connectivity. Nat. Neurosci 18, 1664–1671. doi: 10.1038/nn.4135. [DOI] [PMC free article] [PubMed] [Google Scholar]
- Fregni F, Freedman S, Pascual-Leone A, 2007. Recent advances in the treatment of chronic pain with non-invasive brain stimulation techniques. Lancet Neurol. doi: 10.1016/S1474-4422(07)70032–7. [DOI] [PubMed] [Google Scholar]
- Fu Z, Caprihan A, Chen J, Du Y, Adair JC, Sui J, Rosenberg GA, Calhoun VD, 2019. Altered static and dynamic functional network connectivity in Alzheimer’s disease and subcortical ischemic vascular disease: shared and specific brain connectivity abnormalities. Hum. Brain Mapp 40, 3203–3221. doi: 10.1002/hbm.24591. [DOI] [PMC free article] [PubMed] [Google Scholar]
- Fu Z, Tu Y, Di X, Du Y, Sui J, Biswal BB, Zhang Z, de Lacy N, Calhoun VD, 2018. Transient increased thalamic-sensory connectivity and decreased whole-brain dynamism in autism. Neuroimage 190, 1910204. doi: 10.1016/J.NEUROIMAGE.2018.06.003. [DOI] [PMC free article] [PubMed] [Google Scholar]
- Gaviria J, Rey G, Bolton T, Delgado J, Van de Ville D, Vuilleumier P, 2019. Brain functional connectivity dynamics in the aftermaths of affective and cognitive events. bioRxiv 685396. 10.1101/685396 [DOI] [PMC free article] [PubMed] [Google Scholar]
- Hindriks R, Adhikari MH, Murayama Y, Ganzetti M, Mantini D, Logothetis NK, Deco G, 2016. Can sliding-window correlations reveal dynamic functional connectivity in resting-state fMRI? Neuroimage 127, 242–256. doi: 10.1016/j.neuroimage.2015.11.055. [DOI] [PMC free article] [PubMed] [Google Scholar]
- Hutchison RM, Womelsdorf T, Allen EA, Bandettini PA, Calhoun VD, Corbetta M, Della Penna S, Duyn JH, Glover GH, Gonzalez-Castillo J, Handwerker DA, Keilholz S, Kiviniemi V, Leopold DA, de Pasquale F, Sporns O, Walter M, Chang C, 2013. Dynamic functional connectivity: promise, issues, and interpretations. Neuroimage 80, 360–378. doi: 10.1016/j.neuroimage.2013.05.079. [DOI] [PMC free article] [PubMed] [Google Scholar]
- Imburgio MJ, Orr JM, 2018. Effects of prefrontal tDCS on executive function: methodological considerations revealed by meta-analysis. Neuropsychologia 117, 156–166. doi: 10.1016/j.neuropsychologia.2018.04.022. [DOI] [PubMed] [Google Scholar]
- Keeser D, Meindl T, Bor J, Palm U, Pogarell O, Mulert C, Brunelin J, Möller HJ, Reiser M, Padberg F, 2011. Prefrontal transcranial direct current stimulation changes connectivity of resting-state networks during fMRI. J. Neurosci 31, 15284–15293. doi: 10.1523/JNEUROSCI.0542-11.2011. [DOI] [PMC free article] [PubMed] [Google Scholar]
- Kim J, Criaud M, Cho SS, Díez-Cirarda M, Mihaescu A, Coakeley S, Ghadery C, Valli M, Jacobs MF, Houle S, Strafella AP, 2017. Abnormal intrinsic brain functional network dynamics in Parkinson’s disease. Brain 140, 2955–2967. doi: 10.1093/brain/awx233. [DOI] [PMC free article] [PubMed] [Google Scholar]
- Kringelbach ML, Deco G, 2020. Brain states and transitions: insights from computational neuroscience. Cell Rep. doi: 10.1016/j.celrep.2020.108128. [DOI] [PubMed] [Google Scholar]
- Liu X, Duyn JH, 2013. Time-varying functional network information extracted from brief instances of spontaneous brain activity. Proc. Natl. Acad. Sci. U. S. A 110, 4392–4397. doi: 10.1073/pnas.1216856110. [DOI] [PMC free article] [PubMed] [Google Scholar]
- Liu X, Zhang N, Chang C, Duyn JH, 2018. Co-activation patterns in resting-state fMRI signals. Neuroimage doi: 10.1016/j.neuroimage.2018.01.041. [DOI] [PMC free article] [PubMed] [Google Scholar]
- Logothetis NK, Pauls J, Augath M, Trinath T, Oeltermann A, 2001. Neurophysiological investigation of the basis of the fMRI signal. Nature 412, 150–157. doi: 10.1038/35084005. [DOI] [PubMed] [Google Scholar]
- Loo CK, Alonzo A, Martin D, Mitchell PB, Galvez V, Sachdev P, 2012. Transcranial direct current stimulation for depression: 3-Week, randomised, sham-controlled trial. Br. J. Psychiatry 200, 52–59. doi: 10.1192/bjp.bp.111.097634. [DOI] [PubMed] [Google Scholar]
- Lurie DJ, Kessler D, Bassett DS, Betzel RF, Breakspear M, Kheilholz S, Kucyi A, Liégeois R, Lindquist MA, McIntosh AR, Poldrack RA, Shine JM, Thompson WH, Bielczyk NZ, Douw L, Kraft D, Miller RL, Muthuraman M, Pasquini L, Razi A, Vidaurre D, Xie H, Calhoun VD, 2020. Questions and controversies in the study of time-varying functional connectivity in resting fMRI. Netw. Neurosci 4, 30–69. doi: 10.1162/netn_a_00116. [DOI] [PMC free article] [PubMed] [Google Scholar]
- Ma Z, Zhang N, 2018. Temporal transitions of spontaneous brain activity in awake rats. Elife 7, e33562. doi: 10.1101/166512. [DOI] [PMC free article] [PubMed] [Google Scholar]
- Marshall E, Nomi JS, Dirks B, Romero C, Kupis L, Chang C, Uddin LQ, 2020. Co-activation pattern analysis reveals altered salience network dynamics in children with autism spectrum disorder. Netw. Neurosci 1–31. doi: 10.1162/netn_a_00163. [DOI] [PMC free article] [PubMed] [Google Scholar]
- Miranda PC, Lomarev M, Hallett M, 2006. Modeling the current distribution during transcranial direct current stimulation. Clin. Neurophysiol 117, 1623–1629. doi: 10.1016/j.clinph.2006.04.009. [DOI] [PubMed] [Google Scholar]
- Okamoto M, Dan H, Sakamoto K, Takeo K, Shimizu K, Kohno S, Oda I, Isobe S, Suzuki T, Kohyama K, Dan I, 2004. Three-dimensional probabilistic anatomical cranio-cerebral correlation via the international 10–20 system oriented for transcranial functional brain mapping. Neuroimage 21, 99–111. doi: 10.1016/j.neuroimage.2003.08.026. [DOI] [PubMed] [Google Scholar]
- Ozdemir RA, Tadayon E, Boucher P, Momi D, Karakhanyan KA, Fox MD, Halko MA, Pascual-Leone A, Shafi MM, Santarnecchi E, 2020. Individualized perturbation of the human connectome reveals reproducible biomarkers of network dynamics relevant to cognition. Proc. Natl. Acad. Sci. U. S. A 117, 8115–8125. doi: 10.1073/pnas.1911240117. [DOI] [PMC free article] [PubMed] [Google Scholar]
- Palm U, Reisinger E, Keeser D, Kuo MF, Pogarell O, Leicht G, Mulert C, Nitsche MA, Padberg F, 2013. Evaluation of sham transcranial direct current stimulation for randomized, placebo-controlled clinical trials. Brain Stimul. 6, 690–695. doi: 10.1016/j.brs.2013.01.005. [DOI] [PubMed] [Google Scholar]
- Patanaik A, Tandi J, Ong JL, Wang C, Zhou J, Chee MWL, 2018. Dynamic functional connectivity and its behavioral correlates beyond vigilance. Neuroimage 177, 1–10. doi: 10.1016/j.neuroimage.2018.04.049. [DOI] [PubMed] [Google Scholar]
- Polanía R, Nitsche MA, Ruff CC, 2018. Studying and modifying brain function with non-invasive brain stimulation. Nat. Neurosci doi: 10.1038/s41593-017-0054-4. [DOI] [PubMed] [Google Scholar]
- Preti MG, Bolton TA, Van De Ville D, 2017. The dynamic functional connectome: state-of-the-art and perspectives. Neuroimage 160, 41–54. doi: 10.1016/j.neuroimage.2016.12.061. [DOI] [PubMed] [Google Scholar]
- Sarkis RA, Kaur N, Camprodon JA, 2014. Transcranial direct current stimulation (tDCS): modulation of executive function in health and disease. Curr. Behav. Neurosci. Rep 1, 74–85. doi: 10.1007/s40473-014-0009-y. [DOI] [Google Scholar]
- Tu Y, Fu Z, Mao C, Falahpour M, Gollub RL, Park J, Wilson G, Napadow V, Gerber J, Chan ST, Edwards RR, Kaptchuk TJ, Liu T, Calhoun V, Rosen B, Kong J, 2020. Distinct thalamocortical network dynamics are associated with the pathophysiology of chronic low back pain. Nat. Commun 11, 1–12. doi: 10.1038/s41467-020-17788-z. [DOI] [PMC free article] [PubMed] [Google Scholar]
- Tu Y, Fu Z, Zeng F, Maleki N, Lan L, Li Z, Park J, Wilson G, Gao Y, Liu M, Calhoun V, Liang F, Kong J, 2019a. Abnormal thalamo-cortical network dynamics in migraine. Neurology 92, e2706–e2716. doi: 10.1212/WNL.0000000000007607. [DOI] [PMC free article] [PubMed] [Google Scholar]
- Tu Y, Wilson G, Camprodon J, Dougherty D, Vangel M, Benedetti F, Kaptchuk T, Gollub R, Kong J, 2021. Manipulating placebo analgesia and nocebo hyperalgesia by changing brain excitability. Proc Natl Acad Sci U S A. 118 (19). doi: 10.1073/pnas.2101273118, e2101273118. [DOI] [PMC free article] [PubMed] [Google Scholar]
- Tu Y, Zhang B, Cao J, Wilson G, Zhang Z, Kong J, 2019b. Identifying inter-individual differences in pain threshold using brain connectome: a test-retest reproducible study. Neuroimage 202, 116049. doi: 10.1016/J.NEUROIMAGE.2019.116049. [DOI] [PMC free article] [PubMed] [Google Scholar]
- Wörsching J, Padberg F, Helbich K, Hasan A, Koch L, Goerigk S, Stoecklein S, ErtlWagner B, Keeser D, 2017. Test-retest reliability of prefrontal transcranial Direct Current Stimulation (tDCS) effects on functional MRI connectivity in healthy subjects. Neuroimage 155, 187–201. doi: 10.1016/j.neuroimage.2017.04.052. [DOI] [PubMed] [Google Scholar]
- Zalesky A, Fornito A, Cocchi L, Gollo LL, Breakspear M, 2014. Time-resolved resting-state brain networks. Proc. Natl. Acad. Sci. U. S. A 111, 10341–10346. doi: 10.1073/pnas.1400181111. [DOI] [PMC free article] [PubMed] [Google Scholar]
- Zoller DM, Bolton TAW, Karahanoglu FI, Eliez S, Schaer M, Van De Ville D, 2019. Robust recovery of temporal overlap between network activity using transient-informed spatio-temporal regression. IEEE Trans. Med. Imaging 38, 291–302. doi: 10.1109/TMI.2018.2863944. [DOI] [PubMed] [Google Scholar]
Associated Data
This section collects any data citations, data availability statements, or supplementary materials included in this article.
Supplementary Materials
Data Availability Statement
fMRI data can be requested from the corresponding author. The spatial maps of CAPs will be deposited to Neurovault (https://neurovault.org/). Matlab codes for analyzing CAPs are available in the TbCAPs toolbox (https://c4science.ch/source/CAP_Toolbox/).