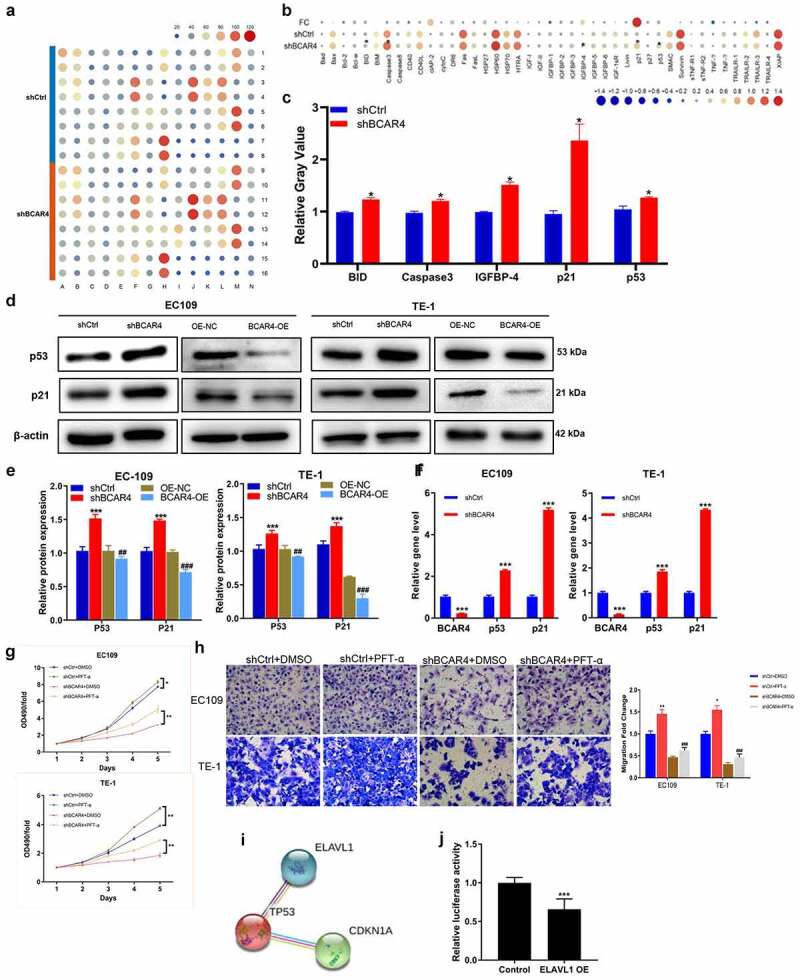
Figure 6.

Exploring the downstream regulatory mechanism of BCAR4. (a) Human apoptosis antibody array was performed to analyze the differential expression of 43 human apoptotic markers in EC109 cells between shBCAR4 and shCtrl groups. (b) The relative protein levels of 43 human apoptotic markers in EC109 cells between shBCAR4 and shCtrl groups. FC, fold change. (c) 5 differential expression proteins in EC109 cells between shBCAR4 and shCtrl groups. (|FC|>20%, p < 0.05). (d) Western Blotting results showed protein expression in EC109 and TE-1 cells, infected with shBCAR4 or shCtrl. (e) Intensities of protein bands standardized to those of β-actin and expressed as relative band intensities. n = 3, *p < 0.05, **p < 0.01, ***p < 0.01. (f) The PCR results showed that indicated gene expression in EC109 and TE-1 cells, infected with shBCAR4 or shCtrl. n = 3, ***p < 0.01. (g) Growth curve analysis showed cell growth of EC109 and TE-1 cells infected with shBCAR4 or shCtrl, and treated with PFT-a or not. Cells were pretreated by 10 mmol/L PFT-α (a p53 inhibitor dissolved in DMSO) for 2 hours. n = 3, *p < 0.05, **p < 0.01. (h) Transwell assays showed cell migration of EC109 and TE-1 cells infected with shBCAR4 or shCtrl, and treated with PFT-a or not. Cells were pretreated by 10 mmol/L PFT-α (a p53 inhibitor dissolved in DMSO) for 2 hours. n = 3, *p < 0.05, **p < 0.01, compared with shCtrl+ DMSO groups; ###p < 0.001, compared with shBCAR4+ DMSO groups. (i) Using the STRING program to analyze potential interaction between ELAVL1 and the p53 (also known as TP53). (j) A dual luciferase assay was performed to determine the effect of ELAVL1 overexpression on transcriptional activity of TP53 in EC109 cells
