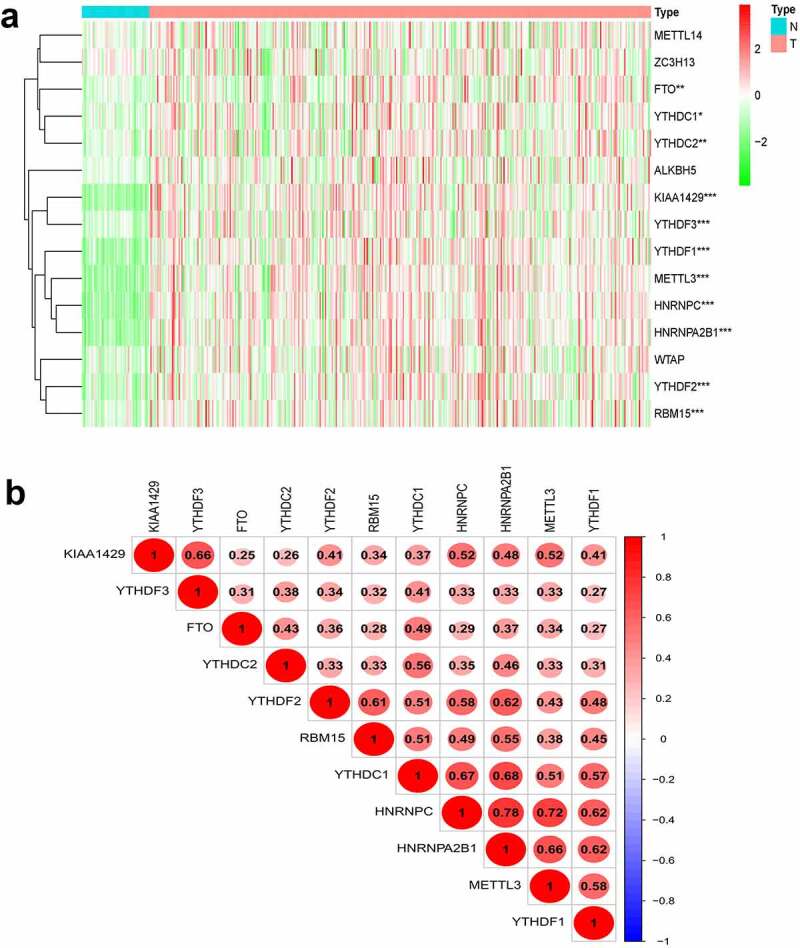
Figure 1.

Expression, correlation, and prognostic information of m6A methylation-related genes. (a) Heatmaps of m6A methylation-related genes expressed in tumors and adjacent normal tissue. (***P < 0.001, ** P < 0.01, *P < 0.05) (b) Correlation matrix of interaction in m6A methylation-related genes. Correlation coefficients are plotted with negative correlation (blue) and positive correlation (red).
