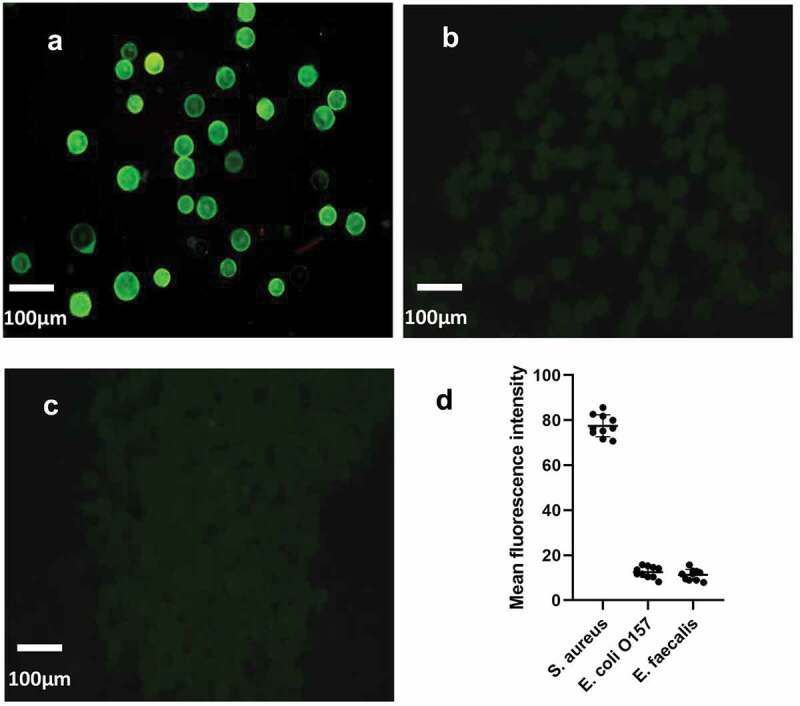
Figure 5.

The specificity verification of microfluidic chip. The fluorescence intensity of the control group was compared with that of the experimental group. (a) was fluorescent-staining results of S. aureus, (b) was fluorescent-staining results of Escherichia coli O157: H7, (c) was fluorescent-staining results of Enterococcus faecalis. (d) The average fluorescence density of the three kinds of bacteria
