

Abstract
Dietary reconstruction in vertebrates often relies on dental wear-based proxies. Although these proxies are widely applied, the contributions of physical and mechanical processes leading to meso- and microwear are still unclear. We tested their correlation using sheep (Ovis aries, n = 39) fed diets of varying abrasiveness for 17 months as a model. Volumetric crown tissue loss, mesowear change and dental microwear texture analysis (DMTA) were all applied to the same teeth. We hereby correlate: (i) 46 DMTA parameters with each other, for the maxillary molars (M1, M2, M3), and the second mandibular molar (m2); (ii) 10 mesowear variables to each other and to DMTA for M1, M2, M3 and m2; and (iii) volumetric crown tissue loss to mesowear and DMTA for M2. As expected, many DMTA parameters correlated strongly with each other, supporting the application of reduced parameter sets in future studies. Correlation results showed only few DMTA parameters correlated with volumetric tissue change and even less so with mesowear variables, with no correlation between mesowear and volumetric tissue change. These findings caution against interpreting DMTA and mesowear patterns in terms of actual tissue removal until these dental wear processes can be better understood at microscopic and macroscopic levels.
Keywords: feeding experiment, mesowear, absolute wear, microwear, diet reconstruction
1. Introduction
The study of tooth wear is subject to a specific conceptual challenge. By definition, tooth ‘wear’ is a loss of material over time, but knowledge on the exact mechanism of this tissue loss is still limited. Yet, measures typically used to represent tooth ‘wear’, such as ‘microwear’ or ‘mesowear’, are descriptions of static lesions or shapes that are not based on measurements of change over time. On a macroscopic level, wear rates are calculated by compiling measures of tooth height in specimens of different ages for various populations [1, pp. 8–13, 2]. Alternatively, in a less quantitative way, an individual's tooth wear stage—and thus its age—can be estimated by comparing its occlusal surface to a logical sequence of wear stages collected for the same species, often represented schematically [3–6]. Mesowear is a proxy recording tooth morphology on the macroscopic level, using the cusp's shape and occlusal relief as a proxy for wear [7,8]. Microwear and three-dimensional dental microwear texture analysis (DMTA) record tooth shape at the microscopic scale [9,10]. The former does so by counting scratches and pits observed on the occlusal surface of the tooth [11], and the latter using the microscopic three-dimensional topography of the tooth's enamel wear facets [10,12–14]. These proxies are interpreted as indicators of diet abrasiveness (cf. table 1).
Table 1.
Description of tooth wear proxy parameters applied in the present study. DMTA parameters in bold represent those chosen for the reduced parameter set. Graphical representations from Schulz et al. [15], Wang et al. [16], Kaiser et al. [17] and Martisius et al. [18].
| abbreviation | description (condition) | functional group | unit | schematic graphic representation low–high value |
|---|---|---|---|---|
| DMTA | ||||
| Sda | closed dale area | area | µm2 |  |
| Sha | closed hill area | area | µm2 |  |
| mea | mean area | area | µm2 | |
| Sdr | developed interfacial area ratio | complexity | % | |
| nMotif | number of motifs | complexity | no unit | |
| Asfc | area-scale functional complexity | complexity | no unit | |
| Sal | auto-correlation length (s = 0.2) | density | µm |  |
| Spd | density of peaks | density | µm−2 |  |
| medf | mean density of furrows | density | cm cm−2 |  |
| Std | texture direction | direction | no unit | |
| Str | texture aspect ratio (s = 0.2) | direction | no unit | |
| Tr1R | first direction | direction | no unit | |
| Tr2R | second direction | direction | no unit | |
| Tr3R | third direction | direction | no unit | |
| IsT | texture isotropy | direction | % |  |
| epLsar | anisotropy | direction | no unit | |
| S10z | ten-point height | height | µm | |
| S5p | five-point peak height | height | µm | |
| S5v | five-point valley height | height | µm |  |
| Sa | arithmetic mean height or mean surface roughness | height | µm |  |
| Sku | kurtosis of the height distribution | height | no unit | |
| Sp | maximum peak height, height between highest peak and mean plane | height | µm |  |
| Sq | standard deviation of the height distribution, or RMS surface roughness | height | µm |  |
| Ssk | skewness of the height distribution | height | no unit |  |
| Sv | maximum pit height, depth between the mean plane and the deepest valley | height | µm | |
| Sxp | peak extreme height difference between p = 50% and q = 97.5% | height | µm |  |
| Sz | maximum height, height between the highest peak and the deepest valley | height | µm | |
| meh | mean height | height | µm | |
| madf | maximum depth of furrows | height | µm | |
| metf | mean depth of furrows | height | µm |  |
| FLTt | peak to valley flatness deviation of the surface (Gaussian Filter, 0.025 mm) | height | µm |  |
| FLTp | peak to reference flatness deviation (Gaussian Filter, 0.025 mm) | height | µm | |
| FLTv | reference to valley flatness deviation (Gaussian Filter, 0.025 mm) | height | µm |  |
| FLTq | root mean square flatness deviation (Gaussian Filter, 0.025 mm) | height | µm |  |
| Spc | arithmetic mean peak curvature | peak sharpness | µm−1 |  |
| Smc | inverse areal material ratio (p = 10%) | plateau size | µm |  |
| Smr | areal material ratio, bearing area at given height (c = 1 µm under the highest peak) | plateau size | µm | |
| Sdq | root mean square gradient | slope | no unit |  |
| Sdv | closed dale volume | volume | µm3 |  |
| Shv | closed hill volume | volume | µm3 |  |
| Vm | material volume at a given material ratio (p = 10%) | volume | µm3 µm−2 |  |
| Vmp | material volume of the peaks | volume | µm3 µm−2 | |
| Vmc | material volume of the core at given material ratio (p = 10%, q = 80%) | volume | µm3 µm−2 |  |
| Vv | void volume at a given material ratio (p = 10%) | volume | µm3 µm−2 | |
| Vvc | void volume of the core (p = 10%, q = 80%) | volume | µm3 µm−2 |  |
| Vvv | void volume of the valley at a given material ratio (p = 80%) | volume | µm3 µm−2 |  |
| mesowear | ||||
| OR | occlusal relief is classified as high or low, depending on how high the cusps rise above the valley between them; specific cut-off proportions (of valley depth and length) may vary according to the scoring scheme used | no unit |  |
|
| CS | cusp shape (the shape of the tip of the cusp) includes three attributes: sharp, round and blunt, according to the degree of facet development; depending on the scoring scheme used, intermediate stages are possible | no unit |  |
|
| CSA | cusp shape, anterior cusp | no unit | ||
| CSP | cusp shape, posterior cusp | no unit | ||
| Sharpest | sharpest cusp score: using the mesowear score for only the sharpest of the two cusps | no unit | ||
| Ordinal | ordinal mesowear score: combined score of occlusal relief and cusp shape | no unit | ||
| Ordiff | OR difference score: the difference between the ordinal score of the first and last timepoints | no unit | ||
| CSAdiff | CSA difference score: the difference between the cusp shape score for the anterior cusp of the first and last timepoints | no unit | ||
| CSPdiff | CSP difference score: the difference between the cusp shape score for the posterior cusp of the first and last timepoints | no unit | ||
| OrdDiff | ordinal difference score: the difference between the ordinal score of the first and last timepoints | no unit | ||
| absolute wear | ||||
| CrownDiff | difference in crown volume between the first and last measurement | mm3 | ||
| RootDiff | difference in root volume between the first and last measurement | mm3 | ||
Regardless of whether macroscopic descriptions of wear are performed in descriptive or quantitative terms, the concept of change over time may be implicit because the tooth's native state is typically present in the mind of the investigator as either unworn tooth height measurements or occlusal surface descriptions (e.g. [5]). With regard to microwear and DMTA, the native, unworn tooth is the implicit default state; nevertheless, the unworn surface does not need to be completely smooth, it can be morphologically structured due to its composition (enamel crystallite orientation, Hunter–Schreger bands, dentine tubuli, protein matrices) [19,20]. At microscopic levels, changes occur within days or weeks [21], and whether traces represent tissue loss or tissue deformation is still debated [22]. New formation of microscopic wear traces occurs perpetually [23]. The exact cause and the duration of the process leading to the mesowear signal are still under debate [24]. A major assumption of the mesowear method is that its signal is not affected by individual age in a relevant way, at least within a certain range of ages [25] or macroscopic wear stages [5,26]. However, it also assumes that differences in mesowear can reflect changes between diets occurring over unknown periods of time. In microwear, DMTA and mesowear, the process of wear is inferred by quantifying variations of ‘static’ surface shapes; ‘static’ because the shapes are typically only quantified once, not repeatedly over the course of ongoing wear.
The proxies associated with tooth wear are typically performed as single measurements on individual teeth because repeated measurements during the lifetime of an individual are logistically challenging [27–31] or impossible when the species of interest exist only as fossils. Applying a single-measurement methodology as a proxy for a time-dependent process is potentially problematic. In theory, teeth that share a similar morphology could have different rates of change for macroscopic shape or microscopic traces, in that one tooth may take longer to acquire a certain shape than another tooth. One tooth might also acquire a new shape or trace after the overwriting of a different pattern, whereas the other may have the same pattern overwrite itself repeatedly. Thus, single measurements invariably tell an incomplete story.
Using macro- or microscopic tooth morphology to derive dietary characteristics is acceptable if a shape or trace is empirically linked to a specific diet. However, because of the timeframe and logistical difficulties involved, few studies have investigated this link, which typically involves a narrative of effect, with a certain diet leading to the formation of a certain morphology (cf. detailed citations in the next paragraph). Although the narrative is often logical, we should endeavour to understand how change occurs, rather than focusing on morphology alone. Experiments with consistent diets and of a duration adjusted to the model species can contribute to our understanding of how different levels of morphology relate to each other when used as wear proxies. For example, when assessing teeth at a single time point with an unknown dietary history, it is generally assumed that microscopic and macroscopic wear proxies need not necessarily provide the same wear signal because they represent diet effects at different levels of time resolution [8,32,33]. In long-term experiments with consistent diets, however, such a discrepancy should be excluded, so that in theory, different wear proxies would be expected to yield the same dietary signal.
In experimental approaches, specifically manufactured diets have been shown to trigger the formation of different wear morphologies, in particular microscopic wear traces [15,23,30,31,34–39]. By contrast, triggering different wear rates and different mesowear patterns has been more complicated. In rabbits, indicators of absolute wear, mesowear and dental microwear texture showed some correlations that one might expect between tooth height (a proxy for absolute tissue loss in ever-growing teeth), mesowear cusp shape, and microwear texture height and volume parameters, responding to more abrasive wear [35]. In a similar study on guinea pigs [34], tooth height and dentine basin depth correlated negatively, suggesting a sequence of dentine erosion followed by ablation of the surrounding enamel as a wear process. Correlations between different measurements might be easier to detect in ever-growing teeth of model rodents or lagomorphs, as the phenomenon in question was not observed in African buffalo (Syncerus caffer), where no diet correspondence was found when comparing tooth height and dental basin depth [40]. In goats, experimental diets triggered dental microwear texture spanning the range observed across free-ranging browsing and grazing ruminants [41], and crown volume changed according to expectations (when results were assessed statistically by bootstrapping) [42]. However, the different diets did not trigger any relevant difference in mesowear in these goats [30], and none of the expected correlations appeared between dental microwear texture and crown volume change, or mesowear change based on the current understanding of wear occurrence [41]. In theory, for animals kept on a consistent diet for a sufficient period of time, one would expect a microwear texture signal indicating increased dietary abrasiveness (e.g. a high Sda or high volume parameters; cf. table 1) to be related to a mesowear signal indicating increased dietary abrasiveness (e.g. blunter tooth cusps) and to a macrowear signal indicating increased abrasion (i.e. a decrease in crown volume). The alternative option—no association of the different proxies—would necessitate a different cause-and-effect explanation than diet abrasiveness. One possible reason for the discrepancy between the findings to date, with regard to small mammals showing the expected patterns but goats not showing them, could be that the time frame used in the goat experiment was, at roughly half a year, still too short for mesowear changes to occur in hypsodont teeth.
In a longer experiment in sheep (Ovis aries), different external abrasives mixed into pelleted food triggered the formation of different microscopic textures [29]. However, the different abrasive diets triggered no systematic differences in crown volume loss between groups [43]. Mesowear changes, although occurring in the expected direction, were of magnitudes too small to be relevant as a diet proxy [29]. In the present contribution, we systematically assessed the correlations between these different wear proxies within the same sheep experiment, with the following aims: (i) comparing DMTA parameters among each other; (ii) comparing a reduced set of DMTA parameters with static tooth morphology using mesowear; and (iii) comparing a reduced set of DMTA parameters with measures recording change over time, including mesowear change, and crown volume change. If certain DMTA patterns do indeed represent processes of tissue loss, we would expect them to correlate with change measurements. By contrast, if no such correlation is found, the narratives explaining DMTA measures in terms of tissue loss, as well as the time duration of both proxy systems need to be critically re-evaluated.
2. Material and methods
The dataset of measures performed on sheep teeth used for this experiment were the same as in Ackermans et al. [29] for mesowear, Ackermans et al. [24] for DMTA and Ackermans et al. [43] for volumetric changes in crown and roots (for full dataset, see electronic supplementary material; original CT scans are available on MorphoSource https://www.morphosource.org/projects/000356020?locale=en). The animal experiments were performed with approval of the Swiss Cantonal Animal Care and Use Committee Zurich (animal experiment license no. 10/2016). Forty-nine adult sheep (over 3 years old, all with an erupted third molar) were divided into eight groups, and each were fed pelleted diets (at 1200 g per animal and day) of increasing abrasiveness for 17 months (diets described in detail in Ackermans et al. [44]). A roughage allotment 200 g of lucerne hay (phytolith-free forage) per animal per day was essential to meet physical diet requirements of ruminants. Note that because the diets were designed to be comprised mainly of pellets in this experiment, the provided proportion of whole roughage hay was lower than what would normally be recommended for ruminants.
Computed tomography (CT) scans were performed on each animal at the start, middle and end of the experiment to record mesowear, volume loss and sand concentration in the digestive tract (published in [45]). After the experiment, the animals were humanely euthanized and the skulls were skeletonized and stored in the mammalogy collection at the University of Hamburg (Center of Natural History, Department of Mammalogy and Palaeoanthropology). Over the course of the study, nine animals were euthanized and one died, due to health complications unrelated to the abrasion experiment.
Excluding teeth unsuitable for analysis, n = 37 individuals made up the DMTA dataset. DMTA was applied to the maxillary right M1, M2, and M3, as well as the mandibular right m2, using tooth moulds taken from the skull and observed using a confocal disc scanning microscope at the University of Hamburg, following the procedure outlined by Schulz et al. [13]. The DMTA was quantified by employing two methods: (i) scale-sensitive fractal analysis (SSFA, two parameters) using length-scale and area-scale fractal analyses [46,47] and (ii) three-dimensional surface texture analysis (3DST, 44 parameters) using standardized roughness (ISO 25178) and flatness (ISO 12781) parameters combined with non-standardized methods using motif, furrows, direction and isotropy parameters [13,48]. The analysis was conducted using the MountainsMap premium v. 7.4.8803 software (NanoFocus AG, Oberhausen, Germany; a derivative of Mountains® Analysis software by Digital Surf, Besançon, France). For each specimen, a target facet on four teeth (m2, M1, M2, M3) was analysed, using the posterior facet of the anterior cusp on the second enamel band from the buccal side when possible, for the right maxillary M1, M2 and M3. If the previous facet was damaged or too worn, the same facet on the fourth enamel band was used. Alternatively, left teeth were measured in the individual when both facets were unsuitable for analysis. For the mandibular m2, the antagonist facet to the M2 was selected, being the anterior facet of the posterior cusp on the fourth enamel band from the buccal side (see fig. 1 in [24]), using the second enamel band if the fourth was measured on the antagonist M2. Four non-overlapping scans of 160 × 160 µm were rendered per facet. Unsuitable scans were discarded and for the remaining scans (minimum 3), a median for each DMTA parameter was calculated. In addition, to assess intra-facet variability, we repeated correlation analyses four times (see electronic supplementary material, S2), using only a single DMTA scan per facet, to demonstrate how facet choice might influence results.
Mesowear scores were calculated on the skulls at the end of the experiment and on resin casts of the teeth and three-dimensional reconstructions of the skulls from CT scans at multiple timepoints during the study. CT scan data and three-dimensional renderings were used as described in Ackermans et al. [29], and the extended mesowear method was applied based on that described in Taylor et al. [49], adapted from Fortelius & Solounias [8] and Winkler & Kaiser [50]. In total, n = 39 animals were suitable for mesowear application, excluding damaged cusps. The change in mesowear scores was calculated by subtracting the scores of the final timepoint from those of the initial timepoint. All mesowear scoring was performed blinded to diet groups by the same investigator (N.L.A.).
Absolute wear was scored on the maxillary right M2, on a dataset of 31 individuals. CT parameters were kept constant throughout the experiment, using a tube voltage of 120 kVp, an image matrix of 512 × 512 pixels (X and Y pixel spacing 0.376953 mm, Z pixel spacing 0.6 mm), a field of view of 980 × 332 pixels, a slice thickness of 0.6 mm and a B60 s convolution kernel. Crown and root volume measurements were made at the beginning and the end of the experiment, separating the tooth on a horizontal plane at the bottom margin of the infundibulum (see fig. 1 and detailed methodology in [43]). Semiautomatic sectioning was used in Amira 5.6 (Mercury Computer Systems/3D Viz group, San Diego, CA, USA) to obtain each volume. Note that the unit of volume is cubic millimetres (mm3), and not, as in the uncorrected versions of the previous publications [42,43], cubic micrometres (µm3).
Not all measures of DMTA, mesowear and macrowear were available in all individuals and in total, when excluding any individuals lacking one of the three measurements, the inter-proxy comparison dataset for the maxillary right M2 comprised n = 25 individuals.
When building the correlation matrices, parameters selected for comparison were as follows. Correlations included the full spectrum of 46 DMTA parameters applied to teeth in our previous studies, as well as a reduced spectrum of nine parameters. For the reduced spectrum, one parameter per functional DMTA group was used: Asfc for complexity, epLsar for direction, Sq for height, Spc for peak sharpness, Smc for plateau size, Sdq for slope, Vm for volume, mea for area and medf for density. From the mesowear dataset we used: OR (occlusal relief), CSA (cusp shape, anterior cusp), CSP (cusp shape, posterior cusp), Sharpest (using the mesowear score for only the sharpest of the two cusps), Ordinal (using the ordinal mesowear score, i.e. combined score of occlusal relief and cusp shape); all these measures are considered ‘static’ as they were applied to the teeth at the end of the experiment, i.e. representing a single time point. To quantify (non-static) mesowear changes in the individual sheep, we used ORdiff (the difference between the occlusal relief of the first and last timepoints), CSAdiff (the difference between the cusp shape scores for the anterior cusp of the first and last timepoints), CSPdiff (the difference between the cusp shape scores for the posterior cusp of the first and last timepoints) and OrdDiff (the difference between the ordinal scores for the first and last timepoints). From the absolute wear dataset we used: CrownDiff (difference in crown volume between the first and last measurements in mm3) and RootDiff (difference in root volume between the first and last measurements in mm3). For a definition of all applied parameters, see table 1. Correlations were applied within and between proxies, i.e. DMTA parameters compared to each other, DMTA parameters compared to mesowear or absolute wear parameters, and mesowear compared to absolute wear parameters.
Data were analysed in R (v. 4.0.3) [51]. These data typically form non-normal distributions, which was confirmed by the Shapiro–Wilk test using the shapiro.test() function. Therefore, non-parametric (Spearman's) correlations were assessed using the cor.test() function. Correlation matrices were then created using the cor() function, and visualized using the corrplot() [52] and ggpubr() [53] packages. Teeth were analysed individually, creating a dataset for M1, M2, M3 and m2 (in all of which both DMTA and mesowear were measured). However, M2 was the only tooth for which data existed for mesowear, absolute wear and DMTA. The significance level was set to 0.05. The R code is provided as electronic supplementary material, S3.
3. Results
Correlations between each parameter on each tooth are represented as matrices in figure 1, using both the extended and reduced DMTA parameter sets. M2 was used as the tooth of reference, being the only tooth where all three proxies were applied.
Figure 1.

Correlation matrix of all DMTA parameters applied to sheep molars (O. aries, n = 25) after a long-term feeding experiment on consistent diets (avoiding a discrepancy of wear proxies due to different time resolution). Correlations of the full DMTA parameter set were plotted as matrices for the maxillary right first molar M1 (a), the maxillary right second molar M2 (b), the maxillary right third molar M3 (c) and the mandibular right second molar m2 (d). DMTA parameters are sorted by functional group. Red coloration indicates a negative correlation whereas blue coloration indicates a positive correlation. The larger and darker the points in the matrix, the closer the correlation is to 1 or −1. For a full description of each parameter, see table 1. Note the general stability of correlations across teeth.
3.1. Correlations within functional groups of dental microwear texture analysis parameters
Area: Sda and Sha correlate to each other, but not with mea (figure 1).
Complexity: Sdr and Asfc strongly correlate with each other, but not with nMotif.
Density: no correlations between parameters.
Direction: Std correlates with Str and Tr1. Tr1 correlates with IsT and epLsar in opposite directions, and Str correlates with IsT.
Height: all parameters correlate with each other except Sa, Sq and meh. FLTv shows very strong correlations with FLTq, FLTt and FLTp.
Plateau size: Smc highly correlates to Smr.
Volume: most volume parameters highly correlate with each other.
3.2. Correlations between functional groups of dental microwear texture analysis parameters
Area: mea strongly correlates with most height parameters (figure 1).
Complexity: Sdr and Asfc strongly correlate with most height parameters.
Height: meh very strongly negatively correlates with nMotif (complexity) and Spd (density). Sxp correlates with Vv, Vvv, Vvc and Vmc (volume parameters), and Smc (plateau size).
Peak curvature: Spc highly correlates with most height parameters.
Plateau size: Smc highly correlates with most height parameters.
Slope: Sdq highly correlates with most height parameters, as well as to Sdr and Asfc (complexity parameters).
Volume: most volume parameters highly correlate with most height parameters.
All parameters have at least one correlation across all four teeth; however, Tr3, Ist, epLsar and Shv show no correlation in M1, M2 and M3. Sdv shows no correlation in M1 and M2, and Tr2 shows no correlation in m2.
3.3. Correlation between mesowear measures
As ‘Ordinal’ is calculated from a combination of the OR and CS scores, they all correlate. OR also correlates with CSA and CSP (figure 2).
Figure 2.

Correlation matrix of dental wear parameters applied to sheep molars (O. aries, n = 25) after a long-term feeding experiment on consistent diets (avoiding a discrepancy of wear proxies due to different time resolution). Correlations of the reduced DMTA parameter set (one measure per functional DMTA group, from area to volume), mesowear scores (static scores for the end of the experiment; occlusal relief OR and cusp shape CS scores, for the anterior and posterior or the sharpest cusp, for the ordinal mesowear score; and the difference in mesowear scores between the start and the end of the experiment); and differences in crown and root volume between the start and the end of the experiment, plotted as matrices for the maxillary right first molar M1 (a), the maxillary right second molar M2 (b), the maxillary right third molar M3 (c) and the mandibular right second molar m2 (d). Crown and root volume differences were only measured in M2 (CrownDiff and RootDiff). DMTA parameters are sorted by functional group. Red coloration indicates a negative correlation, whereas blue coloration indicates a positive correlation. The larger and darker the points in the matrix, the closer the correlation is to 1 or −1. For a full description of each parameter, see table 1. Note the general stability of correlations across teeth, and the paucity of correlations between DMTA parameters and measurements of change of a tooth over time. For r values, see electronic supplementary material, S1.
3.4. Correlation between dental microwear texture analysis parameters and ‘static’ mesowear
OR shows a positive correlation with Sq (height), Smc (plateau size; figure 3a) and Vm (volume) (figure 2). When expanding to the full DMTA parameter set, OR also shows a strong negative correlation with Sku (height). Neither CSA nor ‘sharpest’ show any significant correlations, even when using the expanded DMTA parameter set. CSP, however, shows a positive correlation with Asfc (complexity), Sq (height), Spc (peak sharpness), Smc (plateau size; figure 3b) and Sdq (slope). The ‘Ordinal’ score shows a similar pattern of correlations.
Figure 3.
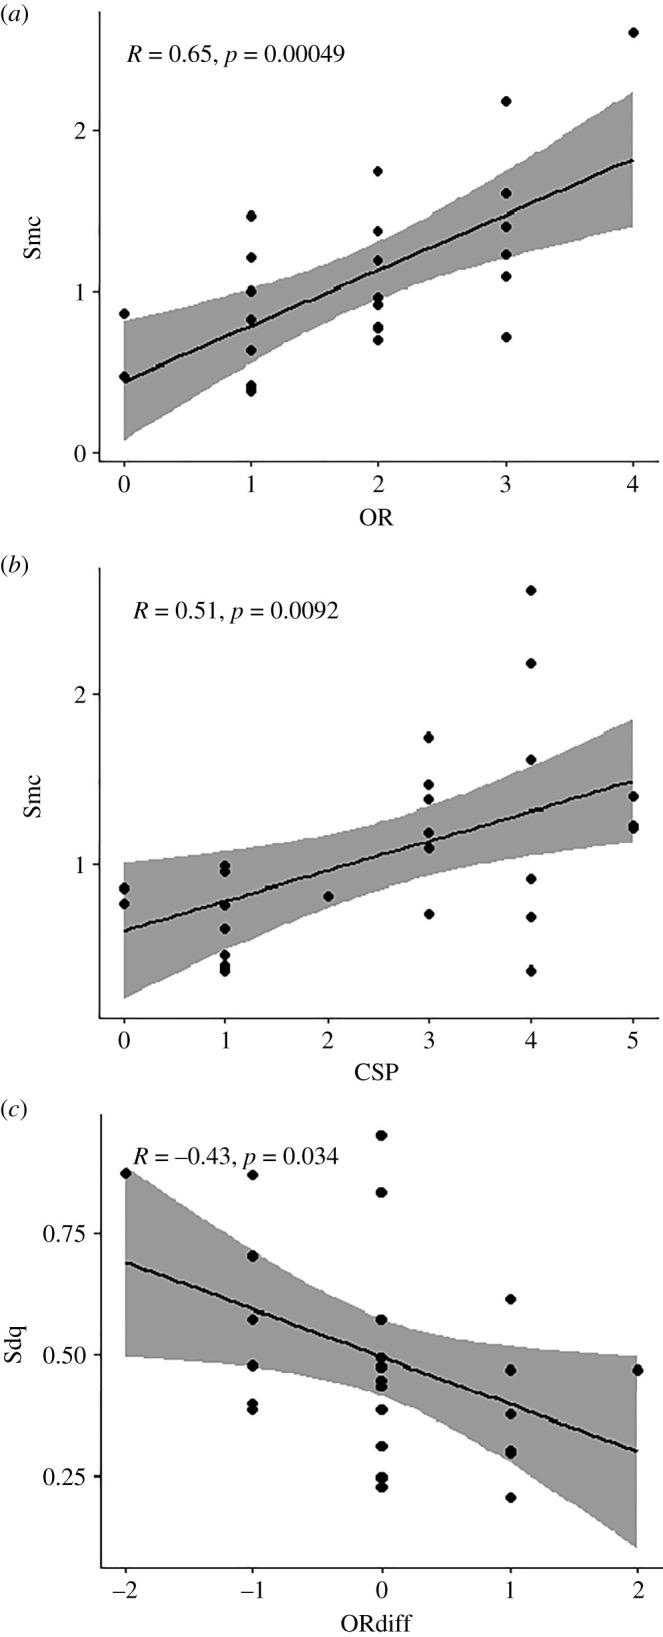
Scatterplots representing correlations between mesowear and dental microwear texture parameters in the maxillary right second molar of sheep (O. aries, n = 25) after a long-term feeding experiment. Dental microtexture parameters: Smc, plateau size; Sdq, slope. Mesowear parameters: OR, occlusal relief; ORdiff, difference in OR scores between the first and last timepoints of the experiment; CSP, cusp shape of the posterior cusp. For a full description of each parameter, see table 1.
3.5. Correlations between dental microwear texture analysis parameters and mesowear change measures
Using the reduced set of DMTA parameters (figure 2), the difference in occlusal relief over time (ORdiff) negatively correlates to Sq (height), Smc (plateau size) and Sdq (slope; figure 3c). The difference in anterior cusp shape over time (CSAdiff) correlates with Sda (area), Spd (density) and Sdv (volume), while the same measure for posterior cusp shape (CSPdiff) shows no correlations. The same correlations apply to the expanded set of DMTA parameters, with ORdiff negatively correlating to Sdr (complexity), S5v, Sa, Sv, Sxp, matf, metf (height parameters), and Vmc, Vv, Vvv (volume parameters). CSAdiff correlates positively to no parameters other than Sda, while CSPdiff shows no correlations.
3.6. Correlations between volume change measures
The difference in crown volume (CrownDiff) positively correlates to the difference in root volume (RootDiff), as highlighted in our previous work (figure 2) [43]. There are no correlations between mesowear and volume change measures.
3.7. Correlations between dental microwear texture analysis parameters and volume change measures
Using the reduced set of DMTA parameters, the difference in crown volume (CrownDiff) correlates positively to mea (area; figure 4a), Asfc (complexity; figure 4b), epLsar (direction), Spc (peak sharpness; figure 4c) and Sdq (slope; figure 4d) (figure 2). When using the expanded set of DMTA parameters, CrownDiff correlates positively to Sdr (complexity), S10z, S5v, Sv, matf and metf (height parameters), and negatively to Sda (area), Tr1 (direction) and meh (height). RootDiff correlates positively to epLsar (direction), and negatively to Tr1 and Tr2 (direction parameters).
Figure 4.

Scatterplots representing correlations between crown tissue loss (CrownDiff) and dental microwear texture parameters in the maxillary right second molar of sheep (O. aries, n = 25) after a long-term feeding experiment. Dental microtexture parameters: mea, area; Asfc, complexity; Spc, peak sharpness; Sdq, slope. CrownDiff (mm3) is the difference in tooth crown volume between the first and last timepoints of the experiment. For a full description of each parameter, see table 1.
3.8. Inter-scan variability
When applying DMTA separately for each facet scan on a single tooth, rather than applying it as the median of all scans of a tooth, these patterns did not change noticeably (see electronic supplementary material, S2).
4. Discussion
The present study allows the simultaneous evaluation of wear measured at three different scales and at different locations on the tooth's morphology: absolute tissue loss in terms of crown volume change, mesowear changes and the dental microwear texture of a facet at the end of the period during which these changes occurred. These proxies are generally considered to represent wear at different time scales [10,54]. For example, one abrasive particle of 50 µm in diameter may leave a trace on a facet in terms of microwear texture (micrometric scale) during a single chewing cycle, but it will be insufficient to cause a change in cusp shape (millimetric scale). However, feeding consistent diets for a period of 17 months should have ensured that all wear proxies represent a response to the same dietary properties.
Because of this, the low correlation of the proxies measured within the same experimental setting is surprising. Studies applying both microscopic wear and mesowear proxies assume that they are both representative of the diet, if only on a different timescale and resolution, and hence necessarily functionally related. The timescale for mesowear to form may be underestimated, as a lifelong zoo diet had a distinct effect on zoo giraffe teeth [55], while 1.5 years of experimental controlled feeding in sheep did not. We find that the link between wear changes at micrometric scale (dental microwear texture) and wear changes at a millimetric scale (mesowear and tissue loss) needs to be studied in more detail to understand the functional and mechanical implications underlying the use of dietary wear proxies. One solution includes the use of chewing machines to observe the macro- and microscopic effect of incremental changes in abrasive size, type and concentrations on teeth, over an artificially accelerated time period [56,57].
4.1. Correlations within wear proxy systems
Patterns within a wear proxy system often correlated with each other in this study. First, many DMTA parameters correlated with each other, especially when compared within functional groups, or when compared with parameters of a different DMTA method that were similar in function (figure 1). This does not come as a surprise, as many DMTA parameters are calculated based on each other, and provide similar or complementary information derived from the same surface scan. This finding also gains plausibility when comparing schematic representations of these parameters (table 1). DMTA correlations were particularly evident for the height and volume parameter groups, suggesting that when trying to reduce dataset complexity, a single DMTA parameter could be used for these larger parameter groups. Similar findings were made in the few other studies on non-dental samples that investigated correlations between DMTA parameters. When characterizing wear on joint cartilage, both Tian et al. [58] and Wang et al. [16] found positive correlations within, and between, height, volume, plateau size, slope, peak sharpness and complexity parameters. Another study characterizing a technical burnished steel surface [59] found very few correlations between DMTA parameters, even among the different height parameters. Whether correlation differences are due to the nature of the surfaces investigated, or to methodological variability, requires additional research. Within the same enamel surface system of the present study, while using consistent methodology, the correlations among DMTA parameters were very similar, even in separate teeth (figure 1).
Most studies employing DMTA for dietary reconstruction do not report correlations between DMTA proxies but acknowledge them indirectly. For example, data of grazing and browsing ungulates show very similar patterns for height (Sa, Smc, Sq, Sxp) and volume parameters (Vmc, Vv, Vvc) and [60] and Winkler et al. [21,61] reported DMTA parameters according to functional categories, implying correlation of parameters within these categories.
DMTA measures of density and direction rarely correlate with each other or other parameters, neither in the current nor in previous studies. It has been postulated that measures of texture direction reflect chewing direction (Std) [13]; however, this has not been tested further. Thus, we assume that texture and direction parameters are expected to be independent of other DMTA parameters, showing no correlations. In theory, the presence of isotropy (IsT) and anisotropy (epLsar) should be sensitive to abrasive amount in the diet (either phytoliths or external mineral abrasives) and because of this, measures reflecting higher surface roughness (height parameters like Sa and Sq, or volume parameters like Vmc and Vv) that are directly correlated to diet abrasiveness would also be expected to correlate with IsT or epLsar. However, these correlations were almost never observed in our sample. Only for the lower m2 were there several weak correlations between IsT and height/volume parameters (figure 1d). The DMTA parameters for height (Sq), peak sharpness (Spc), inverse areal material ratio (Smc), slope (Sdq) and volume (Vm) were often highly positively correlated with each other, regardless of the dataset. As many of these parameters are calculated based on similar features of a surface or based on each other, it is more likely that they are redundant, at least where tooth wear measurements are concerned. For example, Sq computes the standard deviation for the surface height (amplitude); Smc as inverse areal material ratio gives the height (amplitude) of the mean plane at a given areal material ratio p; and Vm gives the material volume at a specific height based on the material ratio p (=Smc). Measures of density like medf (mean density of furrows) or Spd (mean density of peaks) have been found to have high discriminatory power to resolve feeding preferences, both in mammals [61–63] and lizards [64], but rarely correlate with other well-separating parameters. This is a strong indication for the capacity of isotropy/anisotropy and density parameters to reflect unique features of the enamel surface topography that are not captured by many other DMTA parameters. Therefore, a deeper understanding of the functional significance of these parameters should be one of the main objectives of DMTA research. Interpretations drawn from these parameters can add information on surface topography features beyond the information already gained with height, area and volume parameters.
Mesowear parameters in the current study correlate as described in the mesowear literature [7], in that higher occlusal reliefs are associated with sharper cusps. The ordinal mesowear score is accordingly correlated with the individual mesowear scores for occlusal relief and cusp shape, from which it was calculated. Often, a parallel ranking of occlusal relief and cusp shape is assumed in the mesowear literature, and this perception is implicit in the use of dental ‘rulers’ or templates that combine OR and CS [65,66]. To our knowledge, a large-scale correlation of relief and cusp shape mesowear scores has not been performed thus far. Nevertheless, such an exercise might serve to identify species that deviate from the general pattern. For mesowear, changes in occlusal relief, cusp shape or ordinal score do not show strong correlations. Only the change in occlusal relief and the change in anterior cusp shape are moderately positively correlated. The fact that changes in the ordinal score show no correlation with changes in either occlusal relief or cusp shape, and that changes in occlusal relief do not parallel changes in posterior cusp shape, warn against the assumption that the development of the shape used as mesowear always follows a predictable pattern of parallel changes in relief and cusp shape.
Thirdly, the fact that crown volume loss and root volume gain are positively correlated suggests a wear-compensating mechanism of cementum apposition, as was already demonstrated in the same and similar animals [42,43].
4.2. Correlations between wear proxy systems
Surprisingly, there was no correlation between changes in mesowear score and changes in crown volume. Theoretically, this would lead to the conclusion that the shape changes deemed necessary to alter the mesowear signal may not represent changes in crown tissue volume, at least within the time frame of this study. Yet, at a macroscopic level, a tooth crown cannot be expected to have the degree of plasticity that would be required for a mesowear change to occur by any other way than selective tissue loss. Mesowear has been shown to clearly differentiate between populations—such as wild and zoo populations—strongly suggesting different rates of crown tissue loss prior to mesowear scoring [26,55,67]. In fact, the lack of a concrete demonstration of a change of magnitude for mesowear, relevant for detecting diet changes in individuals [29], remains a major obstacle in deciding whether mesowear constitutes a signal that may vary throughout an individual's life, in different directions and at frequencies that can represent diet changes, or whether it mainly represents a lifetime signal of the average diet. The hypothesis that mesowear may remain constant while crown volume is lost has been made before by Kaiser et al. [33], suggesting that fine dust in particular might abrade teeth without changing their mesowear shape. The experimental findings in the sheep of the present study support this concept, as crown tissue loss is not reflected in mesowear changes.
Correlations between ‘static’ mesowear scores and DMTA parameters (i.e. without a time component) might well suggest an individual variation in tooth quality in the present study population. In previous DMTA studies [60–63], higher Smc, Sq or Sdq values were associated with more abrasive diets. Yet, in the present study, the teeth more susceptible to lower mesowear scores (i.e. experiencing more abrasion) for both occlusal relief and (posterior) cusp shape did not maintain high dental microwear texture plateaus (measured as Smc, figure 3a). Additionally, the weak but negative correlation between Smc and occlusal relief change suggests that teeth unable to sustain high dental microwear texture plateaus are more likely to lose occlusal relief. Given the negative correlations between occlusal relief change and Sq and Sdq in our data (figure 2), a similar scenario can be postulated for these measures. This consideration opens the possibility that differences in some, but not necessarily all, DMTA parameters may sometimes be more indicative of individual tooth quality than a dietary effect. In the future, detailed in vitro studies or measurement of enamel hardness in parallel to DMTA may test this possibility.
Crown volume changes also correlate to few DMTA parameters, although not exactly the same parameters as those correlated to the mesowear parameters (figure 2). Asfc correlates to both absolute wear and single mesowear parameters; however, it does not correlate to mesowear change parameters. Crown volume changes are positively related to changes in peak curvature (Spc) as expected, because higher Spc values indicate more blunted surface-texture peaks, which we consider a consequence of abrasion. Crown volume changes are also positively correlated to mea (area), epLsar (direction) as expected, since a change in crown volume would be expected to correlate with differences in area and wear direction (more abrasion). Crown volume changes correlated in the expected way with Sdq—more crown tissue loss being related to higher Sdq (interpreted as indicative of more abrasion, see above), whereas Sdq correlated, unexpectedly, negatively with mesowear change (see above). This suggests that additional experimental attention is required, especially for the mesowear proxy.
4.3. Limitations of the study
The individual animals used in this study were not of uniform age, weight or breed. This may have introduced variability into the study, as the base state of the teeth was not uniform. However, acquiring such a large number of animals born in the same year and raised under the same conditions was beyond our means. The argument can be made that the variability of our animal sample bears a closer resemblance to fossil assemblages or real-life situations.
Several DMTA studies have documented strong intrafacet variabilities [13,68]. To address how the choice of measurement per facet might influence results, the present study used four non-overlapping scans per facet and the median was calculated and analysed, as was each scan separately. The difference between scans was negligible and did not change the correlation matrices in a significant manner (see electronic supplementary material, S2).
Although measuring crown volumes using medical CTs has resulted in biologically meaningful results, including an indication of compensatory cementum apposition [42,43], the repeatability of CT-based crown volume loss measurements has not been tested so far. Further work in live animals exposed to diets or conditions of different abrasiveness is required to confirm the reliability of this method.
5. Conclusion
Mesowear and dental microwear texture parameters are often applied to a single dataset and used in combination to interpret and reconstruct diets of past specimens in an effort to accumulate the maximum amount of information from often small sample sizes. However, the biomechanical and physiological mechanisms behind mesowear, microwear and dental microwear texture formation are not fully understood. Claims that when mesowear records a browsing signal and microwear a grazing one, this must indicate an animal with a mixed diet, or, as recently discussed, a catastrophic change in diet [69], must remain speculative if we cannot experimentally reproduce congruence of these proxies. Mesowear and DMTA act on vastly different time scales. Our experiment indicates that in non-hypselodont teeth, mesowear likely needs years to establish after a consistent diet change [29], while DMTA patterns change within weeks [21]. Therefore, the correlation between DMTA parameters with fast turnover and mesowear parameters with a yet unknown, but slow turnover, will naturally change depending on the point in time analysed after a diet switch. Moreover, systematic differences in both mesowear and dental microwear texture might not reflect dietary differences, but other (yet unknown) differences such as biomechanics, enamel hardness or morphology, for example. The extent to which these differences occur in study populations has, to our knowledge, not been investigated thus far.
DMTA parameters have been adapted from the materials engineering industries to measure microscopic texture differences that can be also attributed to tooth wear. Currently, in the field of tooth wear, up to 52 parameters are used, of which some are redundant, although only few correlation tests between parameters have been performed [16,58,59] and none of those on teeth. In the present study, we proposed a reduced set of DMTA parameters, using only one parameter per functional category. Our first aim was to simplify the task of microwear texture analysis and in doing so, facilitate its comparison with other proxies. The numerous results of the current study justify this simplification and provide a simpler way to understand, compare and apply these proxies across studies.
Acknowledgements
The sheep tooth wear experiment was part of the AgroVet cooperation between Strickhof Eschikon and the Vetsuisse Faculty of the University of Zurich. We thank Anja Tschudin for support in pelleted diet formulation, and Hanspeter Renfer, Kaspar Luttiger, Robi Sonderegger, Nadja Weber and Janine Hertaeg for support in animal husbandry, as well as Peter Hofer, Lydia Bruckbauer, Claudia di Giovanna and Gianna Ribbers for CT scanning, the students of the Vetsuisse Faculty for support in animal handling, and Adriano Wang and Gian-Luca Steger for support with the dissections. Finally, we thank Frederik Jessen for all his help with resin casting, and Steffen Lessle for the maceration. We thank the two anonymous reviewers for their detailed scrutiny and insightful comments.
Data accessibility
The datasets and code supporting this article have been uploaded as part of the electronic supplementary material. Original CT scans of all sheep skulls are publicly available on MorphoSource https://www.morphosource.org/projects/000356020?locale=en.
Authors' contributions
N.L.A., M.C., L.F.M. and J.-M.H. carried out the original experiment. M.C., J.-M.H. and T.M.K. conceived, designed and coordinated the study. N.L.A. and M.C. drafted the manuscript and N.L.A. carried out the statistical analysis. D.E.W., E.S.-K., T.M.K. and J.-M.H. provided technical interpretation and critically revised the manuscript. All authors gave final approval for publication and agree to be held accountable for the work performed therein.
Competing interests
The authors declare no competing interests.
Funding
This study was part of project 31003A_163300/1 funded by the Swiss National Science Foundation.
References
- 1.Ackermans NL. 2019. Exploring mechanisms of tooth wear in experimentally fed caprids. A validation of proxies used for dietary reconstruction. PhD dissertation, University of Zurich, Zurich, Switzerland. [Google Scholar]
- 2.Damuth J, Janis CM. 2014. A comparison of observed molar wear rates in extant herbivorous mammals. Ann. Zool. Fenn. 51, 188-200. ( 10.5735/086.051.0219) [DOI] [Google Scholar]
- 3.Payne S. 1987. Reference codes for wear states in the mandibular cheek teeth of sheep and goats. J. Archaeol. Sci. 14, 609-614. ( 10.1016/0305-4403(87)90079-3) [DOI] [Google Scholar]
- 4.Grant A. 1982. The use of tooth wear as a guide to the age of domestic ungulates. In Ageing and sexing animal bones from archaeological sites (eds Wilson B), pp. 91-108. Oxford, UK: British Archaeological Reports. [Google Scholar]
- 5.Hohl CJM, Codron D, Kaiser TM, Martin LF, Müller DWH, Hatt J-M, Clauss M. 2020. Chewing, dental morphology and wear in tapirs (Tapirus spp.) and a comparison of free-ranging and captive specimens. PLoS ONE 15, e0234826. ( 10.1371/journal.pone.0234826) [DOI] [PMC free article] [PubMed] [Google Scholar]
- 6.Anders U, von Koenigswald W, Ruf I, Smith BH. 2011. Generalized individual dental age stages for fossil and extant placental mammals. Paläontologische Zeitschrift 85, 321-339. ( 10.1007/s12542-011-0098-9) [DOI] [Google Scholar]
- 7.Ackermans NL. 2020. The history of mesowear: a review. PeerJ 8, e8519. ( 10.7717/peerj.8519) [DOI] [PMC free article] [PubMed] [Google Scholar]
- 8.Fortelius M, Solounias N. 2000. Functional characterization of ungulate molars using the abrasion-attrition wear gradient: a new method for reconstructing paleodiets. Am. Mus. Nov. 3301, 1-36. ( 10.1206/0003-0082(2000)301<0001:FCOUMU>2.0.CO;2) [DOI] [Google Scholar]
- 9.DeSantis LR. 2016. Dental microwear textures: reconstructing diets of fossil mammals. Surf. Topogr. Metrol. Prop. 4, 023002. ( 10.1088/2051-672X/4/2/023002) [DOI] [Google Scholar]
- 10.Schulz-Kornas E, Kaiser TM, Calandra I, Winkler DE. 2020. A brief history of quantitative wear analyses with an appeal for a holistic view on dental wear processes. In Mammalian teeth—form and function (eds Martin T, Koenigswald Wv), pp. 44-53. Munich, Germany: Verlag Dr. Fredrich Pfeil. [Google Scholar]
- 11.Grine FE. 1986. Dental evidence for dietary differences in Australopithecus and Paranthropus: a quantitative analysis of permanent molar microwear. J. Hum. Evol. 15, 783-822. ( 10.1016/S0047-2484(86)80010-0) [DOI] [Google Scholar]
- 12.Schulz E, Calandra I, Kaiser TM. 2013. Feeding ecology and chewing mechanics in hoofed mammals: 3D tribology of enamel wear. Wear 300, 169-179. ( 10.1016/j.wear.2013.01.115) [DOI] [Google Scholar]
- 13.Schulz E, Calandra I, Kaiser TM. 2010. Applying tribology to teeth of hoofed mammals. Scanning 32, 162-182. ( 10.1002/sca.20181) [DOI] [PubMed] [Google Scholar]
- 14.Scott RS, Ungar PS, Bergstrom TS, Brown CA, Grine FE, Teaford MF, Walker A. 2005. Dental microwear texture analysis shows within-species diet variability in fossil hominins. Nature 436, 693-695. ( 10.1038/nature03822) [DOI] [PubMed] [Google Scholar]
- 15.Schulz E, Piotrowski V, Clauss M, Mau M, Merceron G, Kaiser TM. 2013. Dietary abrasiveness is associated with variability of microwear and dental surface texture in rabbits. PLoS ONE 8, e56167. ( 10.1371/journal.pone.0056167) [DOI] [PMC free article] [PubMed] [Google Scholar]
- 16.Wang M, Peng Z, Wang J, Jiang X. 2013. Wear characterisation of articular cartilage surfaces at a nano-scale using atomic force microscopy. Tribol. Int. 63, 235-242. ( 10.1016/j.triboint.2012.11.001) [DOI] [Google Scholar]
- 17.Kaiser TM, Clauss M, Schulz-Kornas E. 2015. A set of hypotheses on tribology of mammalian herbivore teeth. Surf. Topogr. Metrol. Prop. 4, 014003. ( 10.1088/2051-672X/4/1/014003) [DOI] [Google Scholar]
- 18.Martisius NL, Sidéra I, Grote MN, Steele TE, McPherron SP, Schulz-Kornas E. 2018. Time wears on: assessing how bone wears using 3D surface texture analysis. PLoS ONE 13, e0206078. ( 10.1371/journal.pone.0206078) [DOI] [PMC free article] [PubMed] [Google Scholar]
- 19.Fortelius M. 1985. Ungulate cheek teeth: developmental, functional, and evolutionary interrelations. Acta Zool. Fenn. 180, 1-76. [Google Scholar]
- 20.Lucas PW. 2004. Dental functional morphology: how teeth work, illustrated edn. Cambridge, UK: Cambridge University Press. [Google Scholar]
- 21.Winkler DE, Schulz-Kornas E, Kaiser TM, Codron D, Leichliter J, Hummel J, Martin LF, Clauss M, Tütken T. 2020. The turnover of dental microwear texture: testing the’ last supper’ effect in small mammals in a controlled feeding experiment. Palaeogeogr. Palaeoclimatol. Palaeoecol. 557, 109930. ( 10.1016/j.palaeo.2020.109930) [DOI] [Google Scholar]
- 22.Lucas PW, et al. 2013. The role of dust, grit and phytoliths in tooth wear. Ann. Zool. Fenn. 51, 143-152. ( 10.5735/086.051.0215) [DOI] [Google Scholar]
- 23.Teaford MF, Ungar PS, Taylor AB, Ross CF, Vinyard CJ. 2017. In vivo rates of dental microwear formation in laboratory primates fed different food items. Biosurf. Biotribol. 3, 166-173. ( 10.1016/j.bsbt.2017.11.005) [DOI] [Google Scholar]
- 24.Ackermans NL, Winkler DE, Kaiser TM, Clauss M, Hatt J-M. 2020. Dust and grit matter: abrasives of different size lead to opposing dental microwear textures in experimentally fed sheep (Ovis aries). J. Exp. Biol. 223, jeb220442. ( 10.1242/jeb.220442) [DOI] [PubMed] [Google Scholar]
- 25.Rivals F, Mihlbachler MC, Solounias N. 2007. Effect of ontogenetic-age distribution in fossil and modern samples on the interpretation of ungulate paleodiets using the mesowear method. J. Vertebr. Paleontol. 27, 763-767. ( 10.1671/0272-4634(2007)27[763:EOODIF]2.0.CO;2) [DOI] [Google Scholar]
- 26.Kaiser TM, Brasch J, Castell JC, Schulz E, Clauss M. 2009. Tooth wear in captive wild ruminant species differs from that of free-ranging conspecifics. Mamm. Biol. 74, 425-437. ( 10.1016/j.mambio.2008.09.003) [DOI] [Google Scholar]
- 27.Teaford MF, Oyen OJ. 1989. In vivo and in vitro turnover in dental microwear. Am. J. Phys. Anthropol. 80, 447-460. ( 10.1002/ajpa.1330800405) [DOI] [PubMed] [Google Scholar]
- 28.Lieberman DE. 1993. Life history variables preserved in dental cementum microstructure. Science 261, 1162-1164. ( 10.1126/science.8356448) [DOI] [PubMed] [Google Scholar]
- 29.Ackermans NL, Martin LF, Codron D, Hummel J, Kircher PR, Richter H, Clauss M, Hatt J-M. 2020. Mesowear resembles a lifetime signal in a long-term feeding experiment on sheep (Ovis aries). Palaeogeogr. Palaeoclimatol. Palaeoecol. 553, 109793. ( 10.1016/j.palaeo.2020.109793) [DOI] [Google Scholar]
- 30.Ackermans NL, Winkler DE, Schulz-Kornas E, Kaiser TM, Müller DWH, Kircher PR, Hummel J, Clauss M, Hatt J-M. 2018. Controlled feeding experiments with diets of different abrasiveness reveal slow development of mesowear signal in goats (Capra aegagrus hircus). J. Exp. Biol. 221, jeb186411. ( 10.1242/jeb.186411) [DOI] [PubMed] [Google Scholar]
- 31.Merceron G, et al. 2016. Untangling the environmental from the dietary: dust does not matter. Proc. R. Soc. B 283, 20161032. ( 10.1098/rspb.2016.1032) [DOI] [PMC free article] [PubMed] [Google Scholar]
- 32.Danowitz M, Hou S, Mihlbachler M, Hastings V, Solounias N. 2016. A combined-mesowear analysis of late Miocene giraffids from North Chinese and Greek localities of the Pikermian Biome. Palaeogeogr. Palaeoclimatol. Palaeoecol. 449, 194-204. ( 10.1016/j.palaeo.2016.02.026) [DOI] [Google Scholar]
- 33.Kaiser TM, Müller DWH, Fortelius M, Schulz E, Codron D, Clauss M. 2013. Hypsodonty and tooth facet development in relation to diet and habitat in herbivorous ungulates: implications for understanding tooth wear. Mamm. Rev. 43, 34-46. ( 10.1111/j.1365-2907.2011.00203.x) [DOI] [Google Scholar]
- 34.Martin LF, Winkler DE, Tütken T, Codron D, De Cuyper A, Hatt J-M, Clauss M. 2019. The way wear goes—phytolith-based wear on the dentine-enamel system in guinea pigs (Cavia porcellus). Proc. R. Soc. B 286, 20191921. ( 10.1098/rspb.2019.1921) [DOI] [PMC free article] [PubMed] [Google Scholar]
- 35.Martin LF, et al. 2020. Dental wear at macro- and microscopic scale in rabbits fed diets of different abrasiveness: a pilot investigation. Palaeogeogr. Palaeoclimatol. Palaeoecol. 556, 109886. ( 10.1016/j.palaeo.2020.109886) [DOI] [Google Scholar]
- 36.Hoffman JM, Fraser D, Clementz MT. 2015. Controlled feeding trials with ungulates: a new application of in vivo dental molding to assess the abrasive factors of microwear. J. Exp. Biol. 218, 1538-1547. ( 10.1242/jeb.118406) [DOI] [PubMed] [Google Scholar]
- 37.Ramdarshan A, Blondel C, Brunetière N, Francisco A, Gautier D, Surault J, Merceron G. 2016. Seeds, browse, and tooth wear: a sheep perspective. Ecol. Evol. 6, 5559-5569. ( 10.1002/ece3.2241) [DOI] [PMC free article] [PubMed] [Google Scholar]
- 38.Teaford MF, Oyen OJ. 1989. Differences in the rate of molar wear between monkeys raised on different diets. J. Dent. Res. 68, 1513-1518. ( 10.1177/00220345890680110901) [DOI] [PubMed] [Google Scholar]
- 39.Teaford MF, Ungar PS, Taylor AB, Ross CF, Vinyard CJ. 2020. The dental microwear of hard-object feeding in laboratory Sapajus apella and its implications for dental microwear formation. Am. J. Phys. Anthropol. 171, 439-455. ( 10.1002/ajpa.24000) [DOI] [PubMed] [Google Scholar]
- 40.Sanson GD, Kerr S, Read J. 2017. Dietary exogenous and endogenous abrasives and tooth wear in African buffalo. Biosurf. Biotribo. 3, 211-223. ( 10.1016/j.bsbt.2017.12.006) [DOI] [Google Scholar]
- 41.Schulz-Kornas E, et al. 2020. Everything matters: molar microwear texture in goats (Capra aegagrus hircus) fed diets of different abrasiveness. Palaeogeogr. Palaeoclimatol. Palaeoecol. 552, 109783. ( 10.1016/j.palaeo.2020.109783) [DOI] [Google Scholar]
- 42.Ackermans NL, Clauss M, Winkler DE, Schulz-Kornas E, Kaiser TM, Müller DWH, Kircher PR, Hummel J, Hatt JM. 2019. Root growth compensates for molar wear in adult goats (Capra aegagrus hircus). J. Exp. Zool. Part A Ecol. Integr. Physiol. 331, 139-148. ( 10.1002/jez.2248) [DOI] [PubMed] [Google Scholar]
- 43.Ackermans NL, Martin LF, Codron D, Kircher PR, Richter H, Clauss M, Hatt J-M. 2021. Confirmation of a wear-compensation mechanism in dental roots of ruminants. Anat. Rec. 304, 425-436. ( 10.1002/ar.24402) [DOI] [PubMed] [Google Scholar]
- 44.Ackermans NL, Martin LF, Hummel J, Müller DWH, Clauss M, Hatt J-M. 2019. Feeding selectivity for diet abrasiveness in sheep and goats. Small Rumin. Res. 175, 160-164. ( 10.1016/j.smallrumres.2019.05.002) [DOI] [Google Scholar]
- 45.Hatt J-M, Cordon D, Ackermans NL, Martin LF, Richter H, Kircher PR, Gerspach C, Hummel J, Clauss M. 2020. The effect of the rumen washing mechanism in sheep differs with concentrations and size of abrasive particles. Palaeogeogr. Palaeoclimatol. Palaeoecol. 550, 109728. ( 10.1016/j.palaeo.2020.109728) [DOI] [Google Scholar]
- 46.Ungar PS, Brown CA, Bergstrom TS, Walker A. 2003. Quantification of dental microwear by tandem scanning confocal microscopy and scale-sensitive fractal analyses. Scanning J. Scann. Microsc. 25, 185-193. ( 10.1002/sca.4950250405) [DOI] [PubMed] [Google Scholar]
- 47.Scott RS, Ungar PS, Bergstrom TS, Brown CA, Childs BE, Teaford MF, Walker A. 2006. Dental microwear texture analysis: technical considerations. J. Hum. Evol. 51, 339-349. ( 10.1016/j.jhevol.2006.04.006) [DOI] [PubMed] [Google Scholar]
- 48.Calandra I, Schulz E, Pinnow M, Krohn S, Kaiser TM. 2012. Teasing apart the contributions of hard dietary items on 3D dental microtextures in primates. J. Hum. Evol. 63, 85-98. ( 10.1016/j.jhevol.2012.05.001) [DOI] [PubMed] [Google Scholar]
- 49.Taylor LA, Müller DWH, Schwitzer C, Kaiser TM, Castell JC, Clauss M, Schulz-Kornas E. 2016. Comparative analyses of tooth wear in free-ranging and captive wild equids. Equine Vet. J. 48, 240-245. ( 10.1111/evj.12408) [DOI] [PubMed] [Google Scholar]
- 50.Winkler DE, Kaiser TM. 2011. A case study of seasonal, sexual and ontogenetic divergence in the feeding behaviour of the moose (Alces alces, Linné, 1758). Verhandlungen des Naturwissenschaftlichen Vereins Hamburg 46, 331-348. [Google Scholar]
- 51.R Core Team. 2020. R: a language environment for statistical computing (4.0.3 ed). Vienna, Austria: R Foundation for Statistical Computing. [Google Scholar]
- 52.Wei T, Simko V. 2017. R package ‘corrplot’: visualization of a correlation matrix (Version 0.84 ed).
- 53.Kassambara A. 2020. ggpubr: ‘ggplot2’ based publication ready plots (R package version 0.2.5 ed).
- 54.Davis M, Pineda-Munoz S. 2016. The temporal scale of diet and dietary proxies. Ecol. Evol. 6, 1883-1897. ( 10.1002/ece3.2054) [DOI] [PMC free article] [PubMed] [Google Scholar]
- 55.Clauss M, Franz-Odendaal TA, Brasch J, Castell JC, Kaiser T. 2007. Tooth wear in captive giraffes (Giraffa camelopardalis): mesowear analysis classifies free-ranging specimens as browsers but captive ones as grazers. J. Zoo Wildl. Med. 38, 433-445. ( 10.1638/06-032.1) [DOI] [PubMed] [Google Scholar]
- 56.Karme A, Rannikko J, Kallonen A, Clauss M, Fortelius M. 2016. Mechanical modelling of tooth wear. J. R. Soc. Interface 13, 20160399. ( 10.1098/rsif.2016.0399) [DOI] [PMC free article] [PubMed] [Google Scholar]
- 57.Hua LC, Brandt ET, Meullenet JF, Zhou ZR, Ungar PS. 2015. An in vitro study of dental microwear formation using the BITE Master II chewing machine. Am. J. Phys. Anthropol. 158, 769-775. ( 10.1002/ajpa.22823) [DOI] [PubMed] [Google Scholar]
- 58.Tian Y, Wang J, Peng Z, Jiang X. 2012. A new approach to numerical characterisation of wear particle surfaces in three-dimensions for wear study. Wear 282, 59-68. ( 10.1016/j.wear.2012.02.002) [DOI] [Google Scholar]
- 59.Korzynski M, Dudek K, Palczak A, Kruczek B, Kocurek P. 2018. Experimental models and correlations between surface parameters after slide diamond burnishing. Meas. Sci. Rev. 18, 123-129. ( 10.1515/msr-2018-0018) [DOI] [Google Scholar]
- 60.Schulz-Kornas E, Stuhlträger J, Clauss M, Wittig RM, Kupczik K. 2019. Dust affects chewing efficiency and tooth wear in forest dwelling Western chimpanzees (Pan troglodytes verus). Am. J. Phys. Anthropol. 169, 66-77. ( 10.1002/ajpa.23808) [DOI] [PubMed] [Google Scholar]
- 61.Winkler DE, Andrianasolo TH, Andriamandimbiarisoa L, Ganzhorn JU, Rakotondranary SJ, Kaiser TM, Schulz-Kornas E. 2016. Tooth wear patterns in black rats (Rattus rattus) of Madagascar differ more in relation to human impact than to differences in natural habitats. Ecol. Evol. 6, 2205-2215. ( 10.1002/ece3.2048) [DOI] [PMC free article] [PubMed] [Google Scholar]
- 62.Winkler DE, Schulz-Kornas E, Kaiser TM, De Cuyper A, Clauss M, Tütken T. 2019. Forage silica and water content control dental surface texture in guinea pigs and provide implications for dietary reconstruction. Proc. Natl Acad. Sci. USA 116, 1325-1330. ( 10.1073/pnas.1814081116) [DOI] [PMC free article] [PubMed] [Google Scholar]
- 63.Winkler DE, Tütken T, Schulz-Kornas E, Kaiser TM, Müller J, Leichliter J, Weber K, Hatt J-M, Clauss M. 2020. Shape, size, and quantity of ingested external abrasives influence dental microwear texture formation in guinea pigs. Proc. Natl Acad. Sci. USA 117, 22 264-22 273. ( 10.1073/pnas.2008149117) [DOI] [PMC free article] [PubMed] [Google Scholar]
- 64.Winkler DE, Schulz-Kornas E, Kaiser TM, Tütken T. 2019. Dental microwear texture reflects dietary tendencies in extant Lepidosauria despite their limited use of oral food processing. Proc. R. Soc. B 286, 20190544. ( 10.1098/rspb.2019.0544) [DOI] [PMC free article] [PubMed] [Google Scholar]
- 65.Mihlbachler MC, Rivals F, Solounias N, Semprebon GM. 2011. Dietary change and evolution of horses in North America. Science 331, 1178-1181. ( 10.1126/science.1196166) [DOI] [PubMed] [Google Scholar]
- 66.Wolf D, Semprebon GM, Bernor RL. 2012. New observations on the paleodiet of the late Miocene Höwenegg (Hegau, Germany) Hippotherium primigenium (Mammalia, Equidae). Boll. Soc. Paleontol. Ital. 51, 186. [Google Scholar]
- 67.Taylor LA, Müller DWH, Schwitzer C, Kaiser TM, Codron D, Schulz E, Clauss M. 2014. Tooth wear in captive rhinoceroses (Diceros, Rhinoceros, Ceratotherium: Perissodactyla) differs from that of free-ranging conspecics. Contrib. Zool. 83, 107-117. ( 10.1163/18759866-08302002) [DOI] [Google Scholar]
- 68.Ramdarshan A, Blondel C, Gautier D, Surault J, Merceron G. 2017. Overcoming sampling issues in dental tribology: insights from an experimentation on sheep. Palaeontol. Electron. 20, 20.3.53A. ( 10.26879/762) [DOI] [Google Scholar]
- 69.Rivals F, Prilepskaya NE, Belyaev RI, Pervushov EM. 2020. Dramatic change in the diet of a late Pleistocene Elasmotherium population during its last days of life: implications for its catastrophic mortality in the Saratov region of Russia. Palaeogeogr. Palaeoclimatol. Palaeoecol. 556, 109898. ( 10.1016/j.palaeo.2020.109898) [DOI] [Google Scholar]
Associated Data
This section collects any data citations, data availability statements, or supplementary materials included in this article.
Data Availability Statement
The datasets and code supporting this article have been uploaded as part of the electronic supplementary material. Original CT scans of all sheep skulls are publicly available on MorphoSource https://www.morphosource.org/projects/000356020?locale=en.