Abstract
Rodent cages equipped with access to a voluntary running wheel are commonly used to study the effects of aerobic physical activity on physiology and behavior. Notable discoveries in exercise neurobiology, including the key role of brain-derived neurotrophic factor (BDNF) in neural plasticity and cognition, have been made using rodents housed with voluntary running wheels. A major advantage of using home-cage running wheels over treadmills is the elimination of stress potentially associated with forced running. In addition, voluntary wheel running may simulate a more natural running pattern in laboratory mice. Singly housing mice with voluntary running wheels is traditionally employed to obtain exact quantitation of the distance ran; however, social isolation stress is often ignored to obtain precise running distances. Moreover, voluntary exercise studies in adolescent mice must consider the neurodevelopmental implications of isolation stress. In this protocol, we wean 21-day-old mouse pups directly into running wheel-equipped cages and pair-house them to reduce the impact of social isolation and other developmentally specific factors that could adversely affect their behavior or development. Individual running distances are obtained from each mouse in the cage using a radio-frequency identification (RFID) ear tag and a hidden antenna placed directly under the running wheel. We have demonstrated that voluntary running during a specific juvenile-adolescent developmental period can improve hippocampal memory when tested during adolescence ( Ivy et al., 2020 ). Individual exercise tracking of group-housed mice can enable future studies to precisely correlate the amount of exercise with readouts such as cell-specific gene expression, epigenetic mechanisms, serum biomarkers, and behavior, in an intra-individual manner.
Keywords: Group-housing, Exercise, Voluntary wheel running, In-cage mouse tracking, Radio frequency identification (RFID), Enrichment, Juvenile mice
Background
The use of voluntary running wheels in laboratory rodent cages is a common approach for investigating the impact of exercise on brain function and neurodegeneration ( Liu et al., 2019 ). Employing a voluntary exercise study design eliminates the need for a stressful stimulus, such as a foot shock or investigator handling, to encourage the animal to exercise. Studies utilizing in-cage voluntary running wheels have traditionally housed rodents individually to generate accurate running distances and capture individual variations in exercise amounts (Goh and Ladiges, 2015). Individual running data can then be correlated with other intra-individual datasets. For example, total distance run over a 2-6 hour period positively correlates with brain-derived neurotrophic factor (BDNF) gene expression in the hippocampus ( Oliff et al., 1998 ). However, a disadvantage of individual housing is the potential for stress induced by social isolation. Since mice are social animals, their innate social behaviors (whether in wild or captive environments) develop most naturally in social arrangements similar to those found in wild colonies (Reimer and Petras, 1967). The controlled laboratory environments required for accurate data collection frequently result in housing conditions that challenge the formation of natural social structures. The lack of a social environment when mice are individually housed must be considered not only for rodent welfare but also for its impact on the quality of data produced and the interpretation of findings ( Kappel et al., 2017 ; Arakawa, 2018).
Prior research has demonstrated that individual housing of mice can impact brain function in a number of ways. It can alter hypothalamic-pituitary-adrenocortical (HPA) axis function, specifically glucocorticoid regulation and feedback ( Hawkley et al., 2012 ). Individual housing can also confound performance on various behavioral tests, including those assessing anxiety ( Koike et al., 2009 ) and learning and memory ( Okada et al., 2015 ). Finally, single housing can lower the expression of neuroplasticity-related genes in the hippocampus and prefrontal cortex ( Ieraci et al., 2016 ). Social isolation stress in singly housed rodents is therefore an important variable to consider when interpreting studies that assess the neurobiological effects of voluntary exercise.
On the other hand, group housing of mice can invoke male-on-male aggression. This usually emerges in rodents after the onset of puberty and tends not to be present during juvenile and adolescent developmental stages ( Terranova et al., 1998 ). Female mice have a lower tendency to exhibit this aggression, even post-puberty (Hayes, 2000). Social isolation in juvenile rodents adversely impacts myelination in the medial prefrontal cortex ( Makinodan et al., 2012 ), whereas social play in juveniles can enhance neural plasticity in this region ( Himmler et al., 2013 ). Moreover, juvenile mice use the body temperature of their cage mates for thermoregulation ( Batchelder et al., 1983 ). This underscores the importance of paired or grouped housing for maintaining basal body temperature, particularly in the setting of shifting metabolic demands with exercise. Therefore, in studies linking juvenile voluntary wheel running with neural function and behavior, a group housing-based approach may be preferred to eliminate isolation stress.
Individual home-cage rodent tracking has been accomplished through the use of video ( Krynitsky et al., 2020 ) ( Poffe et al., 2018 ) ( Wang et al., 2018 ), subcutaneously implanted RFID microchips ( Peleh et al., 2019 ) ( Frahm et al., 2018 ), a combination of the two, or passive infrared sensors (Matikainen-Ankney, Garmendia- Cedillos et al., 2019 ). Current protocols utilizing subcutaneously implanted RFID microchips require prolonged restraint and anesthesia, which may produce undesired stress and pain. Unified Information Devices details a protocol that describes safely implanting a mouse RFID microchip (UID UC-1485) without anesthesia on postnatal day 12. This approach is used primarily for mouse identification at a single point in time, such as for taking rapid mouse inventory within a group-housed cage, but its use has not been demonstrated for live, continuous tracking. Another factor is the size of the RFID chip, which must be large enough to be detected by the antenna. For juvenile mice, typically weighing 6-9 grams, this size requirement prohibits administration without the use of anesthesia. In video tracking, wire cage tops obstruct continuous top-down video recording but are required for many home-cage running wheel systems. Finally, existing home-cage RFID activity-tracking systems currently on the market use a matrix of RFID antennae arranged throughout the base of the cage or in strategic locations to monitor baseline ambulatory activity (Voikar and Gaburro, 2020). However, if the objective of the experiment is to track voluntary wheel-running, only one antenna with a read range precisely limited to the area inside the wheel is required.
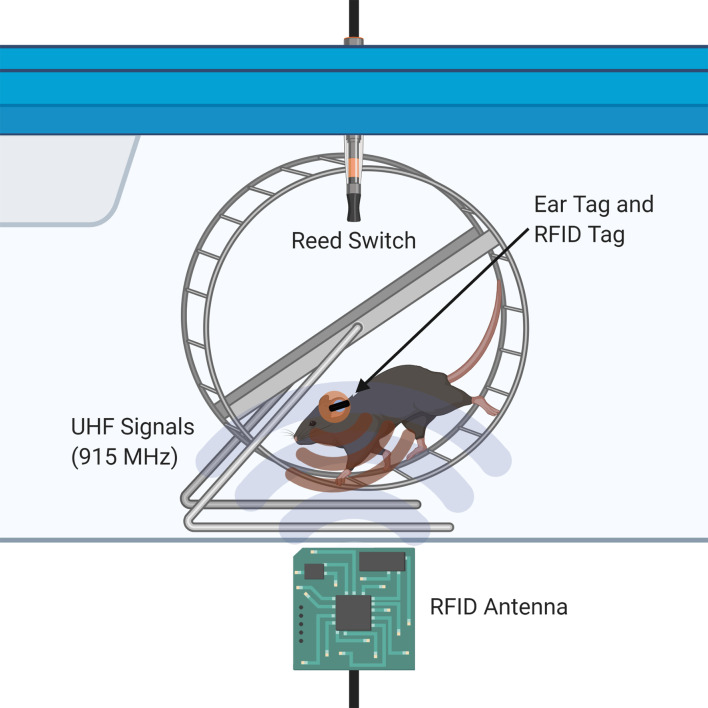
Our apparatus uses strong, low-profile RFID ear tags and one RFID antenna at the base of each cage to present a minimally invasive alternative to existing video-based and implantation-based tracking systems (Figure 1). The major advantage of our protocol is the ability to individually track running wheel activity of pair-housed juvenile mice starting at the age of weaning (postnatal day 21). We reduce isolation stress and issues with thermoregulation by pair-housing the mice and providing nesting material. Indeed, this model can be scaled up to >2 mice per cage if preferred. This procedure has been tested in cages containing mice of the same sex, but we did not investigate mixed-sex population effects on individual running activity. Our experimental design allows for the comparison of individual running distances between female and male pairs of mice within the same cage. Although there may be territorial issues once social hierarchy is established in cages housing two or more male mice, a precise quantity of exercise from each individual mouse in a group-housed cage can be correlated with any desired experimental readout.
Figure 1. Illustration of the dual RFID and Vital View system for individual mouse running in a pair-housed cage.
A minor limitation of this apparatus is that in our hands, about 5-10% of running activity is unable to be reconciled; however, we believe that our 90-95% accuracy of allocating individual running data in group-housed environments is an acceptable yield. Although this method does not encounter the same issues with accuracy-diminishing antenna cross-talk as observed in RFID antenna matrices (Voikar and Gaburro, 2020), the metal wheel in very close proximity to the antenna may have the same interfering effect (thus necessitating a large ear tag). Our design effectively limits the read range of the antenna to the wheel area only.
Investigating the effects of voluntary physical activity has numerous implications for increasing our understanding of its benefits toward brain function and behavior. Determining individualized amounts of exercise for specific outcomes or targets requires accurate monitoring of running distances, which can now be performed as described in this protocol. Our approach can track individual mice by recognizing the unique RFID tags of pair-housed mice coupled with time-stamped data obtained from a magnetic sensor on a home-cage running wheel. Importantly, the procedure can be scaled up to tracking running distances of multiple mice in a cage sharing access to one running wheel. Our method brings RFID applications to juvenile mouse exercise studies, while minimizing stress from isolation and restraint, eliminating the need for anesthesia, and producing highly precise and individualized running data.
Materials and Reagents
UHF RFID Tag for Metal Product Management (Murata Manufacturing, catalog number: LXTBKZMCMG-010)
CommandTM Small Poster Strips (3M, catalog number: 17024ES)
Pegboard, 5/32” thickness, holes spaced 1” apart
LOCTITE® SUPER GLUE PRECISION PEN (Henkel, catalog number: 2066118)
Netting material (Industrial Netting, catalog number: NG3060-164)
Ear Tag, Mouse, Light Blue, 1-100 (Stoelting, catalog number: 56782)
Ear Tag, Backing only, Pk/100 (Stoelting, catalog number: 56792)
Etching Engraver Pen (Porsin, catalog number: LX1323)
Teklad 1/8” Corncob Bedding (Envigo, catalog number: 7092A)
Cotton Nestlets (Ancare nestlets)
-
Animals: Jackson mice WT C57BL/6J (Jackson Laboratories, catalog number: 000664)
Mice were progeny of C57BL/6J dams obtained from Jackson Laboratories, and were bred, born, and reared in our vivarium. Mice had free access to food and water, and the lights were maintained on a 12-hour light/dark cycle. Upon weaning on postnatal day (P) 21, mice were pair-housed in standard cages with free access to an in-cage stainless-steel running wheel equipped with a plastic net fitted around the rim for the safety of the juvenile mice. All mice are typically 6-9 g at the time of weaning. Tracking was conducted continuously 24 hours a day for three weeks from P21 to P41. All experiments were conducted according to U.S. National Institutes of Health guidelines for animal care and use and were approved by the Institutional Animal Care and Use Committee of the University of California, Irvine.
Teklad Global Soy Protein-Free Extruded Rodent Diet (Envigo, catalog number: 2020X)
Equipment
RFID Passive Antenna (Abracon LLC: ARRAN5-915.000MHz)
L-Size Mouse Cage Body, 36.5 × 20.7 × 14.0 cm, Polycarbonate (Tecniplast Group: 1284L001; sourced from Starr Life Sciences)
Autoclavable Filter Top (Tecniplast Group: 1284L-400SU; sourced from Starr Life Sciences)
4.5" Running wheel with reed switch (Bio-Lynx scientific equipment, Inc.: 610-0003-00; sourced from Starr Life Sciences)
MMCX (J)-LL100HF-RPTNC (M) 60'' Cables (Federal Custom Cable, LLC: SCA1086-60)
Ear Tag, Applicator (Stoelting Co: 56791)
Keonn AdvanReader-160 UHF RFID Reader (4-Port) (Keonn Technologies: ADRD-M4-ESMA-160.01)
AdvanMux-8 UHF RFID Multiplexer (8-Port) (Keonn Technologies: ADMX-8-e-110.04)
CAT5 Ethernet Cable
USB 3.0-to-Gigabit Ethernet Adapter (Best Buy Co., Inc., Insignia: NS-PU98635-C)
Power Over Ethernet Injector (Phihong: PSA16U-480(POE); sourced from Keonn Technologies)
SMA Male to SMA Male 24” Cable (Bracke Manufacturing, LLC: BM92046.24)
Data Port 24 channel box (Starr Life Sciences)
Data Port USB Cable (Starr Life Sciences)
Electric Drill
Table Saw
5/32”, 3/16” Drill Bits
-
Two Laptops (one for each software program) with the following requirements:
Minimum Requirements for VitalView®: Windows PC (Windows XP or newer), 2 GHz Processor, 2 GB Ram, 800 MG Free Hard Disk space, USB port
Minimum Requirements AdvanNetTM Software: Firefox or Chrome browser, Internet connection, USB port
-
Computer (for IndividualRFIDELEMus program)
Minimum Requirements: Windows 10, 12 GB of RAM
Software
AdvanNetTM Software (Keonn Technologies, S.L., https://keonn.com/software-product/advannet/)
VitalView® Activity Data Acquisition Software (Starr Life Sciences Corp, https://www.starrlifesciences.com/product/activity-software/)
IndividualRFIDELEMus program (https://github.com/anthonyraus/IndividualRFIDELEMus/releases)
Procedure
-
RFID Antenna Setup (Figure 2)
-
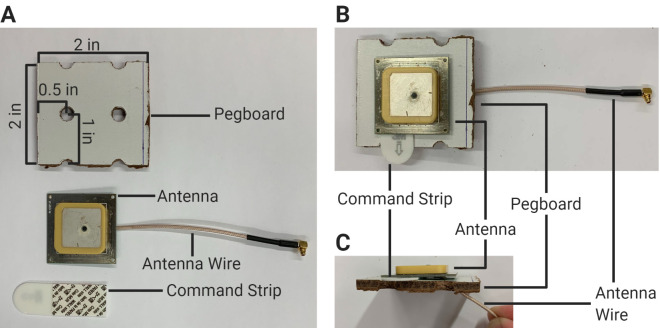
Cut 2” × 2” pegboard squares for each cage with two holes in each square: Take the pegboard and draw lines to make cuts orthogonally such that:
One set of lines runs across every other hole.
-
The other set of lines runs ” between every other hole.
Using a table saw, carefully cut through the lines (Figure 2A).
-
Place the pegboard square white-side-up. Using a drill and a 3/16” drill bit, drill diagonally through one of the holes, such that the angled hole points away from the center of the square (distal end on the bottom). Repeat this process for every square.
Note: The purpose of this step is to make the existing pegboard hole wider for the antenna head to lie flat on the pegboard once the antenna wire is threaded through.
Thread the wire of an antenna through the angled hole of a pegboard square, such that the wire comes out the bottom (brown side). Have the base of the antenna cover both holes as much as possible.
Place a double-sided CommandTM strip on the surface of the pegboard, covering the hole opposite to the hole that the antenna wire is threaded through. Affix the base of the antenna to the top (white side) of the pegboard square to the double-sided CommandTM strip (Figure 2B).
-
-
Cage Setup (Figure 3)
Pre-determine and assign two mice of the same sex to each running cage. Plan to construct RFID-compatible running cages based on the number of mouse pairs used in your study.
-
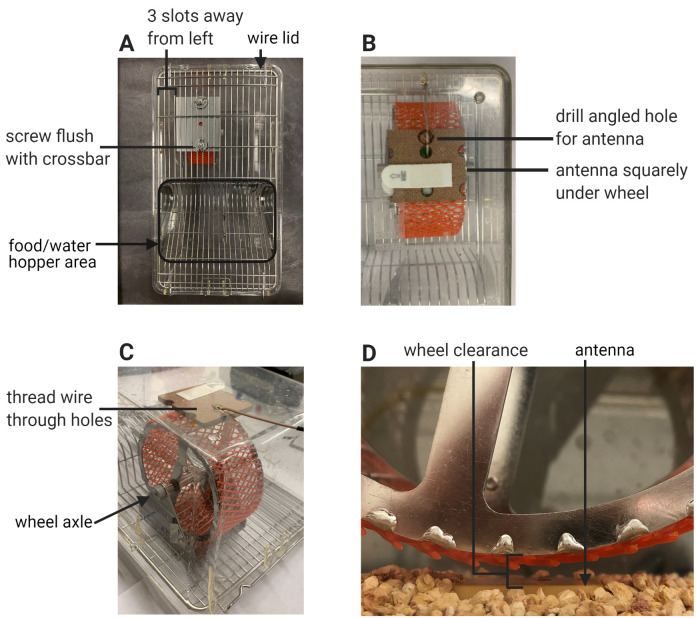
Position the wheel housing on the underside of the wire lid adjacent to the food hopper of the Techniplast cage so that:
The wheel is in front of and to the left of the food and water area.
The left edge of the wheel housing is three slots away from the left edge of the cage.
The screw of the housing is flush with the crossbar closest to the hopper.
-
The slot for the reed switch faces toward the nearest wall of the cage.
Screw the washer and wingnut onto the screw to affix the housing to the wire lid (Figure 3A).
-
Using scissors, cut a strip of netting material the width of the running wheel, such that the mesh fits around the outer rim of the wheel. This is used so the limbs of the small juvenile mice do not fall through the rungs of the wheel.
CAUTION: Ensure that this fit is precise. Improperly fitted netting (when cut too narrow) can slide on the wheel and potentially injure the mouse tail.
Unscrew the axle of the wheel housing, place the wheel inside the housing with the wheel magnet facing outward, and thread the axle through the housing and the wheel, screwing the axle cap back on.
Place the assembled RFID antenna and pegboard square directly underneath the wheel in its cage (aim the wire end of the antenna toward the back wall of the cage) and secure the antenna and pegboard square into place with a double-sided CommandTM strip. Mark a circle with the diamond-tipped pen next to where the hole with the wire is (Figure 3B). Take away the antenna-pegboard square by pulling out the CommandTM strip laterally.
-
Flip over the cage such that the base is on top. Using the drill and a 5/32” drill bit, drill the spot that was marked. When a complete hole has been made, use the 3/16” drill bit to widen the hole. Drill diagonally through the hole, such that the hole exit on the bottom of the cage points toward the back wall.
Note: Steps B1-B6 only need to be performed once for each cage.
-
Flip over the cage to an upright position. Place the antenna and pegboard square back into the cage. Thread the antenna wire through the hole, such that the wire points out of the bottom of the back wall. Readjust the antenna and pegboard square until it is squarely under the wheel. Affix the bottom of the pegboard to the cage bottom using a double-sided CommandTM strip (Figure 3C).
Note: In subsequent assemblies using pre-drilled cages, the orientation of the antenna can be modified to a non-orthogonal position with respect to the cage base. It is crucial to ensure that the center of the antenna is directly under the center of the wheel.
Add a thin layer of bedding to the cage bottom until the bedding submerges the pegboard but not the antenna. Place two nesting squares into the bottom of the cage, away from the wheel. Place the wire lid with the wheel over the cage, such that the wheel lies above the antenna with adequate clearance (Figure 3D). Cover the cage with the filtered cage top.
-
RFID + VV System Setup (Figure 4)
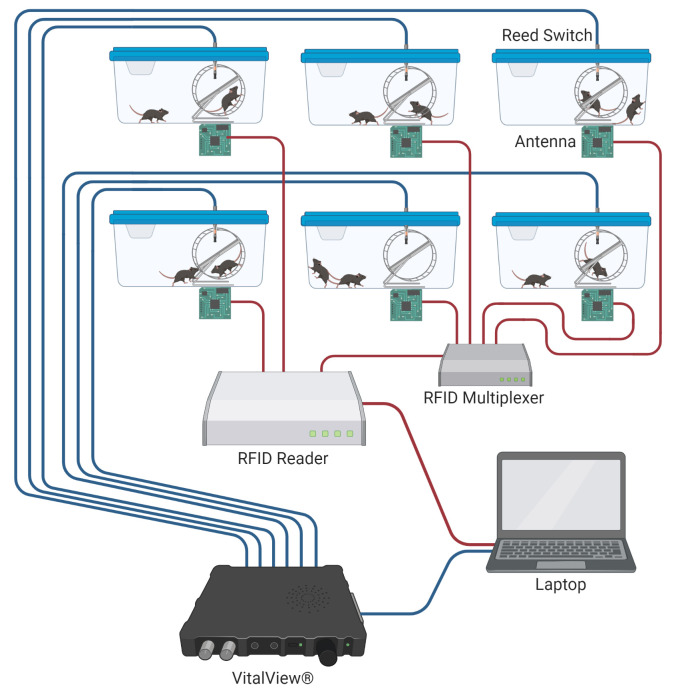
Set up the VitalView® system and RFID reader system per the manufacturer’s instructions. Initialize as many VitalView® channels and RFID antennae as you anticipate possibly needing at one time. Keep the data recording configurations for each system as default, such that recording intervals for VitalView® are less than or equal to 1 minute, and the channel names remain numeric and sequential (1-24). Using one VitalView® system (24-port), one RFID reader (4-port), and three RFID multiplexers (8-port), a maximum of 24 cages can be equipped for individual tracking.
Connect one antenna wire to one port on the RFID reader or multiplexer using the 60” LMR 100 cables (Figure 4).
-
Thread one reed switch into the reed switch slot in each running cage. Plug the other end of the reed switch cable into the port on the VitalView® box (Figure 4). Test your wheel setup by spinning the running wheel, and adjust the depth of insertion of the reed switch until wheel revolutions are recorded by the VitalView® system.
Note: The configuration with one RFID reader and one multiplexer can track 11 cages at a time, with two mice in each cage. Additional multiplexers can be added to increase the capacity of simultaneously recorded cages.
-
Mouse Tagging (Figure 5)
Etch each RFID tag based on the cage number (e.g., 1, 2, …) and animal ID within a cage (e.g., A, B) using the diamond-tipped pen.
On the laptop using the RFID software (instructions in AdvanNetTM User Guide), change an RFID tag’s EPC code to e0000000000000000000001A, e0000000000000000000001B, e…2A, e…2B, etc. based on the tag number that was etched into it (Figure 5A). Assign these numbers, as well as the mice, so that they match the channel names 1-24 from the VitalView® channels; e.g., mice tagged 1A and 1B must be in the cage connected to VitalView® channel 1, and so forth.
Scruff the P21 mouse. Using the Stoelting ear tags and ear tag applicator, tag each mouse on one ear (Figure 5B). Alternate ears (left vs. right), if possible, for easy visual identification of pair-housed mice.
Place a small drop of super glue on the green base of an RFID tag (Figure 5C). Using the tweezers, carefully affix the glued side of the RFID tag onto the Stoelting tag on the mouse’s ear. Holding the RFID tag and ear tag in place between the tweezer tips, let the glue dry for approximately 30 seconds (Figure 5D).
-
Place the mice in the cage. Ensure that mice 1A and 1B, indicated by the EPC code of the RFID tag affixed to them, are in the cage connected to VitalView® port 1. Repeat with the other cages.
Note: It is recommended that daily in-person monitoring is performed to identify and prevent the possibility of jammed wheels or insecure or fallen tags. These are infrequent occurrences in our experience; however, they can introduce error into the data collected if not addressed quickly. These issues can be easily remedied with proper supervision of the apparatus.
-
RFID Cage and Antenna Reuse
Once the experiment is completed, unplug the antenna from the LMR100 cable. Remove the antenna and pegboard square by pulling the CommandTM strips laterally. Dispose of the pegboard. Save the antenna and wash carefully with water and a sponge.
Pre-drilled cages and washed antennae may be reused for future experiments. A new pegboard square must be used for each cage.
Figure 2. Antenna setup.
A. Proper dimensions of the pegboard square in relation to the antenna and CommandTM strip. B-C. Proper assembly of the antenna and pegboard square in top-down (B) and side-profile (C) views.
Figure 3. Cage setup.
A. Proper assembly of the wheel housing in relation to the wire lid and cage layout. B. Bottom-up view of the Techniplast cage showing the area under the wheel. Proper placement of the antenna and pegboard square under the wheel. The drill site is adjacent to the wire exit hole of the pegboard and is indicated by the black circle drawn on the cage bottom. C. Threading of the antenna wire through the cage hole. D. Clearance between the antenna and the wheel.
Figure 4. RFID and VitalView® system setup.
Schematic of data feeds from parallel RFID and VitalView® systems. RFID reader connections can be expanded to multiple cages using an RFID multiplexer. Each RFID antenna is connected to the reader or multiplexer via a 60” LMR 100 cable. We typically use separate computers for VitalView® and RFID reader software (AdvanNetTM Software) programs.
Figure 5. Mouse tagging.
A. Example of RFID tags etched with their new EPC designation. B. The mouse is scruffed, and an ear tag is attached to mouse’s left ear. C. Super glue has been added to the base of the RFID tag, and the RFID tag can be picked up with the tweezers. Only a minimal amount of super glue is needed to affix the RFID tag to the ear tag. D. The RFID tag is applied to the ear tag and held in place for about 30 seconds to allow the glue to dry.
Data analysis
-
Aligning VitalView® and RFID raw data to generate individual running distances (Figures 6, 7)
Note: Wheel revolutions are determined minute-by-minute per cage by the VitalView® Activity Software and exported as a .csv file. For each RFID-tagged mouse, individual tag reads are logged by the RFID reader and exported as a .csv file via the AdvanNetTM Software.
Per the manufacturers’ instructions, export the data from the VitalView® system and AdvanNetTM Software. The AdvanNetTM Software automatically names the file “data.csv.” The VitalView software is named according to user designation.
Make six new directories (folders) to hold your files during processing. These directories will accept and store files for (suggested names): 1) VV Input 2) RFID Input, 3) VV Output, 4) RFID Output, 5) Distances, and 6) Stats.
Place the Vital View export .csv file(s) into the “VV Input” directory.
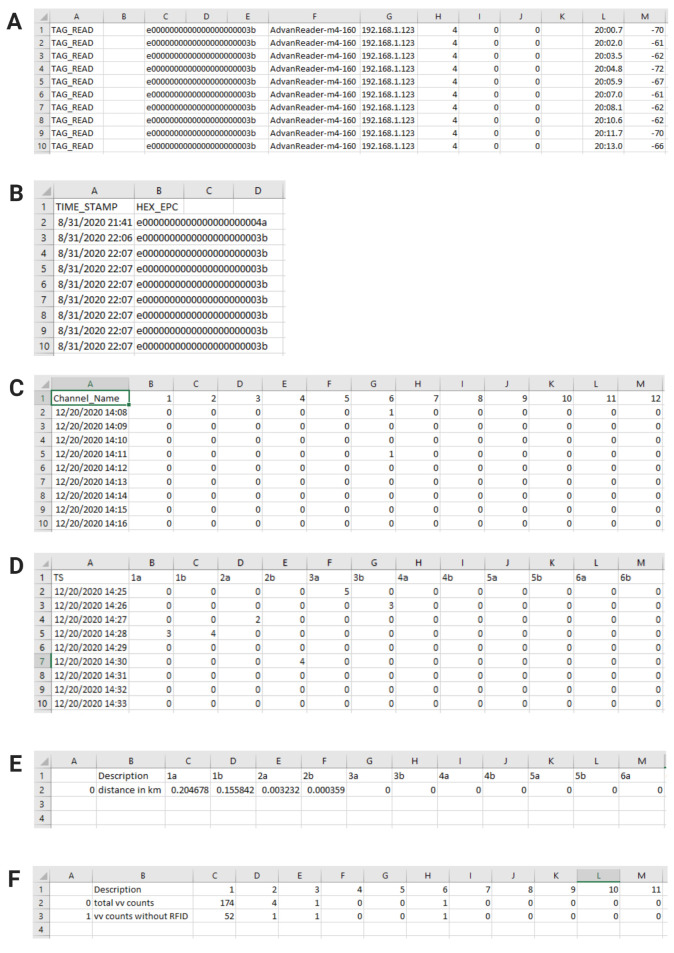
”Preprocess” the RFID data file before proceeding: The RFID export .csv data file needs to be reformatted (preprocessed) in order for the program to align it with the VV data. Open the RFID export .csv file in Microsoft Excel (Figure 7A). Locate the time stamp column (in our case, column L). Convert the number format of the column to “MM/DD/YY HH:MM” (use a 24-hour clock). Select and cut the whole timestamp column and paste it into column B to the left of the EPC column (in our case, column C). Delete all columns except the timestamp and EPC columns, such that the timestamp column is column A and the EPC column is column B. Select the whole timestamp column, sort by oldest to newest, and expand the selection. Insert a new row 1. In cell 1A, write “TIME_STAMP” and in cell 1B, write “HEX_EPC” (Figure 7B). If these words appear anywhere else in the document, delete those rows and keep only the words written in row 1. Save the Excel sheet as a new “preprocessed” export .csv file and place it in the “RFID input” directory.
-
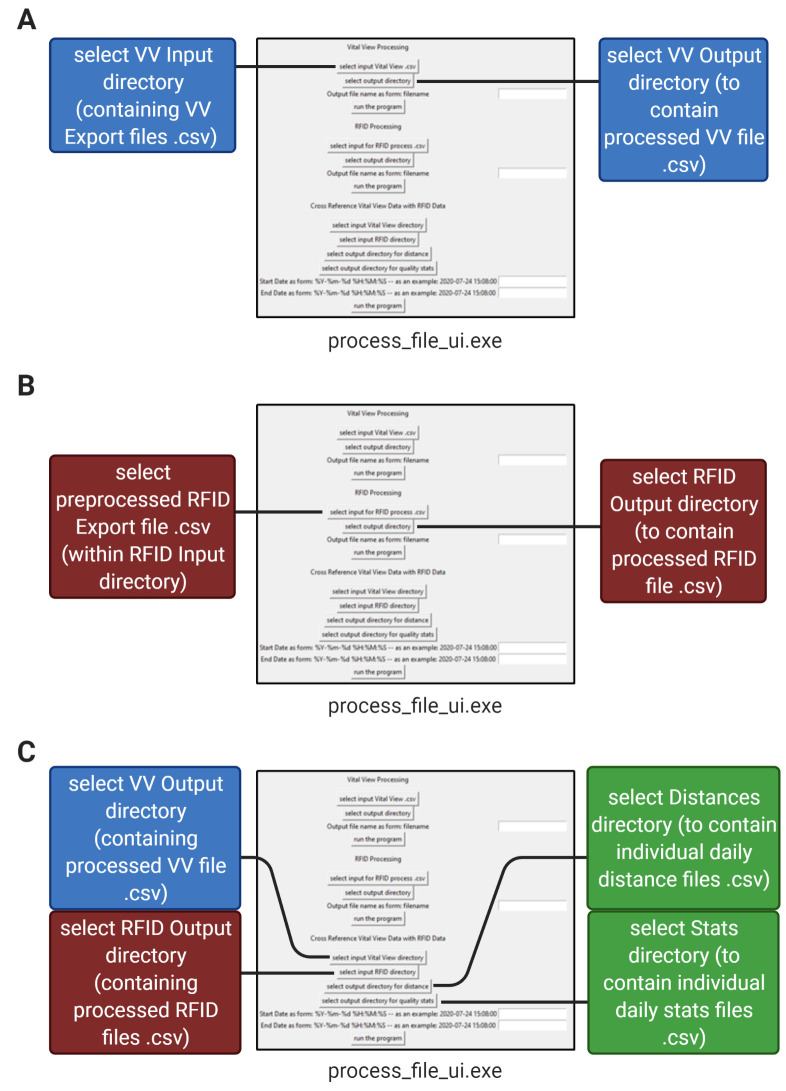
Open the project “Individual RFIDELEMus” on GitHub (downloadable link can be found in the above “Software” section). Use the RFID code program, process_file_ui.exe, to process the data in three steps:
The “Vital View Processing” section of the process_file_ui.exe program collects one or multiple Vital View export files in the VV input directory and combines them into one processed file. The Program then resamples the data over 1-minute time intervals so that the data can be directly compared with the RFID data. Ensure that the VV input directory only contains Vital View export files. Select the “VV input” directory as your input and select the “VV output” directory as your output. Type in a name for your output VV file and run this section of the program (Figure 6A). The output file will be written to the “VV output” directory (Figure 7C).
The “RFID Processing” section of the process_file_ui.exe program accepts a preprocessed RFID file .csv and bins its tag reads into rows of minutes for each mouse (each mouse has its own column) based on their unique EPC code. Select the preprocessed RFID data file in the “RFID Input” directory as your input and select the “RFID Output” directory as your output (Figure 6B). Type in a name for your output RFID file and run this section of the program. The output file will appear in the “RFID Output” directory (Figure 7D).
The “Cross Reference Vital View Data with RFID Data” section of the process_file_ui.exe program assigns the sum of the number of wheel revolutions within each 1-minute interval to the mouse in the cage with the most tag reads during that minute. It then converts wheel revolutions to distance run (using our running wheel diameter of 4.5 inches) and outputs individual running distances as one .csv file per day (for example, if you recorded for seven days, there will be seven separate files in the output directory) (Figure 7E). Select the “VV Output” directory (containing the file from step 1) as your VV input to the program and select the “RFID Output” directory (containing the file from step 2) as your RFID input to the program. Select the “Distances” directory as your Distances output and select the “Stats” directory as your Stats output. Provide dates and times in “YYYY-MM-DD HH:MM:SS” (24-hour) format for the start and end of the desired data processing and run this section of the program (Figures 6C, 8A, 8B).
-
Data Validation (Figure 8)
Note: Running distances are assigned and compiled on a minute-by-minute basis. The process_file_ui.exe program provides separate .csv files logging a) the number of minutes with at least one wheel revolution, or “total vv counts”, and b) the number of minutes with a wheel revolution but without a tag read, or “vv counts without RFID.” These files are in the “Stats” folder. One Stats file is produced per day (Figure 7F).
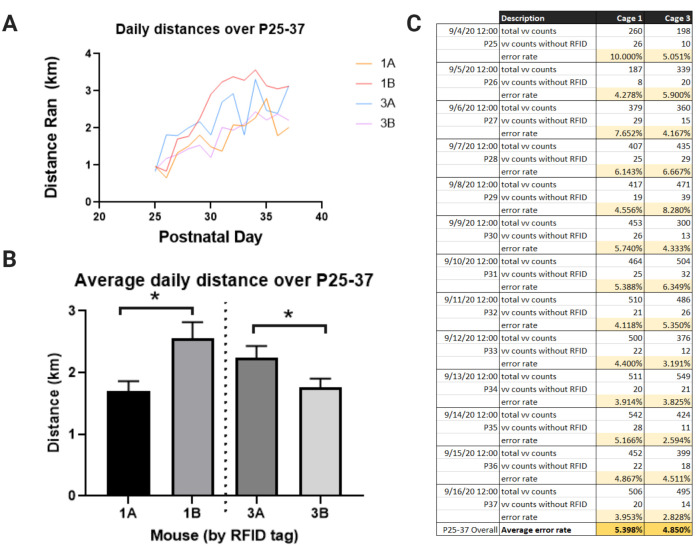
Divide b) by a) to yield the proportion (error rate) of running minutes that were not captured by the RFID system (Figure 8C).
Figure 6. Data processing pipeline in 3 steps.
Illustration of the pipeline for processing RFID export and VV export files using the process_file_ui.exe program. A. Step 1: Processing of Vital View files from the input directory. B. Step 2: Processing of RFID export data. C. Step 3: Cross-referencing of RFID and Vital View files into individual daily distances and daily error rates.
Figure 7. RFID and VV data file reformatting examples.
A. Excerpt of the raw RFID export file format before reformatting (preprocessing). B. Excerpt of the final reformatted (preprocessed) RFID export file, ready for use in RFID processing. C. Excerpt of the VV output file of the “Vital View Processing” step. D. Excerpt of the RFID output file of the “RFID Processing” step. E. Excerpt of the Distances output file for one day of the “Cross Reference Vital View Data with RFID Data” step. When cross-referencing multiple days, each day will produce one output file in the “Distances” directory. F. Excerpt of the Stats output file for one day of the “Cross Reference Vital View Data with RFID Data” step. When cross-referencing multiple days, each day will produce one output file in the “Stats” directory.
Figure 8. Representative data.
A. Individual running distances of male mice per day, recorded for 13 consecutive days (between postnatal days 25 and 37) in two cages, Cage 1 and Cage 3. Mice 1A and 1B were pair-housed together, and mice 3A and 3B were pair-housed together. Mice were acclimated to the running wheel during P21-24 (data not shown). B. Average distance ran per day, demonstrating a significant intra-cage difference in the average running volume (unpaired t-test, *P < 0.05). C. Total number of minutes with wheel revolutions (as recorded by VitalView®) and total minutes of running without an accompanying RFID tag read (as recorded by the RFID reader) per day for each cage. .
Notes
-
System Monitoring
RFID-equipped cages must be routinely monitored for wheel obstructions by nesting material or excessive bedding under the wheel. This can be determined by daily visual inspection or viewing Vital View software recordings.
Check the RFID export files regularly to make sure the tags are still being detected as expected. Check the Vital View data exports regularly to ensure that mouse running is being recorded as expected. We monitor these exports every other day. Data files can be exported to an external drive while the experiment is in progress.
Monitor the mice daily for any disruptions in the RFID tag and/or ear tag attached to their ear. A separated ear tag and RFID tag from a mouse has only occurred twice in our experiments. If a mouse is missing an RFID tag or ear tag, give the mouse a new set, making sure the EPC of the new RFID tag is the same as that of the tag that has fallen off.
-
Mouse Running
Tracking is conducted continuously 24 h a day, through the light and dark cycle, and may start as soon as pups are weaned from their mother (postnatal day 21).
Mice were not given a stationary wheel acclimation period. They were instead allowed to run on the running wheel from the time they were weaned. The plastic netting fitted around the rim of the wheel ensures that the wheel is safe for juvenile mice to run on, so an acclimation period was not deemed necessary to guarantee safety. Our data showed that juvenile mice gradually increase their running over time post-weaning. The first few days of acclimation may be removed during data analysis if needed.
Acknowledgments
All images were generated with Biorender. Special thanks to atlasRFIDstore, Keonn Technologies, and Luke Raus for their technical assistance and expertise.
Competing interests
There are no competing interests to disclose.
Ethics
All experiments using live animals described in this protocol have been approved for use by our Institutional Animal Care and Use Committee (IACUC) at the University of California – Irvine. All steps were taken to ensure minimal pain and distress to mice in this paradigm. The IACUC Approved Use Protocol for this experiment is 19-057.
Citation
Readers should cite both the Bio-protocol article and the original research article where this protocol was used.
References
- 1.Arakawa H.(2018). Ethological approach to social isolation effects in behavioral studies of laboratory rodents. Behav Brain Res 341: 98-108. [DOI] [PubMed] [Google Scholar]
- 2.Batchelder P., Kinney R. O., Demlow L. and Lynch C. B..(1983). Effects of temperature and social interactions on huddling behavior in Mus musculus. Physiol Behav 31(1): 97-102. [DOI] [PubMed] [Google Scholar]
- 3.Frahm S., Melis V., Horsley D., Rickard J. E., Riedel G., Fadda P., Scherma M., Harrington C. R., Wischik C. M., Theuring F. and Schwab K..(2018). Alpha-Synuclein transgenic mice, h-α-SynL62, display α-Syn aggregation and a dopaminergic phenotype reminiscent of Parkinson’s disease. Behavioural Brain Research 339: 153-168. [DOI] [PubMed] [Google Scholar]
- 4.Goh J. and Ladiges W..(2015). Voluntary Wheel Running in Mice. Curr Protoc Mouse Biol 5(4): 283-290. [DOI] [PMC free article] [PubMed] [Google Scholar]
- 5.Hawkley L. C., Cole S. W., Capitanio J. P., Norman G. J. and Cacioppo J. T..(2012). Effects of social isolation on glucocorticoid regulation in social mammals. Horm Behavior 62(3): 314-323. [DOI] [PMC free article] [PubMed] [Google Scholar]
- 6.Hayes L. D.(2000). To nest communally or not to nest communally: a review of rodent communal nesting and nursing. Anim Behav 59(4): 677-688. [DOI] [PubMed] [Google Scholar]
- 7.Himmler B. T., Pellis S. M. and Kolb B..(2013). Juvenile play experience primes neurons in the medial prefrontal cortex to be more responsive to later experiences. Neurosci Lett 556: 42-45. [DOI] [PubMed] [Google Scholar]
- 8.Ieraci A., Mallei A. and Popoli M..(2016). Social Isolation Stress Induces Anxious-Depressive-Like Behavior and Alterations of Neuroplasticity-Related Genes in Adult Male Mice. Neural Plast 2016: 6212983. [DOI] [PMC free article] [PubMed] [Google Scholar]
- 9.Ivy A. S., Yu T., Kramar E., Parievsky S., Sohn F. and Vu T..(2020). A Unique Mouse Model of Early Life Exercise Enables Hippocampal Memory and Synaptic Plasticity. Sci Rep 10(1): 9174. [DOI] [PMC free article] [PubMed] [Google Scholar]
- 10.Kappel S., Hawkins P. and Mendl M. T..(2017). To Group or Not to Group? Good Practice for Housing Male Laboratory Mice. Animals(Basel) 7(12). [DOI] [PMC free article] [PubMed] [Google Scholar]
- 11.Koike H., Ibi D., Mizoguchi H., Nagai T., Nitta A., Takuma K., Nabeshima T., Yoneda Y. and Yamada K..(2009). Behavioral abnormality and pharmacologic response in social isolation-reared mice. Behav Brain Res 202(1): 114-121. [DOI] [PubMed] [Google Scholar]
- 12.Krynitsky J., Legaria A. A., Pai J. J., Garmendia-Cedillos M., Salem G., Pohida T. and Kravitz A. V..(2020). Rodent Arena Tracker(RAT): A Machine Vision Rodent Tracking Camera and Closed Loop Control System. eNeuro 7(3). [DOI] [PMC free article] [PubMed] [Google Scholar]
- 13.Liu Y., Yan T., Chu J. M., Chen Y., Dunnett S., Ho Y. S., Wong G. T. and Chang R. C..(2019). The beneficial effects of physical exercise in the brain and related pathophysiological mechanisms in neurodegenerative diseases. Lab Invest 99(7): 943-957. [DOI] [PubMed] [Google Scholar]
- 14.Makinodan M., Rosen K. M., Ito S. and Corfas G..(2012). A critical period for social experience-dependent oligodendrocyte maturation and myelination. Science 337(6100): 1357-1360. [DOI] [PMC free article] [PubMed] [Google Scholar]
- 15.Matikainen-Ankney B. A., Garmendia-Cedillos M., Ali M., Krynitsky J., Salem G., Miyazaki N. L., Pohida T. and Kravitz A. V..(2019). Rodent Activity Detector(RAD), an Open Source Device for Measuring Activity in Rodent Home Cages. eNeuro 6(4). [DOI] [PMC free article] [PubMed] [Google Scholar]
- 16.Okada R., Fujiwara H., Mizuki D., Araki R., Yabe T. and Matsumoto K..(2015). Involvement of dopaminergic and cholinergic systems in social isolation-induced deficits in social affiliation and conditional fear memory in mice. Neuroscience 299: 134-145. [DOI] [PubMed] [Google Scholar]
- 17.Oliff H. S., Berchtold N. C., Isackson P. and Cotman C. W..(1998). Exercise-induced regulation of brain-derived neurotrophic factor(BDNF) transcripts in the rat hippocampus. Brain Res Mol Brain Res 61(1-2): 147-153. [DOI] [PubMed] [Google Scholar]
- 18.Peleh T., Bai X., M. J. H. Kas and B. Hengerer .(2019). RFID-supported video tracking for automated analysis of social behaviour in groups of mice. J Neurosci Methods 325: 108323. [DOI] [PubMed] [Google Scholar]
- 19.Poffe C., Dalle S., Kainz H., Berardi E. and Hespel P..(2018). A noninterfering system to measure in-cage spontaneous physical activity in mice. J Appl Physiol 125(2): 263-270. [DOI] [PubMed] [Google Scholar]
- 20.Reimer J. D. and Petras M. L..(1967). Breeding structure of the house mouse, Mus musculus, in a population cage. J Mammal 48(1): 88-99. [PubMed] [Google Scholar]
- 21.Terranova M. L., Laviola G., L. de Acetis and E. Alleva .(1998). A description of the ontogeny of mouse agonistic behavior. J Comp Psychol 112(1): 3-12. [DOI] [PubMed] [Google Scholar]
- 22.Voikar V. and Gaburro S..(2020). Three Pillars of Automated Home-Cage Phenotyping of Mice: Novel Findings, Refinement, and Reproducibility Based on Literature and Experience. Front Behav Neurosci 14: 575434. [DOI] [PMC free article] [PubMed] [Google Scholar]
- 23.Wang Z., Mirbozorgi S. A. and Ghovanloo M..(2018). An automated behavior analysis system for freely moving rodents using depth image. Med Biol Eng Comput 56(10): 1807-1821. [DOI] [PubMed] [Google Scholar]


