Abstract
Computational neuroscience aims to model, reproduce, and predict network dynamics for different neuronal ensembles by distilling knowledge derived from electrophysiological and morphological evidence. However, analyses and simulations often remain critically limited by the sparsity of direct experimental constraints on essential parameters, such as electron microscopy and electrophysiology pair/multiple recording evidence of connectivity statistics. Notably, available data are particularly scarce regarding quantitative information on synaptic connections among identified neuronal types. Here, we present a user-friendly data-driven pipeline to estimate connection probabilities, number of contacts per connected pair, and distances from the pre- and postsynaptic somas along the axonal and dendritic paths from commonly available two-dimensional tracings and other broadly accessible measurements. The described procedure does not require any computational background and is accessible to all neuroscientists. This protocol therefore fills the important gap from neuronal morphology to circuit organization and can be applied to many different neural systems, brain regions, animal species, and data sources.
Graphic abstract:
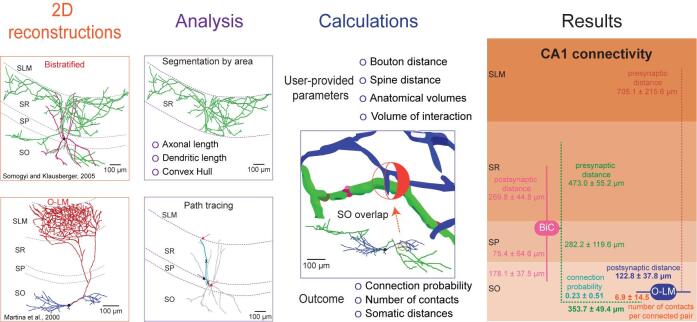
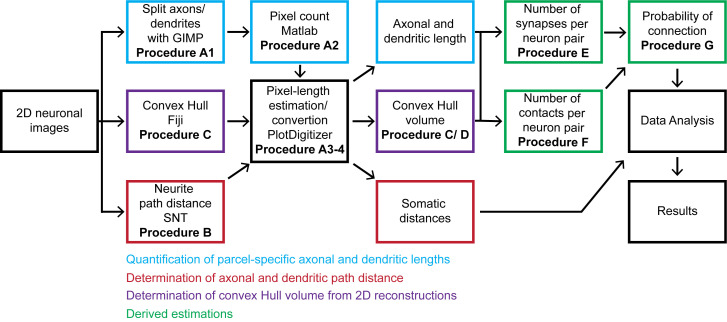
The processing protocol from 2D reconstructions to quantitated synaptic connections
Keywords: Synaptic connectivity, Neuronal network, Connection probabilities, Contacts, Convex hull, Propagation error, Axonal-dendritic overlap
Background
Synaptic connectivity is a key determinant of the interaction between neurons, and its quantitation is pivotal to understanding the organization of brain circuits and the relationship with network function (Ascoli and Atkeson, 2005). Current knowledge of synaptic probability relies on empirical evidence, which is limited by the number of simultaneously recorded neurons (e.g., by pair recording, octopatch, multielectrode array) and affected by experimental conditions (in vitro vs. in vivo, slice orientation and thickness, distance between cells, etc.). Connections in a particular brain region are often probed by evoked responses upon stimulation of the afferent fiber tracts; however, such tests do not allow the identification of the specific neuronal types involved (Moradi and Ascoli, 2020). Alternatively, synaptic connectivity can be calculated computationally by embedding three-dimensionally (3D) reconstructed neuronal morphologies into 3D brain atlases and counting the possible locations of axonal-dendritic overlap (Ropireddy and Ascoli, 2011). Nevertheless, this approach requires a large amount of labor-intensive data, is limited by the precision of the 3D registration, and has so far proven impractical to scale up.
Despite its importance, connectivity information remains incomplete for most animal species and neural systems ( Rees et al., 2017 ). This protocol describes a simple process for the extraction of important quantitative synaptic parameters – namely the connection probability, number of contacts per connected pair, and distance from the pre- and postsynaptic somas along the neurite paths – from commonly available two-dimensional images of axonal and dendritic morphology. To the best of our knowledge, there are no alternative solutions available to obtain the same results. Initially, this approach was used to estimate hippocampal connectivity and demonstrated high correlation of the resulting estimates with sparsely available data ( Tecuatl et al., 2021 ).
The overall workflow of the presented pipeline consists of seven main logical components: (i) quantitation of parcel-specific axonal and dendritic lengths; (ii) determination of parcel-specific axonal and dendritic path distances; (iii) measurement of parcel-specific axonal and dendritic convex hull volume; (iv) calculation of the average number of synapses per neuronal pair in each parcel; (v) calculation of the number of contacts per connected pair; (vi) calculation of the connection probability per neuronal pair; and (vii) calculation of the confidence intervals on these values by propagation of error analysis. All steps can be carried out on a basic desktop or laptop computer using readily available software (Figure 1).
Figure 1. Flow chart of the described pipeline.
The procedure starts from 2D neuronal images that are processed to quantitate axonal and dendritic lengths, path distances from the soma by parcel, and convex hull volumes. From these quantitations, we calculate the number of synapses and contacts per neuronal pair and subsequently estimate the probabilities of connection from multiple neuronal pairs. The generated information is analyzed and presented as the mean and standard deviation.
Equipment
-
Standard personal computer
The described analysis was performed using a Bionic G32 144Hz All In One PC [i7-8700] with Windows 10. The recommended minimal configuration is AMD Ryzen 5 2600X Six-Core Processor 3.60 GHz, 16 GB RAM, 64-bit operating system.
Software
GNU Image Manipulation Program, free access (GIMP 2.8; gimp.org/downloads/).
Custom-made MATLAB algorithm, free access (github.com/Hippocampome-Org/QuantifyNeurites)
Plot Digitizer, free access (plotdigitizer.sourceforge.net)
Fiji: Shape Analysis plugin, free access (Wagner and Lipinski, 2013; imagej.net/Shape_Filter)
Fiji: Simple Neurite Tracer plugin, free access ( Longair et al., 2011 ; imagej.net/Simple_Neurite_Tracer:_Basic_Instructions)
Fiji: 3D Convex Hull, free access (imagej.nih.gov/ij/plugins/3d-convex-hull)
MATLAB: commercial license; 30-day free trial available (mathworks.com/products/get-matlab.html)
Image Dataset and Additional Requirements
Required are figures containing drawings of neuronal morphology, such as dendritic and axonal arbors (Recipe 1). If both axons and dendrites originate from the same neuron, they need to be drawn in distinct colors. If the arbors invade multiple anatomical parcels, the figure must demarcate the parcel boundaries when parcel-specific data are required. IMPORTANT: All figures need to contain a calibration bar. The examples used in this protocol are accessible at hippocampome.org/php/data/Bio-protocol_sample_files.zip.
Required are estimations of the volumes of anatomical parcels in which the neurons of interest are contained (Recipe 2). The examples used in this protocol are listed in Table 1 and accessible at bbp.epfl.ch/nexus/cell-atlas.
Required are estimations of the average distance between presynaptic elements (boutons) along the axons and of the average distance between postsynaptic elements (spines of shaft densities) along the dendrites for the species and neural system of interest (Recipe 3). The examples used in this protocol are accessible at hippocampome.org/php/data/Bio-protocol_sample_files.zip.
Table 1. List of all representative files.
| File name | Type | Description | Use |
| Neurite Quantitation.xlsx | XLSX | Spreadsheet to collect the data from the pixel count, pixel length estimation, convex hull area, and neurite path distance | Data collection of pixel count to estimate axonal/dendritic length and somatic distance |
| Bouton distance.docx | DOCX | List of reported ultrastructural measurements for axonal bouton distance in the hippocampal formation | Estimation of the number of synapses and contacts per neuronal pair |
| Dendritic spine distance.docx | DOCX | List of reported ultrastructural measurements for dendritic spine distance in the hippocampal formation | Estimation of the number of synapses and contacts per neuronal pair |
| Harris-Stewart-2001-41-BrainRes-Fig2A/Harris-Stewart-2001-41-BrainRes-Fig2A.pdf | Original file that contains the neuronal reconstruction from a Subiculum CA1 Projecting Pyramidal cell | Image manipulation with GIMP | |
| Harris-Stewart-2001-41-BrainRes-Fig2A/Harris-Stewart-2001-41-BrainRes-Fig2A.xcf | XCF | File generated with GIMP for manipulation | Exported file without modifications |
| Harris-Stewart-2001-41-BrainRes-Fig2A/Harris-Stewart-2001-41-BrainRes-Fig2A.png | PNG | Exported PNG file without modifications from the XCF version |
1. Scale bar conversion with Plot Digitizer 2. Somatic distance estimation with SNT |
| Harris-Stewart-2001-41-BrainRes-Fig2A/Sub_CA1 projecting Pyramidal_all_allcolors_both.xcf | XCF | File saved with GIMP for manipulation that includes brain region, cell type, and parcel information | Segregation of axons and dendrites with GIMP |
| Harris-Stewart-2001-41-BrainRes-Fig2A/Sub_CA1 projecting Pyramidal_all_allcolors_Ds.xcf | XCF | File that contains only dendrites in all the parcels | Segregation of dendrites based on parcel borders with GIMP |
| Harris-Stewart-2001-41-BrainRes-Fig2A/Sub_CA1 projecting Pyramidal_all_allcolors_Ds.png | PNG | Exported PNG file with only dendrites from the XCF version | Dendritic somatic distance estimation with SNT, if you cannot discern axons and dendrites from Harris-Stewart-2001-41-BrainRes-Fig2A.png file |
| Harris-Stewart-2001-41-BrainRes-Fig2A/Sub_CA1 projecting Pyramidal_SM_allcolors_Ds.xcf | XCF | File that contains only dendrites in SUB:SM | Saved file with dendrites in Sub:SM for future edits if needed |
| Harris-Stewart-2001-41-BrainRes-Fig2A/Sub_CA1 projecting Pyramidal_SM_allcolors_Ds.png | PNG | Exported PNG file with only dendrites in Sub:SM |
1. Pixel count with MATLAB 2. Convex hull area estimation with Fiji: Hull And Circle |
| Harris-Stewart-2001-41-BrainRes-Fig2A/Sub_CA1 projecting Pyramidal_SP_allcolors_Ds.xcf | XCF | File that contains only dendrites in Sub:SP | Saved file with dendrites in Sub:SP for future edits if needed |
| Harris-Stewart-2001-41-BrainRes-Fig2A/Sub_CA1 projecting Pyramidal_SP_allcolors_Ds.png | PNG | Exported PNG file with only dendrites in Sub:SP |
1. Pixel count with MATLAB 2. Convex hull area estimation with Fiji: Hull And Circle |
| Harris-Stewart-2001-41-BrainRes-Fig2A/Sub_CA1 projecting Pyramidal_all_allcolors_Ax.xcf | XCF | File that contains only axons in all the parcels | Segregation of axons based on parcel borders with GIMP |
| Harris-Stewart-2001-41-BrainRes-Fig2A/Sub_CA1 projecting Pyramidal_all_allcolors_Ax.png | PNG | Exported PNG file with only axons from the XCF version | Axonal somatic distance estimation with SNT, if you cannot discern axons and dendrites from Harris-Stewart-2001-41-BrainRes-Fig2A.png file |
| Harris-Stewart-2001-41-BrainRes-Fig2A/Sub_CA1 projecting Pyramidal_SM_allcolors_Ax.xcf | XCF | File that contains only axons in Sub:SM | Saved file with axons in Sub:SM for future edits if needed |
| Harris-Stewart-2001-41-BrainRes-Fig2A/Sub_CA1 projecting Pyramidal_SM_allcolors_Ax.png | PNG | Exported PNG file with only axons in Sub:SM |
1. Pixel count with MATLAB 2. Convex hull area estimation with Fiji: Hull And Circle |
| Harris-Stewart-2001-41-BrainRes-Fig2A/Sub_CA1 projecting Pyramidal_SP_allcolors_Ax.xcf | XCF | File that contains only axons in Sub:SP | Saved file with axons in Sub:SP for future edits if needed |
| Harris-Stewart-2001-41-BrainRes-Fig2A/Sub_CA1 projecting Pyramidal_SP_allcolors_Ax.png | PNG | Exported PNG file with only axons in Sub:SP |
1. Pixel count with MATLAB 2. Convex hull area estimation with Fiji: Hull And Circle |
| Harris-Stewart-2001-41-BrainRes-Fig2A/Sub_CA1 projecting Pyramidal_PL_allcolors_Ax.xcf | XCF | File that contains only axons in Sub:PL | Saved file with axons in Sub:PL for future edits if needed |
| Harris-Stewart-2001-41-BrainRes-Fig2A/Sub_CA1 projecting Pyramidal_PL_allcolors_Ax.png | PNG | Exported PNG file with only axons in Sub:PL |
1. Pixel count with MATLAB 2. Convex hull area estimation with Fiji: Hull And Circle |
| Harris-Stewart-2001-41-BrainRes-Fig2A/Sub_CA1 projecting Pyramidal_CA1 SLM_allcolors_Ax.xcf | XCF | File that contains only axons in CA1:SLM | Saved file with axons in CA1:SLM for future edits if needed |
| Harris-Stewart-2001-41-BrainRes-Fig2A/Sub_CA1 projecting Pyramidal_CA1 SLM_allcolors_Ax.png | PNG | Exported PNG file with only axons in CA1:SLM |
1. Pixel count with MATLAB 2. Convex hull area estimation with Fiji: Hull And Circle |
| Harris-Stewart-2001-41-BrainRes-Fig2A/Sub_CA1 projecting Pyramidal_CA1 SR_allcolors_Ax.xcf | XCF | File that contains only axons in CA1:SR | Saved file with axons in CA1:SR for future edits if needed |
| Harris-Stewart-2001-41-BrainRes-Fig2A/Sub_CA1 projecting Pyramidal_CA1 SR_allcolors_Ax.png | PNG | Exported PNG file with only axons in CA1:SR |
1. Pixel count with MATLAB 2. Convex hull area estimation with Fiji: Hull And Circle |
| Bannister-Larkman-1995-150-JCompNeurol-Fig10A/Bannister-Larkman-1995-150-JCompNeurol-Fig10A.pdf | Original file that contains the neuronal reconstruction from a CA1 Pyramidal cell | Image manipulation with GIMP | |
| Bannister-Larkman-1995-150-JCompNeurol-Fig10A/Bannister-Larkman-1995-150-JCompNeurol-Fig10A.png | PNG | Exported PNG file without modifications from the XCF version | Somatic distance estimation with SNT |
| Bannister-Larkman-1995-150-JCompNeurol-Fig10A/Bannister-Larkman-1995-150-JCompNeurol-Fig10A.traces | TRACES | File that includes the tracings and measurements associated with the neuronal reconstruction | Saved tracings for reference and review if needed |
| Bannister-Larkman-1995-150-JCompNeurol-Fig10A/Hull And Circle Results.csv | CSV | File with measurements for the convex hull area associated with the neuronal reconstruction | Saved measurements for reference and review if needed |
| Martina-Jonas-2000-295-Science-Fig1C.pdf | Original file that contains the neuronal reconstruction from a CA1 O-LM interneuron | Image manipulation with GIMP | |
| Somogyi-Klausberger-2005-9-JPhysiol-Fig3A.pdf | Original file that contains the neuronal reconstruction from a CA1 Bistratified interneuron | Image manipulation with GIMP |
Procedure
-
Quantitation of parcel-specific axonal and dendritic lengths
-
Generate the necessary PNG files with GIMP. From the original unmodified neuronal reconstruction (Recipe 1), manually segregate the axons and dendrites within each anatomical parcel. If parcel-specific information is not required, simply separate the axons from the dendrites to estimate the corresponding axonal and dendritic length (Video 1).
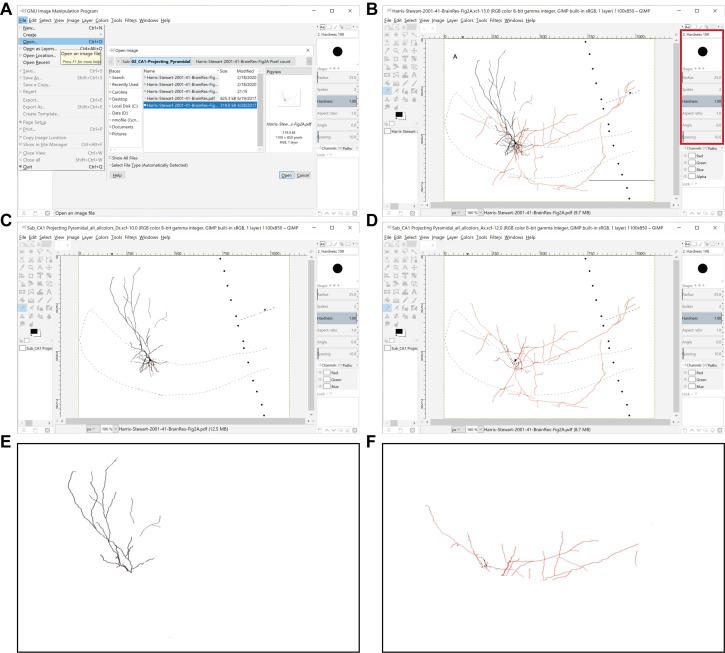
Load a PDF into GIMP (e.g., File: Open “Harris-Stewart-2001-41-BrainRes-Fig2A.pdf”) (Figure 2A).
-
Use GIMP to erase the extraneous parts of the figure (Figure 2B).
Select the eraser tool from the Toolbox window.
Select Hardness 100 from the Brushes window.
Set the brush size to the desired size (e.g., 25) in the Tool Options windows (Figure 2B, red box).
Hold down the left button of the mouse to erase parts of the figure.
Save the XCF version of the erased figure that includes both kinds of neurites in all layers (e.g., File: Save As... “SCA_all_allColors_both”). IMPORTANT: The structure of the name should be preserved for the pixel count.
Export the PNG version from the XCF version of the figure to the same folder (e.g., File: Export As... “SCA_all_allColors_both.png”). The PNG is selected as the file format of choice because its default background is transparent. This reduces any potential errors from accidentally counting pixels included in the background.
-
Use GIMP to erase the axons from the figure based on the color code (axons are shown in red in Figure 2B) by repeating steps b i-iv (Figure 2C, Video 1).
Save the XCF version of the figure with the dendrites in the layer of interest to the same folder (e.g., File: Save As... “SCA_SO_allColors_Ds.xcf”).
Export the PNG version from the XCF version of the figure to the same folder (e.g., File: Export As... “SCA_SO_allColors_Ds.png”).
-
Use GIMP to erase the dendrites from the figure based on the color code (dendrites are shown in black in Figure 2B) by repeating steps b i-iv (Figure 2D, Video 1).
Save the XCF version of the figure with the axons in the layer of interest to the same folder (e.g., File: Save As... “SCA_SO_allColors_Ax.xcf”).
Export the PNG version from the xcf version of the figure to the same folder (e.g., File: Export As... “SCA_SO_allColors_As.png”).
Save the axonal and dendritic domains in distinct files for every layer and subregion to the same folder (Figure 2E and 2F).
-
Pixel counting using a custom-made MATLAB algorithm (Figure 3; Video 2).
Place the separated images in the data folder.
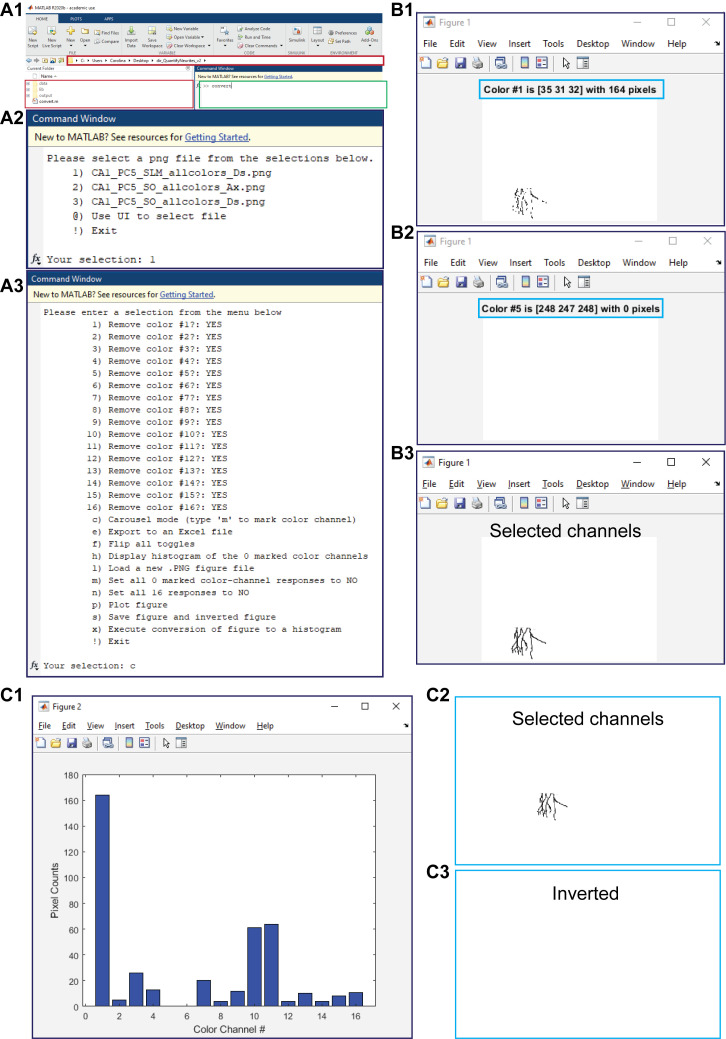
Open MATLAB, making sure that the current working folder is open (e.g., “dir_QuantifyNeurites_v2”) (Figure 3A1, red boxes).
Run the command convert (Figure 3A1, green box).
From the displayed menu, select the image to be worked on by typing the number and pressing enter (Figure 3A2).
After the image is open, select the carousel mode to identify the color channels that contain pixels (Figure 3A3).
Press m to choose the color channels that contain pixels (the number of pixels is displayed in brackets) (Figure 3B1).
If the channel does not contain any pixels, just press the space bar to move to the next channel (Figure 3B2).
Optional step: plot the image with the selected color channels to verify that the selected channels contain all of the pixels by typing p and pressing enter (Figure 3B3).
A histogram with the total pixel count is displayed (Figure 3C1). The command window displays the selected channels and number of pixels.
Optional step: save the images that contain the selected (Figure 3C2) and unselected (Figure 3C3) channels by typing s and pressing enter. The images are automatically saved to the output folder.
Select a new image from the data folder by typing l and pressing enter.
End the process by typing / and pressing enter.
-
Pixel length estimation using Plot Digitizer (Video 3).
Open the original reconstruction with Plot Digitizer.
Place the cursor over the start of the calibration bar and take note of the number.
Do the same at the other end of the calibration bar.
The difference between the numbers represents the length of calibration bar in pixels.
-
Conversion from pixel number to length.
Determine the mean neurite width by randomly selecting three locations for every neuron image, parcel, and neurite domain, measuring the branch width in pixels at each location, and averaging the three values (Video 4).
Calculate the pixel length in physical units, which is simply the nominal calibration scale-bar value (in µm) divided by the measured bar length in pixels.
Obtain the parcel-specific neurite length by multiplying the pixel count for that neurite in the given parcel by the physical pixel length and dividing the result by the average branch width in pixels.
-
Correct for the artifactual flattening of three-dimensional arbors into two-dimensional images by combining the parcel-specific length, lp, with the reported section thickness, ts, using Pythagoras’ formula:

where represents the final corrected length.
-
-
Determination of the axonal and dendritic path distances (Figure 4, Video 5)
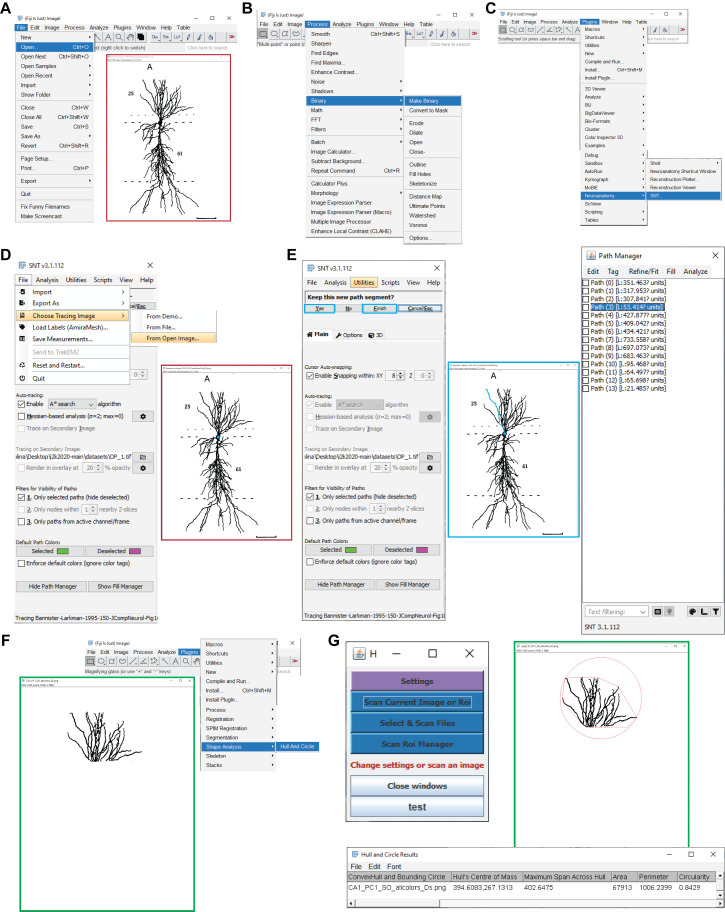
Open the original file with Fiji: File – Open – File source (Figure 4A).
Convert the image to binary: Process – Binary – Make Binary (Figure 4B).
Open the plugin “Simple Neurite Tracer:” Plugins – Neuroanatomy – SNT (Figure 4C).
Open the image in the SNT command window: File – Choose tracing image – From (Figure 4D).
Trace the distance along the dendrite/axon by clicking on the soma and at the end of the segment. If the tracing does not correspond with the structure, increase the accuracy by clicking multiple times along the segment: press y, and continue tracing along the path (Figure 4E).
Once the tracing is complete, move on to the next one by accepting the trace. Press F to finish the tracing.
The values are estimated in pixels (Path manager window, if values are not visible: tag – Morphometry – Length), so convert them to length using the pixel/length factor (Section 3, Figure 4E).
When all traces are done, save them for future reference. File – Export as – swc or traces.
-
Determining the convex hull volume from 2D reconstructions (Figures 4F and 4G, Video 6)
Open the generated segmented images that only contain axons or dendrites (PNG file) with Fiji: File – Open – File source.
Convert the image to binary: Process – Binary – Make Binary.
Open the plugin: Plugins – Shape Analysis – Hull And Circle (Figure 4F).
From the new window, select the option Scan current Image or Roi (Figure 4G).
A new window containing the results is generated (Hull and Circle Results, Figure 4G).
Save the results: File – Save as.
An image with the calculated hull volume is displayed. This image cannot be saved, but it provides information about how the resulting convex hull area was calculated (Figure 4G).
Convert the area measurements from pixel units to µm2 and multiply the resulting values by the reported slice thickness, assuming that the reconstruction is located in the middle of the slice.
-
Determining the convex hull volume from 3D reconstructions
Directly estimate the real volume using the 3D Convex Hull plugin.
-
Calculating the average number of synapses per neuronal pair.
-
Calculate the average number of synapses per pair of presynaptic and postsynaptic neurons, Ns, from their parcel-specific axonal and dendritic lengths, by separately estimating the number, Nsx, of axonal-dendritic overlaps in each parcel x ( Tecuatl et al., 2021 ). For any x, the value Nsx can be derived as the product of three factors:
The probability that presynaptic and postsynaptic elements occur within a given interaction distance, r, is the ratio between the volume of the interaction sphere, within which the two elements are found, and the volume of the entire parcel, Vx (Recipe 2).
The number of presynaptic elements (axonal boutons) in a given anatomical parcel is specified by the presynaptic axonal length in parcel x, Lax, divided by the average distance between consecutive presynaptic boutons, bd (Recipe 3; example files are accessible at hippocampome.org/php/data/Bio-protocol_sample_files.zip).
The number of postsynaptic elements (dendritic spines or shafts) in the same parcel is given by the postsynaptic dendritic length in x, Ldx, divided by the distance between postsynaptic elements, sd.
-
To calculate the average number of synapses per pair of presynaptic and postsynaptic neurons in a specific parcel, use the following formula:

The total count of synapses per directed neuron pair, Ns, is just the sum of the number per parcel, Nsx, over all parcels.
-
-
Calculate the number of contacts per connected pair.
-
Assume that a given pair of neurons forms at least a single synaptic contact, and calculate the expected number of additional contacts for that pair as:

where the volumetric ratio between the sphere defined by the radius of interaction r and Vo represents the chance of an encounter for any given pair of axonal boutons and dendritic spines or shafts, and Lax/bd and Ldx/sd correspond, respectively, to the number of axonal boutons and dendritic spines or shafts in parcel x.
-
Determine the volume of the intersection, Vo, by:

where Vdx and Vax are the dendritic and axonal convex hull volumes in parcel x.
-
Calculate the overall number of contacts per connected pair as the sum of the contacts in each parcel augmented by one, reflecting the initial assumption that the neuronal pair is connected:

where the symbol Σx represents the sum over all parcels.
-
-
Calculate the connection probabilities
-
Compute the connection probability for a pair of neuronal types in parcel x by dividing the average number of synapses per neuronal pair by the number of contacts per connected pair in the same parcel:

-
Determine the overall probability of connection for a pair of presynaptic and postsynaptic neurons in any parcel by the sum of inclusive events:

where the symbol Π x represents the product over all parcels.
-
Video 1. 2D image manipulation.
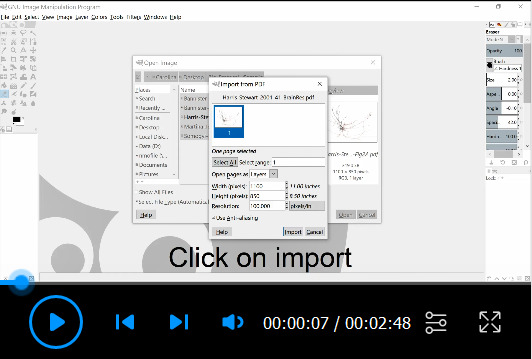
GIMP is used to selectively erase axons or dendrites from the various parcels to isolate them for later analysis.
Figure 2. Preprocessing of images for the quantitation of axonal and dendritic lengths. A.
The GIMP File menu is used to open an image file to be processed. B. Representative image is in preparation for processing ( Harris et al., 2001 ), where the red box delimits the toolbox location and the circle represents the eraser tool. C, D. Shown are processed images containing only dendrites (C) or axons (D) in all the layers of the region of interest (in this example, the subiculum), which were obtained from the original image shown in (B). E, F. Shown are representative images displaying only dendrites (E) or axons (F) in the parcel of interest (in this case, the stratum moleculare of the subiculum), which were obtained from the original image shown in (B).
Figure 3. Pixel counting. A1.
Shown is a MATLAB window with the open working folder “dir_QuantifyNeurites_v2” in a red box and the command window to run the command “convert” in a green box. A2. The displayed menu that appears after running the command “convert” to select the image to process. A3. The displayed menu options that appear in order to analyze the selected figure. B. Shown is a representative carousel mode, where the color number and the number of pixels present (B1) or absent (B2) are delimited within the blue boxes and where a final plot figure contains only the channels selected during the full run of the carousel mode. C. Presented are a histogram of the selected channels and the number of pixels per channel (C1) and the generated PNG files for the selected (C2) and unselected (C3) channels.
Video 2. Pixel count from 2D images.
A custom-made MATLAB program is used to count all pixels included in the 16 color channels of an image.
Video 3. Measuring a calibration bar in pixels.
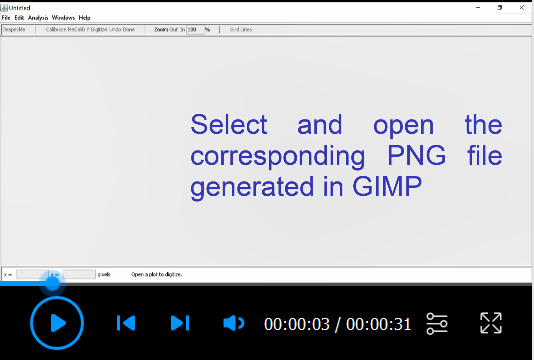
Plot Digitizer is used to measure the length in pixels of a neuronal reconstruction’s calibration bar. The X coordinates of the two ends of the calibration bar are recorded, and their difference is the final measurement in pixels.
Video 4. Neurite width estimation.
Plot Digitizer is used to estimate the widths of axons and dendrites in each layer containing portions of a neuronal reconstruction. Three examples are measured for each layer to obtain an average estimate of the neurite width per layer.
Figure 4. Determining the somatic distances and convex hull volumes. A.
Shown are the Fiji menu steps to open an image for path tracing (e.g., a CA1 pyramidal neuron; Bannister and Larkman, 1995). B. Displayed are the menu steps to convert the image into a binary image. C. Presented are the menu steps to run the Simple Neurite Tracer plugin. D. Shown are the Simple Neurite Tracer steps to load the open image for tracing. E. Presented is a representative Simple Neurite Tracer console that shows one path in blue (middle), with the options to finish the path and continue tracing on the console (left), and the path manager, with all the traces that correspond to the different parcels of the original image (right). F. Shown are the menu steps to run the Hull And Circle plugin for the dendrites located in the parcel of interest (e.g., CA1 stratum oriens; green box) for the convex hull measurement. G. The Hull And Circle toolbox (left) is used to scan the current image, where the image with the delimited area is shown in green and the bottom panel shows the emerging results window.
Video 5. Measuring somatic distance.
Fiji with the Simple Neurite Tracer plugin is used to measure the length in pixels from the soma to the end of the selected axon or dendrite. Three examples are measured for each type of neurite to determine the average.
Video 6. Convex hull estimation.

Fiji with the Hull and Circle plugin is used to measure the convex hull area in pixels from the region of interest in 2D neuronal reconstructions.
Data analysis
-
Calculate the standard deviation for the average number of synapses per neuronal pair using the mean and standard deviation from all measurements for the presynaptic axonal and postsynaptic dendritic lengths.
Compute the number of synapses for a given parcel x utilizing Equation (2) for Nsx.
Consider r, Vx, bd, and sd to be constants.
-
Calculate the standard deviation of Nsx by propagating the standard deviations of Lax and Ldx using the formulas for products and constants,


-
Determine the total number of synapses by summing across all parcels, and compute the associated standard deviation using the formula for sums,

-
Calculate the standard deviation for the number of contacts per connected pair using the mean and standard deviation from all measurements for the presynaptic axonal and postsynaptic dendritic lengths and for the convex hull volumes for the presynaptic axons and the postsynaptic dendrites.
-
Compute the number of contacts for a given parcel x utilizing Equation (3) for Ncx. Determine the standard deviation for the average volume of intersection using the formulas for sums and constants,


-
Calculate the standard deviation for the number of contacts for a given parcel x utilizing the formulas for products, quotients, and constants,


-
Determine the total number of contacts using Equation (5), and compute the associated standard deviation using the formula for sums,

-
-
Calculate the standard deviation for the connection probabilities for a pair of neuronal types in parcel x from Equation (6).
-
Compute the standard deviation for the connection probability using the formula for constants,

-
Determine the total connection probability from Equation (7),and calculate the associated standard deviation using the formulas for differences and products,


-
Notes
The accuracy of this procedure is limited by the incompleteness of axonal reconstructions and variability in neurite diameter.
This protocol can be used only for dendritic targeting connections: perisomatic connections cannot be estimated with this approach (but see Brown et al., 2012 for those cases).
The computation of standard deviation in the above Data Analysis are performed manually for each pair of neuronal types. The time required to carry out this operation by applying the provided formulas is negligible relative to the time required to trace the neurons from microscopic images.
Recipes
-
Neuronal reconstructions
Include representative two-dimensional neuronal tracings for each neuronal type from peer-reviewed publications based on the following inclusion criteria:
Reconstructions should be representative of the neuronal type. At least one axonal reconstruction per presynaptic neuron type and one dendritic reconstruction per postsynaptic type must be included.
Images should contain a calibration scale bar and clear demarcations of relevant layers and subregional boundaries. The latter is optional and only required for parcel-specific estimates.
For tracings including both axons and dendrites, the two neurite types must be unambiguously discernable. Likewise, in tracings including multiple neurons, each neurite type must be unambiguously ascribable to a single neuron.
Species (e.g., rat vs. mouse) and developmental stage (e.g., young vs. adult) should be consistent for all the neuronal types.
Thousands of neuronal reconstructions are also available through open access databases such as MouseLight (ml-neuronbrowser.janelia.org) for mouse, Mapzebrain (fishatlas.neuro.mpg.de/neurons) for zebrafish, FlyCircuit for drosophila (flycircuit.tw), Insect Brain Database for insects (insectbraindb.org), and NeuroMorpho.Org for over 60 different species ( Akram et al., 2018 ).
-
Volume estimations
We use the anatomical volumes for the mouse brain reported from the Blue Brain Cell Atlas (bbp.epfl.ch/nexus/cell-atlas). Other sources are suitable for different species, such as rat (scalablebrainatlas.incf.org/rat/PLCJB14), drosophila (v2.virtualflybrain.org), and zebrafish (fishatlas.neuro.mpg.de). Independent studies that report parcel-specific volume estimations can also be considered (e.g., Ropireddy et al., 2012 ). NOTE: differences in brain sizes have been reported between males and females as well as among strains ( Wang et al., 2020 ).
-
Ultrastructural parameters
Dendritic spine or shaft postsynaptic density distance and axonal inter-bouton distance can have huge variability among species, brain regions, and neuronal types. For greater accuracy, collect specific values from the literature for the synapses of interest (see e.g., the files at hippocampome.org/php/data/Bio-protocol_sample_files.zip for the examples used in this protocol description).
Acknowledgments
This work was supported in part by NIH grants R01NS39600 and U01MH114829. Carolina Tecuatl thanks the Consejo Nacional de Ciencia y Tecnología, México for providing fellowship 253060, allowing this project to start during her PhD training. This methodology was used in Tecuatl et al. (2021) “Comprehensive estimates of potential synaptic connections in local circuits of the rodent hippocampal formation by axonal-dendritic overlap.”
Competing interests
The authors declare no competing financial interests.
Ethics
All original data analyzed using this protocol were published previously in accordance with the authors’ respective ethics committees.
Citation
Readers should cite both the Bio-protocol article and the original research article where this protocol was used.
References
- 1. Akram M. A., Nanda S., Maraver P., Armananzas R. and Ascoli G. A.(2018). An open repository for single-cell reconstructions of the brain forest. Sci Data 5: 180006. [DOI] [PMC free article] [PubMed] [Google Scholar]
- 2. Ascoli G. A. and Atkeson J. C.(2005). Incorporating anatomically realistic cellular-level connectivity in neural network models of the rat hippocampus. Biosystems 79(1-3): 173-181. [DOI] [PubMed] [Google Scholar]
- 3. Bannister N. J. and Larkman A. U.(1995). Dendritic morphology of CA1 pyramidal neurones from the rat hippocampus: I. Branching patterns. J Comp Neurol 360(1): 150-160. [DOI] [PubMed] [Google Scholar]
- 4. Brown K. M., Sugihara I., Shinoda Y. and Ascoli G. A.(2012). Digital morphometry of rat cerebellar climbing fibers reveals distinct branch and bouton types. J Neurosci 32(42): 14670-14684. [DOI] [PMC free article] [PubMed] [Google Scholar]
- 5. Harris E., Witter M. P., Weinstein G. and Stewart M.(2001). Intrinsic connectivity of the rat subiculum: I. Dendritic morphology and patterns of axonal arborization by pyramidal neurons. J Comp Neurol 435(4): 490-505. [DOI] [PMC free article] [PubMed] [Google Scholar]
- 6. Moradi, K, Ascoli, GA. A comprehensive knowledge base of synaptic electrophysiology in the rodent hippocampal formation. Hippocampus. 2020; 30: 314– 331. [DOI] [PMC free article] [PubMed]
- 7. Longair M. H., Baker D. A. and Armstrong J. D.(2011). Simple Neurite Tracer: open source software for reconstruction, visualization and analysis of neuronal processes. Bioinformatics 27(17): 2453-2454. [DOI] [PubMed] [Google Scholar]
- 8. Rees C. L., Moradi K. and Ascoli G. A.(2017). Weighing the Evidence in Peters' Rule: Does Neuronal Morphology Predict Connectivity? Trends Neurosci 40(2): 63-71. [DOI] [PMC free article] [PubMed] [Google Scholar]
- 9. Ropireddy D. and Ascoli G. A.(2011). Potential Synaptic Connectivity of Different Neurons onto Pyramidal Cells in a 3D Reconstruction of the Rat Hippocampus. Front Neuroinform 5: 5. [DOI] [PMC free article] [PubMed] [Google Scholar]
- 10. Ropireddy D., Bachus S. E. and Ascoli G. A.(2012). Non-homogeneous stereological properties of the rat hippocampus from high-resolution 3D serial reconstruction of thin histological sections. Neuroscience 205: 91-111. [DOI] [PMC free article] [PubMed] [Google Scholar]
- 11. Tecuatl C., Wheeler D. W., Sutton N. and Ascoli G. A.(2021). Comprehensive estimates of potential synaptic connections in local circuits of the rodent hippocampal formation by axonal-dendritic overlap. J Neurosci 41(8): 1665-1683. [DOI] [PMC free article] [PubMed] [Google Scholar]
- 12. Wagner T. and Lipinski H.(2013). IJBlob: An ImageJ Library for Connected Component Analysis and Shape Analysis. J Open Res Softw 1(1): e6. [Google Scholar]
- 13. Wang N., Anderson R. J., Ashbrook D. G., Gopalakrishnan V., Park Y., Priebe C. E., Qi Y., Laoprasert R., Vogelstein J. T., Williams R. W. and Johnson G. A.(2020). Variability and heritability of mouse brain structure: Microscopic MRI atlases and connectomes for diverse strains. Neuroimage 222: 117274. [DOI] [PMC free article] [PubMed] [Google Scholar]


