Abstract
Background & Aims:
We have previously reported that the mitochondrial dicarboxylate carrier (mDIC) is predominantly expressed in the white adipose tissue (WAT) and subject to regulation by metabolic cues. The specific physiological functions of mDIC and the reasons for its abundant presence in adipocytes are however poorly understood.
Methods:
To systemically investigate the impact of mDIC function in adipocytes in vivo, we generated loss- and gain-of-function mouse models, selectively eliminating or overexpressing mDIC in mature adipocytes, respectively.
Results:
In in vitro differentiated white adipocytes, mDIC is responsible for succinate transport from the mitochondrial matrix to the cytosol, from where succinate can act on the succinate receptor SUCNR1 and inhibit lipolysis by dampening the cAMP-phosphorylated hormone-sensitive lipase (pHSL) pathway. We eliminated mDIC expression in adipocytes in a doxycycline (dox)-inducible manner (mDICiKO) and demonstrated that such a deletion results in enhanced adipocyte lipolysis and promotes high-fat diet (HFD)-induced adipocyte dysfunction, liver lipotoxicity, and systemic insulin resistance. Conversely, in a mouse model with dox-inducible, adipocyte-specific overexpression of mDIC (mDICiOE), we observed suppression of adipocyte lipolysis both in vivo and ex vivo. mDICiOE mice are potently protected from liver lipotoxicity upon HFD feeding. Furthermore, they show resistance to HFD-induced weight gain and adipose tissue expansion with concomitant improvements in glucose tolerance and insulin sensitivity. Beyond our data in rodents, we found that human WAT mDIC mRNA levels are positively correlated with insulin sensitivity and negatively correlated with intrahepatic triglyceride levels, suggesting a critical role of mDIC in regulating overall metabolic homeostasis in humans as well.
Conclusions:
In summary, we highlight that mDIC plays an essential role in governing adipocyte lipolysis and preventing liver lipotoxicity under a HFD challenge.
Keywords: NAFLD, NASH, lipotoxicity, insulin resistance, adipocytes, lipolysis, mitochondria, dicarboxylate carrier, succinate
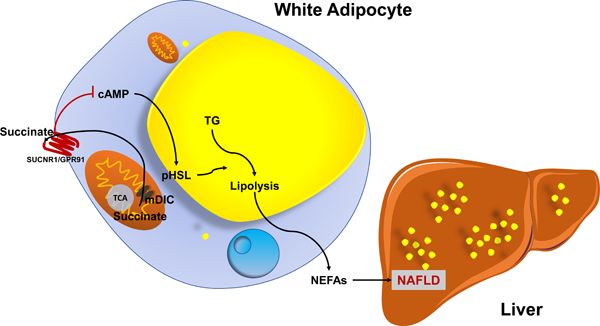
Graphical Abstract
Lay Summary
Dysfunctional fat tissue plays an important role in the development of fatty liver disease and liver injury. Our present study identifies a mitochondrial transporter, mDIC, that tightly controls the release of free fatty acids from adipocytes to the liver through the export of succinate from mitochondria. We believe this mDIC-succinate axis has potential as an area for therapeutic intervention in fatty liver disease.
Introduction
Nonalcoholic fatty liver disease (NAFLD) affects one third of the adult population in the United States[1] and its prevalence is increasing worldwide[2]. NAFLD represents a spectrum of liver diseases ranging from relatively benign liver steatosis (lipid accumulation in hepatocytes), to nonalcoholic steatohepatitis (NASH; hepatocyte injury, inflammation, and fibrosis), to cirrhosis[3, 4].
A hallmark of NAFLD is excessive lipid accumulation in hepatocytes. The sources of hepatic lipids are diverse. One of the sources for hepatic lipid accumulation are non-esterified fatty acids (NEFAs) released by lipolysis from dysfunctional adipose tissue (AT). Other important sources also include de novo lipogenesis in the liver[5]. The increased lipid content in the liver causes hepatocyte damage as well as portal and lobular inflammation, promoting a progression from steatosis to NASH. Thus, upon overnutrition, full functional integrity of the adipocyte has to be warranted, associated with a tight control of lipolysis in adipose tissue, which is key to reducing circulating NEFA levels, thereby reducing liver steatosis[6]. So far, insulin is the best characterized and the most robust endogenous suppressor of adipocyte lipolysis. The tricarboxylic acid (TCA) cycle intermediate succinate was also reported to exert an anti-lipolytic effect in adipocytes[7], however, crucial regulators impacting adipocyte succinate levels remain unknown.
We previously reported the identification of the mammalian mitochondrial dicarboxylate carrier (mDIC, encoded by Slc25a10) that is predominantly expressed in the white adipose tissue (WAT). Levels of mDIC were subjected to regulation by different metabolic challenges[8]. The general function of mDIC is to mediate the transport of malonate, malate, and succinate in exchange for phosphate, sulphate, sulphite, or thiosulphate from mitochondria to the cytosol[9], which contributes to de novo lipogenesis in hepatocytes[10] and glucose-stimulated insulin secretion in pancreatic β-cells[11]. However, the specific physiological role of mDIC in adipocytes remains unknown.
In the present study, we report an essential role of mDIC in suppressing adipocyte lipolysis. It reduces the flux of NEFAs to the liver and thus curbs liver lipotoxicity. We initially observe a positive correlation between mDIC expression in adipocytes and systemic insulin sensitivity, as well as an inverse correlation between adipose mDIC expression and intrahepatic triglyceride levels in human subjects. We subsequently demonstrate in our mouse models that mDIC is responsible for succinate transport out of mitochondria to suppress white adipocyte lipolysis, dampening the cAMP-phosphorylated hormone-sensitive lipase (pHSL) pathway in a succinate receptor 1 (SUCNR1)-dependent manner. Through adipocyte-specific deletion or overexpression of mDIC we further substantiate that mDIC is essential and sufficient to regulate NEFA release from adipocytes, liver lipotoxicity, and systemic insulin sensitivity.
Materials and Methods
Animal models
All animal experiments were conducted using littermate-controlled male mice at an age of 8–10 weeks, except for the isolation of SVF for which mice at an age of 4–6 weeks were used. Mice were maintained on a C57BL/6J background and housed in a barrier specific pathogen-free animal facility with a 12-hour dark-light cycle and free access to water and food. If not indicated otherwise, mice were fed standard chow diet (#5058). Doxycycline (dox)-containing pellet chow diet (600 mg/kg; S4107) was utilized to induce mDIC deletion or overexpression. For HFD challenge experiments with dox induction, mice were fed a paste diet with 60% calories from fat supplemented with 600 mg/kg diet dox (S7067, Bio-Serv). For the experimental cohorts on special diets, both control as well as loss- and gain-of function mice were fed the same diet to control for the impact of the dox.
Inducible adipocyte mDIC deletion mouse model (mDICiKO): we generated an adipocyte-specific mDIC knockout mouse model by crossing adiponectin (Adipoq) promoter driven-reverse tetracycline-dependent transcriptional activator (rtTA) transgenic mice and tetracycline responsive element-Cre transgenic mice (TRE-Cre; B6.Cg-Tg(tetO-cre)1Jaw/J, No. 006234, JAX) with mDICflox/flox mice made in the UT Southwestern Transgenic Core.
Inducible adipocyte mDIC overexpression mouse model (mDICiOE): we also generated an adipocyte-specific mDIC (NCBI Reference Sequence: NM_013770.2) overexpression by crossing Adipoq-rtTA with TRE-mDIC transgenic mice.
All animal experiments and procedures were approved by the Institutional Animal Care and Use Committee (IACUC) of The UT Southwestern Medical Center at Dallas, Texas (APN# 2015–101207).
Statistics
All data are presented as means ± SEM of biological replicates. GraphPad Prism 8.4.3 (GraphPad Software, Inc., La Jolla, CA, USA) was used for statistical analyses. Pearson correlation analyses were used to compute correlation coefficients. Two-tailed Student’s t-tests were used for comparisons between two independent groups. One-way analyses of variance (ANOVAs) followed by Tukey post-tests were used for comparisons between more than two independent groups. Differences between two groups over time were analyzed by two-way ANOVAs followed by Tukey post-tests to compare replicate means in each timepoint. P<0.05 was considered statistically significant.
For further detailed materials and methods, please refer to the CTAT Table and Supplementary information.
Results
mDIC is reduced in individuals with insulin resistance and people with NAFLD.
To explore the relevance of mDIC expression in human metabolic diseases, we examined WAT expression of mDIC in individuals with insulin resistance. By evaluating human gene expression databases, we found that mDIC levels in subcutaneous WAT (sWAT) were substantially down-regulated in people with insulin resistance (Figs. 1A–B) [13–15]. Another study conducted in diabetic and control patients (GSE16415) showed that mDIC was decreased with diabetes progression (Fig. 1C). We further identified a positive correlation between WAT mDIC mRNA levels and insulin sensitivity in people with obesity, as reflected by increased rates of glucose infusion (GIR) and glucose disposal during a hyperinsulinemic–euglycemic clamp procedure (Figs. 1D–E). More importantly, in an independent study involving individuals with or without NAFLD (Fig. S1), human WAT mDIC expression shows an inverse relationship with intrahepatic triglyceride content (Fig. 1F). These findings demonstrate that decreased mDIC expression in WAT is associated with insulin resistance and NAFLD development in humans. Consistent with these human studies, we analyzed mDIC mRNA levels in our previously reported mouse model of healthy AT expansion[16]. We observed that mDIC expression was substantially higher in massively expanded, but healthy AT compared to expanded, unhealthy AT in different fat pads, including sWAT, visceral WAT (vWAT), mesenteric WAT (mWAT), and brown AT (BAT) in male and female mice (Fig. 1G).
Fig. 1. mDIC is reduced in individuals with insulin resistance and people with NAFLD.
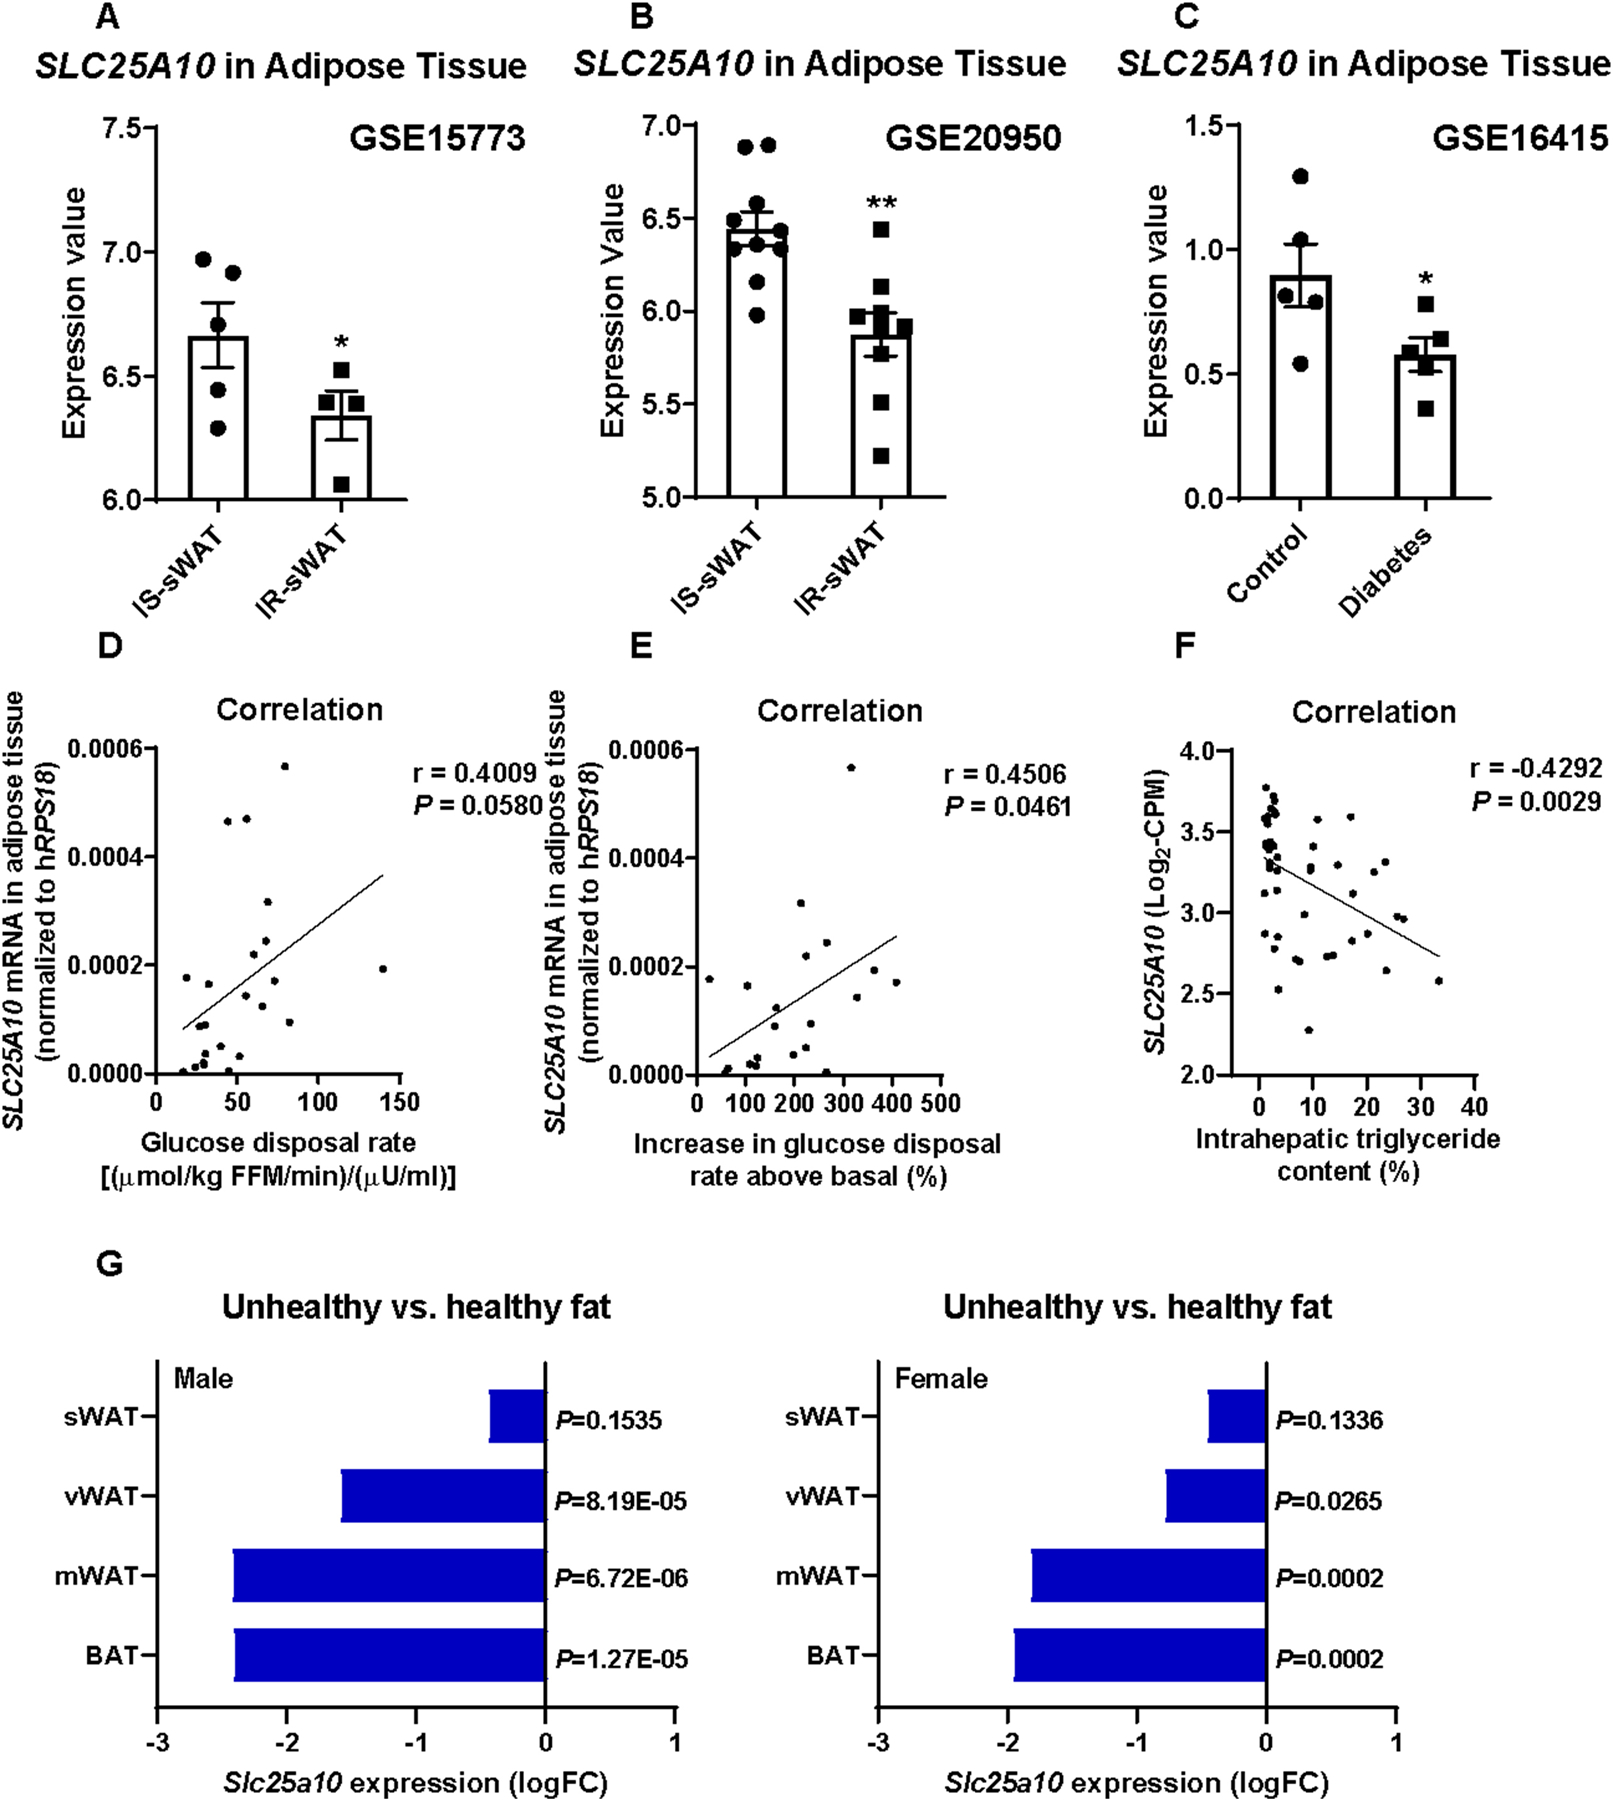
(A-C) mDIC (SLC25A10) expression from human gene expression databases: (A) mDIC levels in sWAT from insulin sensitive (IS, n=5) and insulin resistant (IR, n=4) people, (B) from another study in IS (n=10) and IR (n=9) patients, and (C) from control or diabetic humans (n=5). (D-F) Correlation between sWAT mDIC (SLC25A10) mRNA levels and human insulin sensitivity (D-E, n=23), and intrahepatic triglyceride levels (F, n=46). FFM: fat free mass. (G) mDIC (Slc25a10) mRNA levels in fat tissues from unhealthy and healthy AT (n=3). Fold change (FC) and P-value are shown. Data are presented as mean ± SEM of biologically independent samples. *P<0.05, **P<0.01. Two-tailed Student’s t-test (A-C, G); Pearson correlation analysis for correlation coefficient (r) and two-tailed P-value (D-F).
Adipocyte-specific deletion of mDIC impairs succinate transport.
To directly examine the impact of mDIC on adipocyte function, we eliminated mDIC in a doxycycline (dox)-inducible and tissue-specific manner in adipocytes (mDICiKO) (Fig. 2A). The successful deletion of mDIC in adipose tissues was validated on mRNA and protein levels (Figs. 2B–C). As a key member of the mitochondrial carrier family, we hypothesized that elimination of mDIC substantially impairs mitochondrial function in adipocytes. To assess this, we utilized a Seahorse instrument to perform mitochondrial respiration assays on sWAT cultured ex vivo (Fig. 2D) and isolated sWAT mitochondria in vitro (Fig. 2E). These assays demonstrated a significant decline in both basal and maximal respiration upon mDIC deletion.
Fig. 2. Adipocyte-specific deletion of mDIC impairs succinate transport.
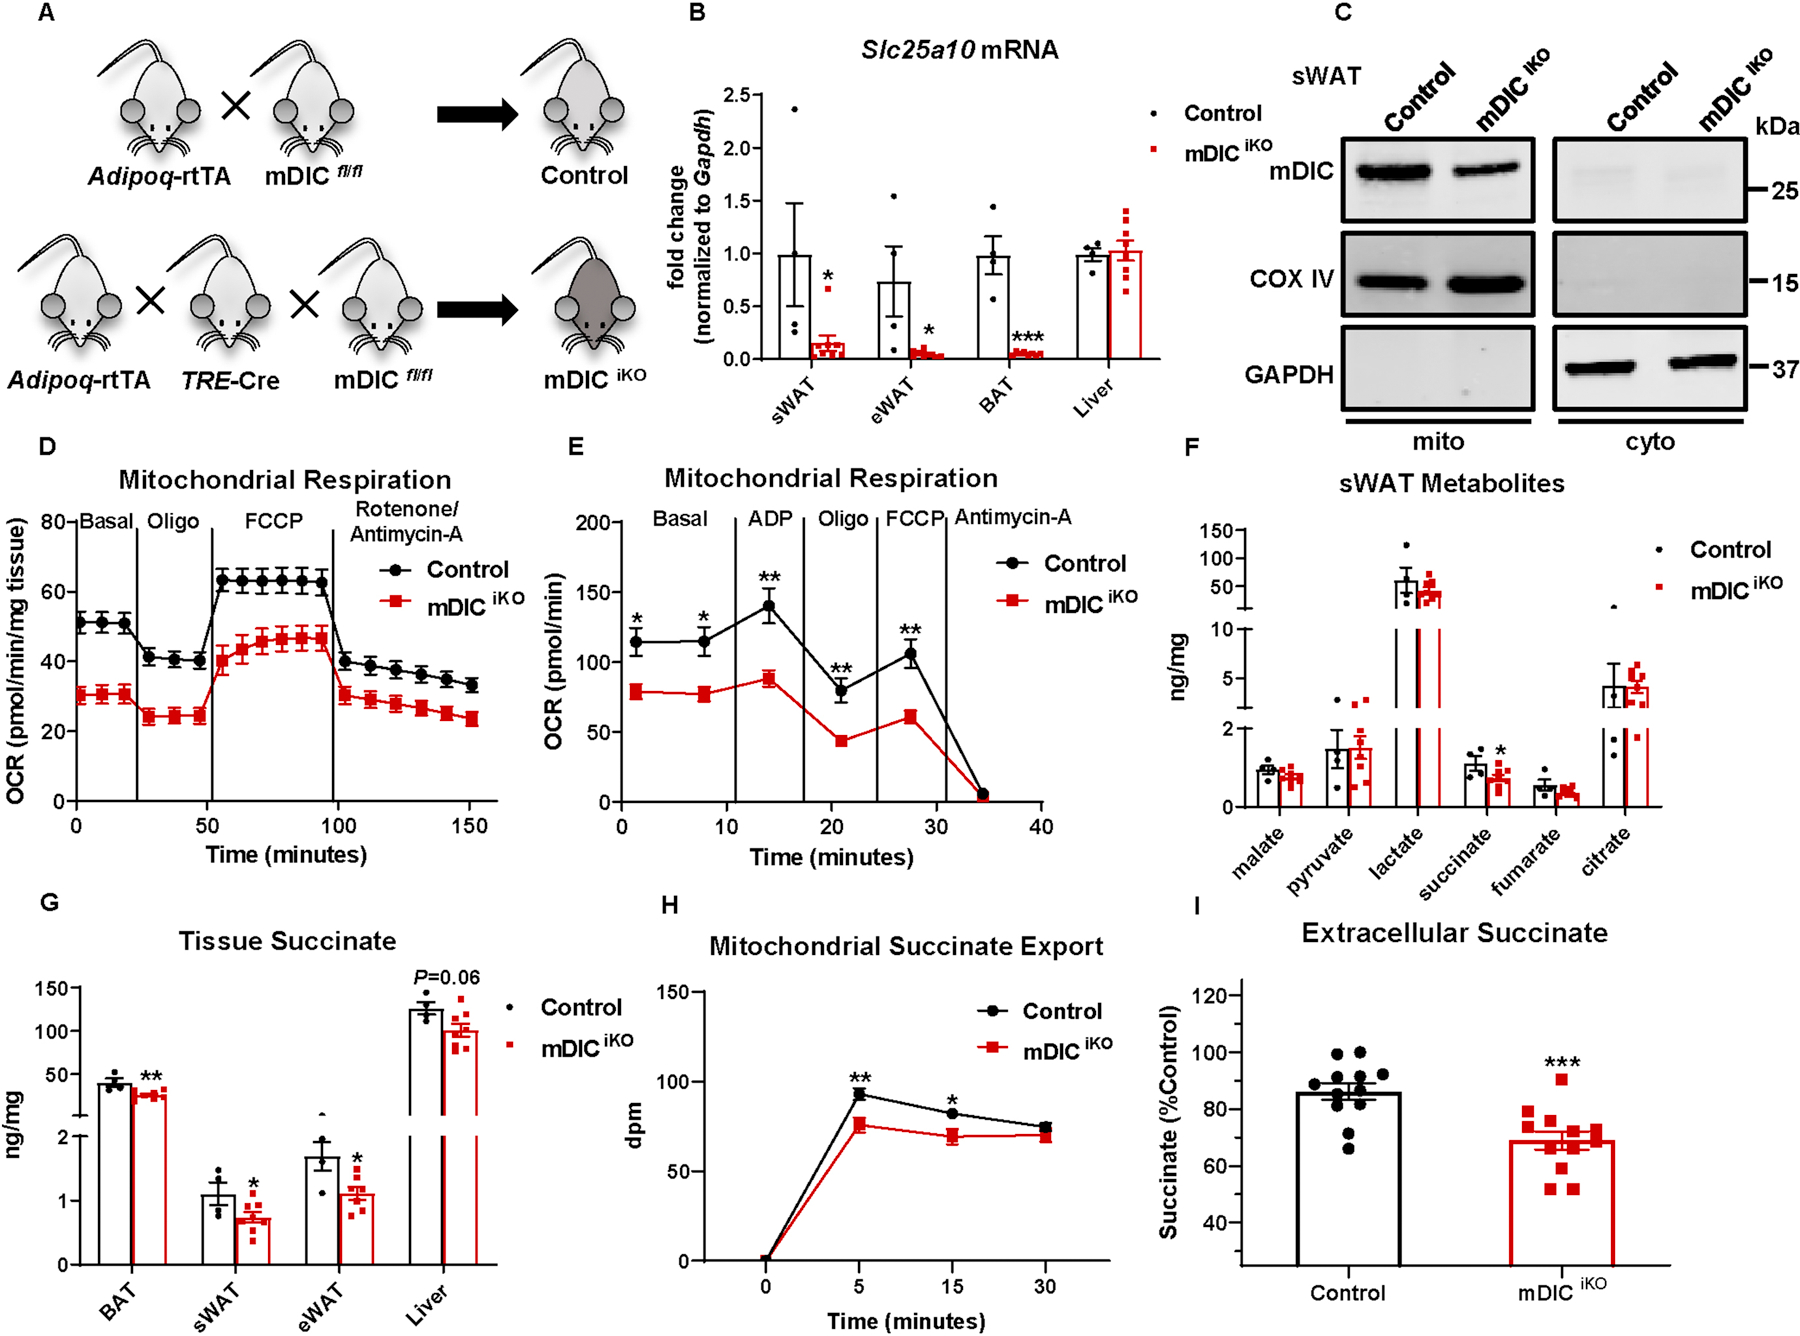
(A) Schematic illustration of the adipocyte-specific, dox-inducible mDIC knockout mouse (mDICiKO). (B-C) Validation of mDIC deletion in mDICiKO mice: (B) mDIC mRNA levels (n=4 (Control) or n=8 (mDICiKO)) and (C) mDIC protein levels in mitochondria (mito) and cytosol (cyto) from sWAT. (D-E) ex vivo mitochondrial respiration in sWAT (D) and in vitro respiration in isolated mitochondria (E, 5 μg proteins). Oxygen consumption rate (OCR) at basal level and post-ADP, Oligomycin (Oligo), FCCP and Rotenone/Antimycin-A injection is shown, n=5. (F-G) TCA cycle intermediate levels in sWAT (F) and succinate levels in different tissues (G), n=4 (Control) or n=8 (mDICiKO). (H) Succinate export from mitochondria from control or mDICiKO mice, n=6. (I) Extracellular succinate levels from in vitro differentiated adipocytes. 5 μg/mL dox was utilized to induce deletion of mDIC. Percentages relative to control are shown. Data are presented as mean ± SEM of biologically independent samples. *P<0.05, **P<0.01, ***P<0.001. Two-tailed Student’s t-test (B, F-G, I); Two-way ANOVA followed by a Tukey post-test (D-E, H).
It is well appreciated that the molecular function of mDIC is to facilitate the transport of the TCA cycle intermediates malate and succinate from the mitochondria to the cytosol. To better understand how the absence of mDIC in adipocytes impairs mitochondrial function, we explored changes in TCA cycle metabolites from sWAT. Surprisingly, among all TCA cycle intermediates measured, only succinate stood out as an intermediate with markedly changed levels, and mDIC deletion caused a reduction in succinate levels in sWAT (Fig. 2F). Beyond sWAT, the lack of mDIC also resulted in a decline in succinate levels in epidydimal WAT (eWAT) and BAT (Fig. 2G). Furthermore, by employing a multiplex mitochondrial substrate utilization assay, we profiled the mitochondrial function in response to different TCA cycle intermediates in control and mDICiKO adipocytes. We observed that mDIC deletion caused an obvious reduction in mitochondrial function, as assessed by decreased NADH/FADH2 production from catabolic pathways and oxidation via the electron transport chain when pyruvate or succinate were supplied as substrate (Figs.S2A–B). Notably, a significant up-regulation in the utilization of malate was observed in mDICiKO adipocytes, suggesting the transport of malate remains intact after mDIC deletion in adipocytes.
To directly investigate the impact of the lack of mDIC on succinate transport, we performed a transport assay using radiolabeled succinate. We found that in mitochondria isolated from the mDICiKO WAT, the export of succinate was substantially diminished (Fig. 2H). Furthermore, a reduction in extracellular succinate levels was observed in mDICiKO adipocytes in vitro (Fig. 2I). Overall, our results demonstrate that deletion of mDIC in adipocytes impairs mitochondrial function and reduces the export of succinate out of mitochondria.
A lack of mDIC abolishes succinate-driven inhibition of adipocyte lipolysis and leads to exacerbated liver lipotoxicity.
We wanted to determine the cellular and organismal impact of reduced succinate transport capacity upon mDIC deletion in the adipocyte. In white adipocytes, succinate also serves as an anti-lipolytic factor through inhibition of the cAMP-pHSL signaling pathway[7] (Fig. 3A). We thus hypothesized that the deletion of mDIC results in unrestrained lipolytic activity, and a secondary deterioration of systemic metabolism. We indeed observed significantly enhanced intracellular cAMP levels upon mDIC deletion (Fig. 3B). Strikingly, in mDICiKO adipocytes, a phosphorylation of HSL persisted even in the absence of the adenylate cyclase stimulator forskolin (Fig. 3C). Consistent with an enhanced activity of the cAMP-pHSL pathway, ex vivo and in vivo lipolysis assays (Figs. 3D–E) demonstrated that mDIC deletion led to enhanced lipolytic effects in response to forskolin stimulation or exposure to the β3-adrenergic receptor agonist CL-316,243. In addition, our ex vivo lipolysis assays demonstrated that both basal glycerol and NEFA release were increased from mDICiKO fat pads (Figs. S3A–B). Feeding mDICiKO mice a dox-HFD for 8 weeks indeed caused a stable elevation of serum NEFAs, but unaltered serum triglyceride levels (Fig. 3F).
Fig. 3. A lack of mDIC abolishes succinate-driven inhibition of adipocyte lipolysis and leads to exacerbated liver lipotoxicity.
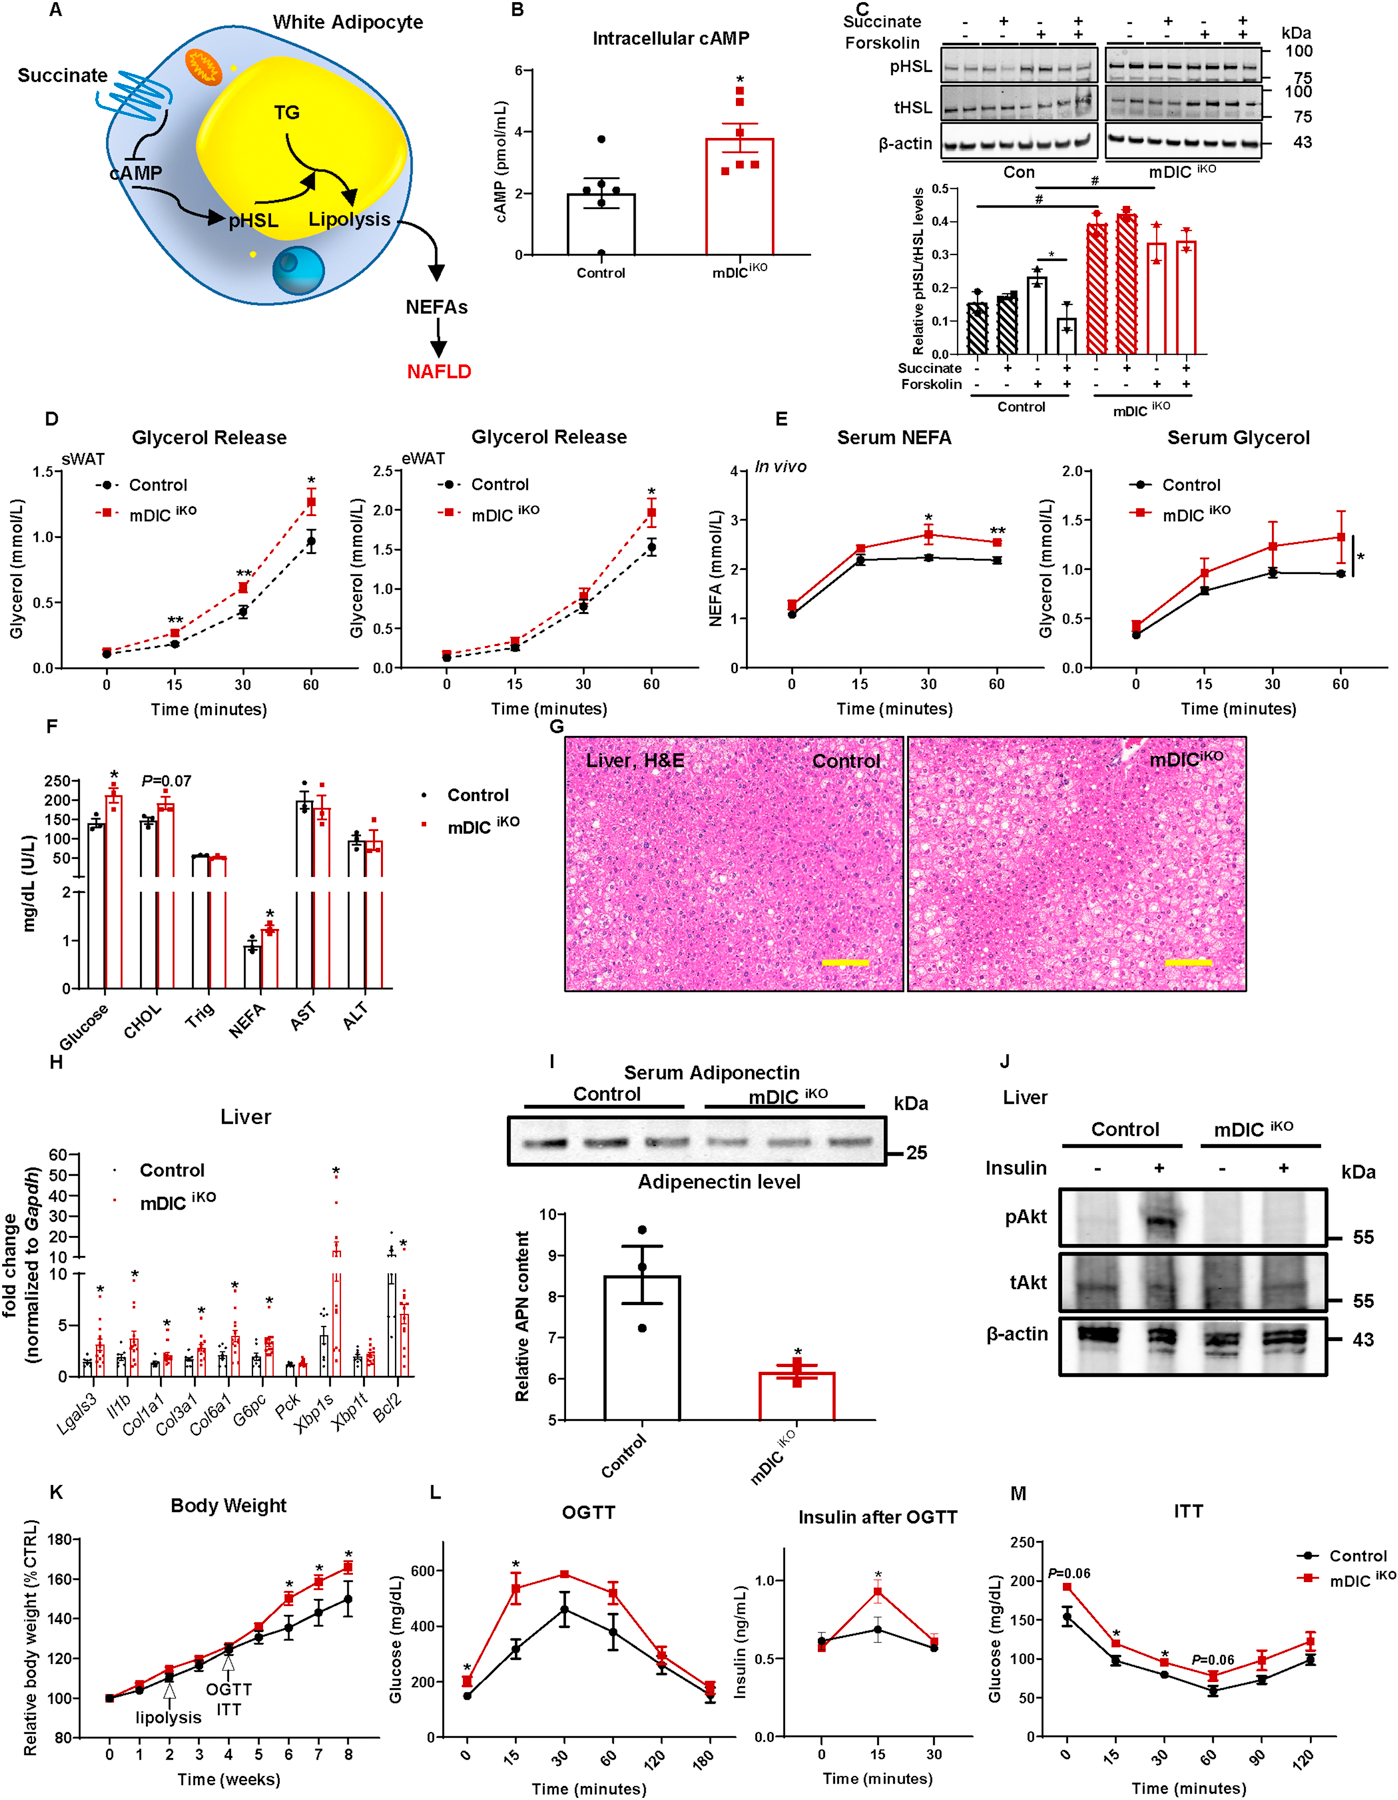
(A) The model of succinate controlling white adipocyte lipolysis and NEFA release. (B) Intracellular cAMP levels in in vitro differentiated adipocytes, n=12. (C) Western blotting image and its quantification (n=2) for pHSL levels in adipocytes treated with 50 μM succinate with or without 10 μM forskolin. (D-E) ex vivo (D, n=6) and in vivo (E, n=5) lipolysis analyses in control and mDICiKO mice. (F-M) Control and mDICiKO mice were subjected to the following metabolic analyses: (F) Serum profiling (n=3); (G) H&E staining images of liver tissues (bar = 161 μm); (H) Selective inflammation, fibrosis, gluconeogenesis, ER stress, and apoptosis related gene expression in the liver, n=8 (Control) or n=13 (mDICiKO); (I) Circulating adiponectin levels (n=3); (J) p-AKT (Ser 473) and total AKT expression in the liver after saline or insulin injection (i.v.) for 5 min (n=3); (K) Relative body weight; (L-M) glucose and insulin levels from (L) OGTT and (M) ITT experiments, n=4 (Control) or n=9 (mDICiKO). For all the statistics: data are presented as mean ± SEM of biologically independent samples. *P<0.05; #P<0.05. Two-tailed Student’s t-test (B, F, H-I); Two-way ANOVA followed by a Tukey post-test (C-E, K-M).
When adipocytes start to release an excess of free fatty acids into the bloodstream, the liver turns into a compensatory sink for the uptake and storage of these extra lipids[17]. However, the overwhelming NEFA influx into the liver also causes lipotoxicity, ultimately resulting in NAFLD. We therefore examined the histological changes in the liver of mDICiKO mice fed a dox-HFD and noticed an obvious fatty liver phenotype (Fig. 3G). In addition to the morphological lipid accumulation, genes involved in liver inflammation (Lgals3 (Mac-2) and Il1b), fibrosis (Col1a1, Col3a1, and Col6a1), gluconeogenesis (G6pc), and endoplasmic reticulum (ER) stress (Xbp1s) were all substantially up-regulated upon mDIC deletion. The anti-apoptotic molecule Bcl-2 was significantly down-regulated (Fig. 3H). These results support a possible role of adipocyte-specific deletion of mDIC in the pathological events leading to NASH in mDICiKO mice. As NASH is usually associated with insulin resistance[4], we also examined changes in the levels of adiponectin, an adipokine that bridges AT and the liver by acting as an insulin sensitizer[18, 19]. We observed a marked decrease in circulating adiponectin upon mDIC deletion (Fig. 3I), as well as a dramatically blunted AKT phosphorylation (pAKT) in the livers of mDICiKO mice in response to insulin injections (Fig. 3J). Moreover, we studied systemic metabolic changes. Starting at week 6 of dox-HFD feeding, mDICiKO mice exhibited increased body weights (Fig. 3K). Notably, even at week 4, before the divergence of body weights, mDICiKO mice already displayed substantial glucose intolerance and insulin resistance (Figs. 3L–M) as judged by OGTTs and ITTs, respectively. Furthermore, AT in mDICiKO mice displayed changes reflecting dysfunction, such as a significantly larger adipocyte size and enhanced inflammatory cell infiltration in both sWAT and eWAT (Figs. S4A–B). At the transcriptional level, a significant increase in inflammatory markers (Il1b and Nos2) and fibrotic factors (Lox, Tgfb1, Col3a1, Col6a1, and Fn1) was apparent upon mDIC deletion (Fig. S4C). However, genes involved in lipolysis remained unaltered (Fig. S4D).
A sustained lack of mDIC in adipocytes exacerbates hepatic steatosis, steatohepatitis, and fibrosis.
To provide more compelling evidence supporting that the deletion of mDIC in adipocytes leads to NAFLD development, we subjected both control and mDICiKO mice to a longer period to dox-HFD feeding for 14 weeks and conducted a detailed determination of hepatic steatosis, steatohepatitis, and fibrosis. Compared to control mice, mDICiKO mice showed significantly accumulated triglycerides in the liver (Fig. 4A) and elevated aspartate aminotransferase (AST) and alanine aminotransferase (ALT) levels in the serum (Fig. 4B). The NAFLD activity score (NAS) assessed through H&E stained liver sections by a pathologist blinded to the genotypes of the samples, demonstrated a markedly higher extent of liver steatosis, inflammatory cell infiltration, and hepatocellular ballooning in mDICiKO mice (Figs. 4C–D). We furthermore observed an increased number in F4/80 positive cells (Fig. 4E) by immunofluorescence staining, suggesting an enhanced inflammatory phenotype (including both Kupffer cells and infiltrated macrophages) in the mDICiKO livers. Among these F4/80 positive cells, an activation of pro-inflammatory markers and a downregulation of anti-inflammatory markers were detected in mDICiKO mice via flow cytometry analyses (Fig. 4F) and gene expression analyses for inflammatory markers (Fig. 4G). Last but not least, upon a prolonged HFD challenge, mDICiKO mice displayed dramatic collagen deposition in the liver, as assessed by picrosirius red staining (Fig. 4H), implicating a pronounced activation of the fibrotic program.
Fig. 4. A sustained lack of mDIC in adipocytes exacerbates hepatic steatosis, steatohepatitis, and fibrosis.
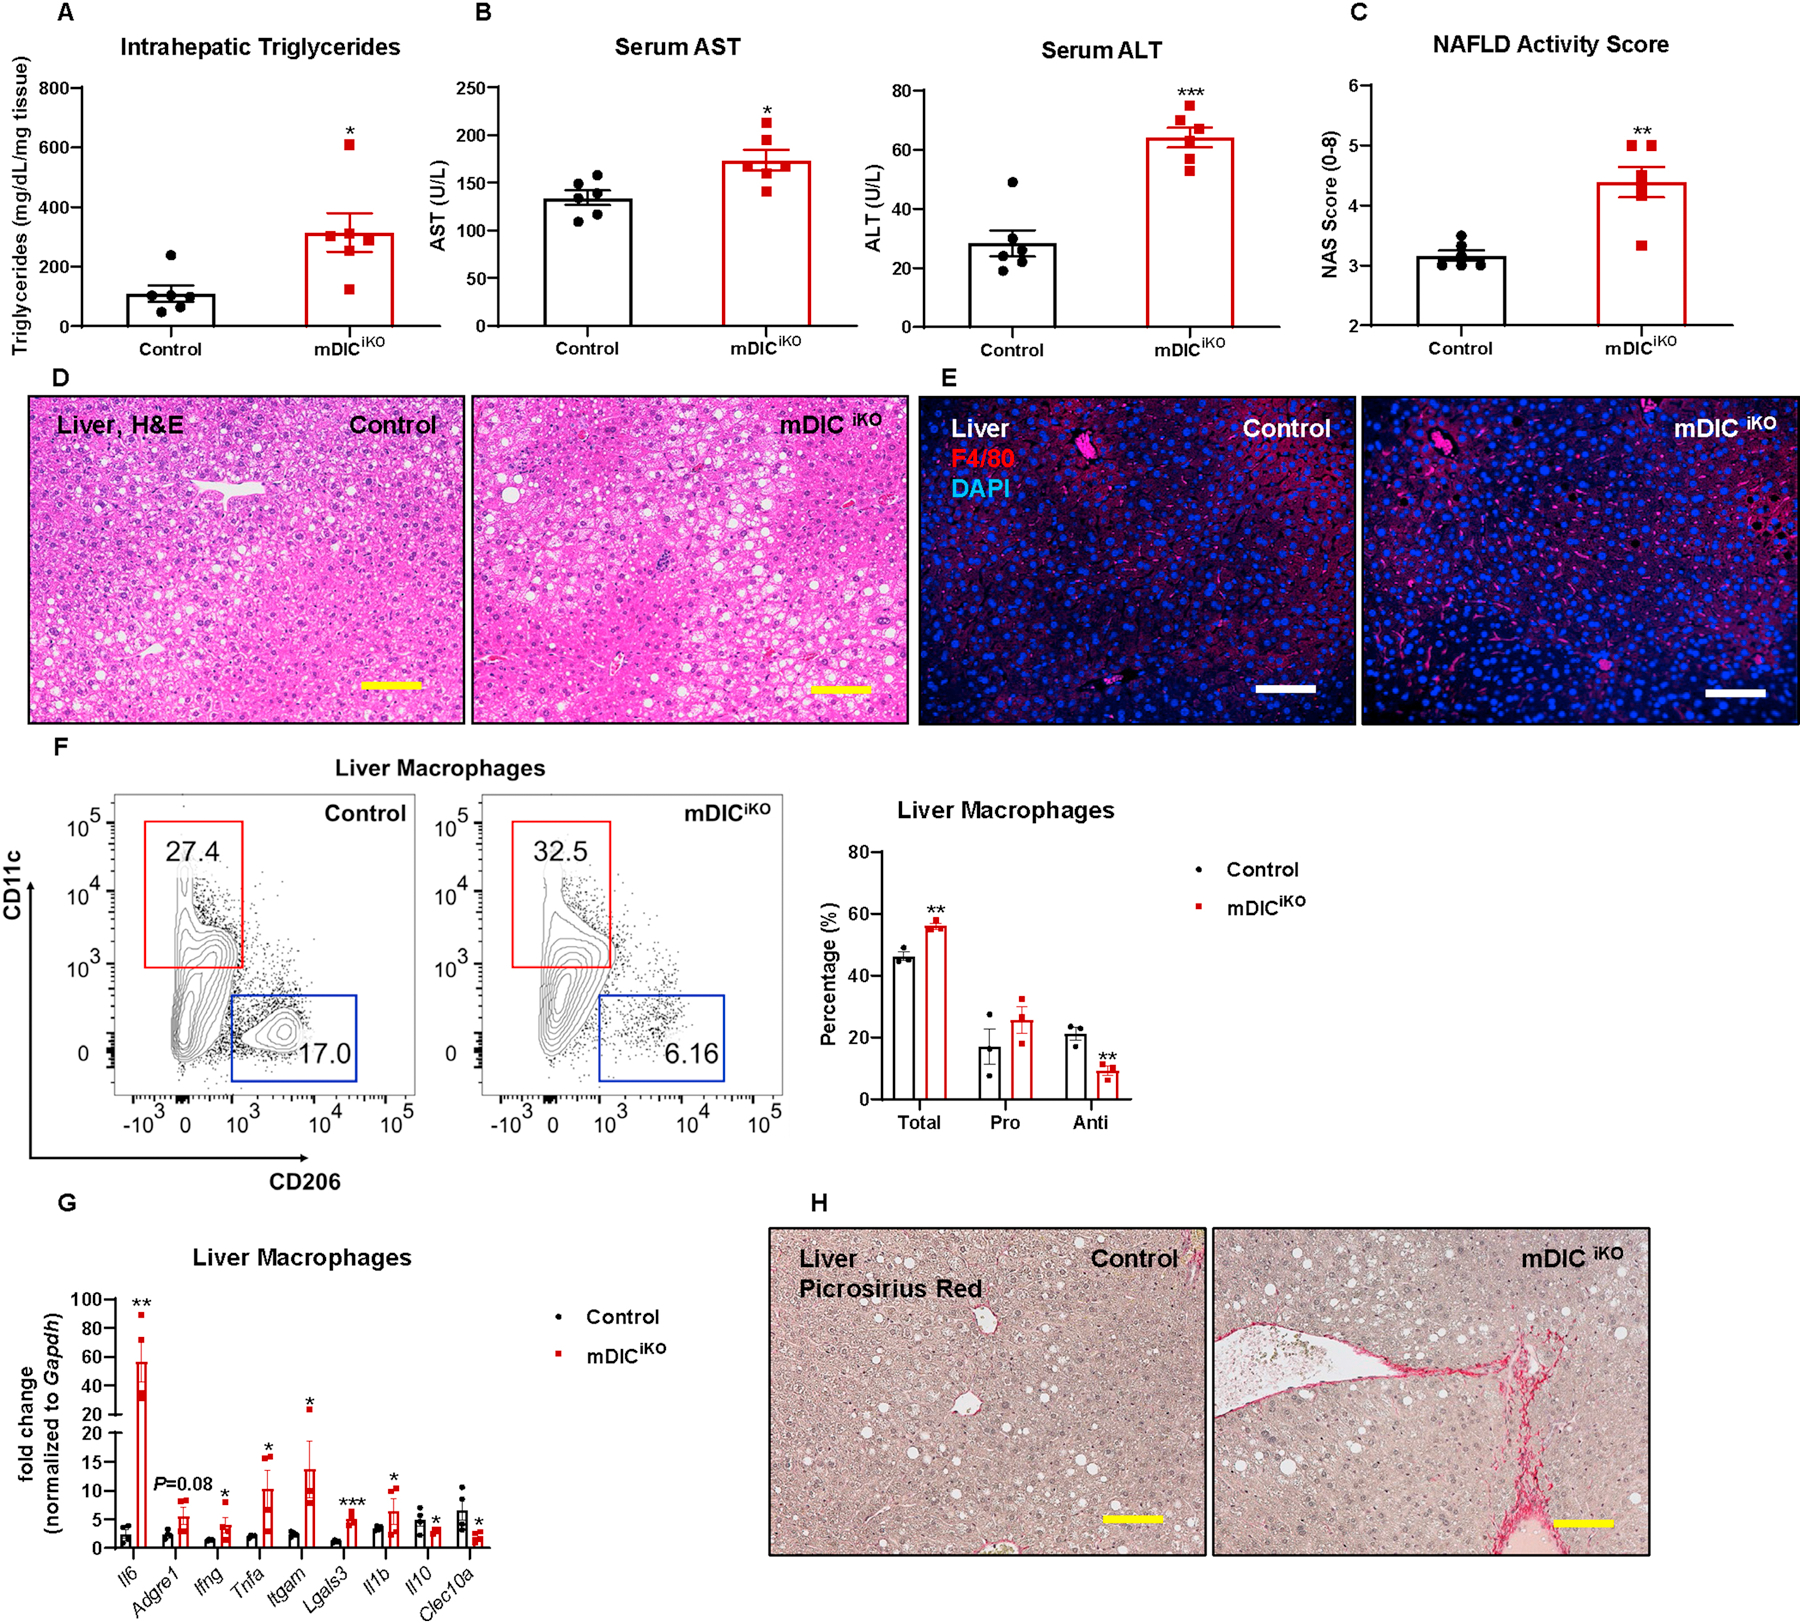
In control or mDICiKO mice fed with dox-HFD for 14 weeks: (A) Intrahepatic triglyceride levels; (B) serum AST and ALT levels; (C) NAFLD activity score (NAS) (n=6); (D-E) H&E staining (D) and F4/80 immunofluorescence staining (E) images of liver tissues (bar = 161 μm); (F) Flow cytometry density plot and statistics demonstrating the relative percentage of pro- and anti-inflammatory macrophages in the liver (n=3); (G) Selective inflammation related gene expression in liver macrophages (n=4); (H) Picrosirius red staining images of liver sections (bar = 161 μm). For all the statistics: data are presented as mean ± SEM of biologically independent samples. *P<0.05, **P<0.01, ***P<0.001. Two-tailed Student’s t-test (A-C, F-G).
Taken together, these short-term and long-term HFD challenge findings reveal that the lack of mDIC suppresses succinate export from mitochondria. The resulting lower succinate levels cause a reduced ability of the adipocyte to suppress lipolysis, thereby leading to enhanced NEFA release, increased liver lipotoxicity, and exacerbated systemic insulin resistance.
To further establish the relevance of mDIC function in adipocytes and NAFLD development in the liver in the context of human disease, we performed an in vitro co-culture assay utilizing primary human hepatocytes and in vitro differentiated adipocytes. As seen in Fig. S5, it is clear that human hepatocytes co-cultured with mDICiKO adipocytes displayed enhanced lipid content, as assessed by Oil Red O staining (Figs. S5A–B) and measurement of triglyceride content (Fig. S5C), in either the basal or a forskolin-stimulated state. In addition, pretreatment of adipocytes with the adipose triglyceride lipase (ATGL) inhibitor, Atglistatin, resulted in a significantly blunted lipid accumulation in human hepatocytes in both groups, suggesting that hepatic lipid accumulation is highly dependent on lipolysis in adipocytes.
From a therapeutic view, we hypothesized that by substituting for the lack of cytoplasmic succinate in mDICiKO mice, we may be able to rescue the observed metabolic abnormalities. As displayed in Fig. S6A, succinate supplementation resulted in a slight decrease in body weight in control mice. In contrast, body weight remained comparable in mDICiKO mice with or without succinate administration. Despite the lack of an effect on body weight, succinate supplementation evoked substantial improvements in glucose tolerance in both control and mDICiKO mice (Figs. S6B–C), suggesting that supplying succinate to mice rescues the adipocyte succinate export deficiency caused by mDIC deletion and corrects systemic metabolic dysregulation.
Adipocyte-specific overexpression of mDIC promotes succinate transport.
To further establish that mDIC is not only a necessary but also sufficient modulator of adipocyte lipolysis and function, we generated a dox-inducible and tissue-specific overexpression model for mDIC in adipocytes (mDICiOE) (Fig. 5A). Upon feeding of a dox-containing diet, we demonstrated a significant elevation of mDIC mRNA and protein levels in AT (Figs. 5B–C). In contrast to the mDIC deletion model, mDIC overexpression substantially enhanced mitochondrial respiration as assessed by mitochondrial respiration assays on sWAT cultured ex vivo and isolated sWAT mitochondria in vitro (Figs. 5D–E). Furthermore, among all the TCA cycle intermediates measured, mDIC overexpression specifically impacted succinate and significantly up-regulated succinate levels in sWAT (Figs. 5F–G). When we profiled the mitochondrial function in response to different TCA cycle intermediates in control and mDICiOE adipocytes, we observed an obvious increase in mitochondrial functionality to utilize various TCA cycle metabolites as substrates (Figs.S7A–B). Notably, mDICiOE adipocytes were particularly sensitive to succinate, showing the most significant enhancement in mitochondrial respiration compared to control cells and the highest NADH/FADH2 production/oxidation compared to other substrates when adding succinate.
Fig. 5. Adipocyte-specific overexpression of mDIC promotes succinate transport.
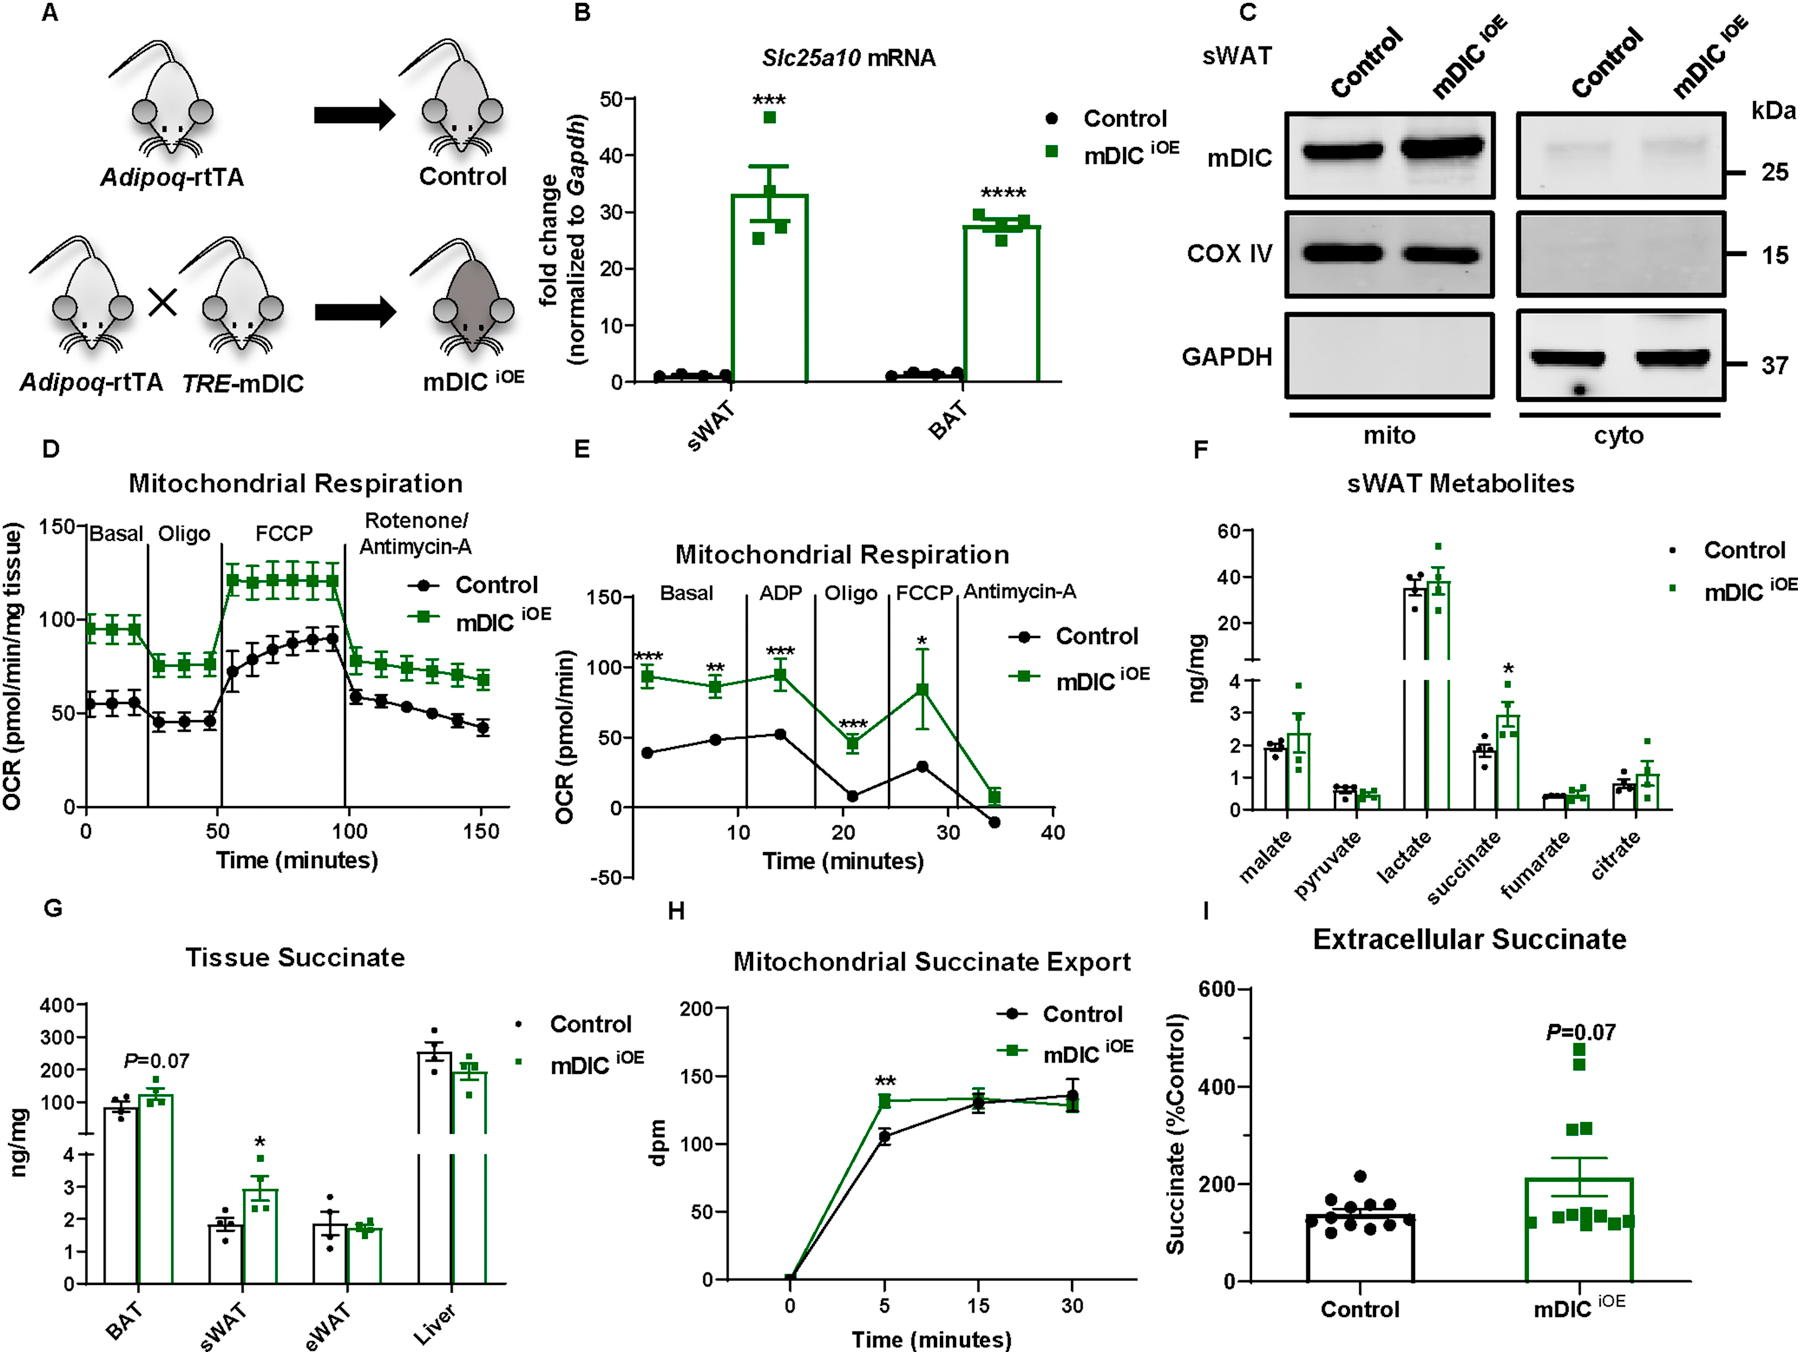
(A) Schematic illustration of the adipocyte-specific, dox-inducible mDIC overexpression mouse (mDICiOE). (B-C) Validation of mDIC enhancement in inducible mDICiOE mice: (B) mDIC mRNA levels (n=4 mice) and (C) mDIC protein levels in mitochondria (mito) and cytosol (cyto) from sWAT. (D-E) ex vivo mitochondrial respiration in sWAT (D) and in vitro respiration in isolated mitochondria (E, 5 μg proteins), n=5. (F-G) TCA cycle intermediate levels in sWAT (F) and succinate levels in different tissues (G), n=4. (H) Succinate export from mitochondria from control or mDICiOE mice, n=12. (I) Extracellular succinate levels in in vitro differentiated adipocytes, n=12. For all statistics: data are presented as mean ± SEM of biologically independent samples. *P<0.05, **P<0.01, ***P<0.001, ****P<0.0001. Two-tailed Student’s t-test (B, F-G, I); Two-way ANOVA followed by a Tukey post-test (D-E, H).
We took advantage of a radiolabeled succinate translocation assay to directly investigate the contributions of mDIC to succinate export from mitochondria. The transport of succinate was substantially accelerated by mDIC overexpression (Fig. 5H). As a result, a slight increase in extracellular succinate levels was observed in mDICiOE adipocytes in vitro (Fig. 5I). In summary, our results demonstrate that overexpression of mDIC in adipocytes enhances mitochondrial respiration and increases the export of succinate from mitochondria.
mDIC overexpression restrains adipocyte lipolysis and prevents liver lipotoxicity.
How does mDIC overexpression affect adipocyte function through promoting the transport of succinate across the inner mitochondrial membrane? In contrast to the mDIC deletion model, we demonstrated a significant decline in intracellular cAMP production in response to forskolin stimulation in mDICiOE adipocytes (Fig. 6A) and a subsequent decline in HSL phosphorylation (Figs. 6B–C). In agreement with the observation of reduced cAMP and pHSL, in vitro and in vivo lipolysis assays (Figs. 6D–E) demonstrated that mDIC overexpression dampened the lipolytic effects of forskolin or CL316,243, respectively. In the basal state, we further observed that in mDICiOE adipocytes, glycerol and NEFA released into the culture media were markedly decreased (Figs. S8A–B). We also noticed a slightly reduced NEFA level and a markedly downregulated AST level in the serum from mDICiOE mice (Fig. 6F).
Fig. 6. mDIC overexpression restrains adipocyte lipolysis to prevent liver lipotoxicity.
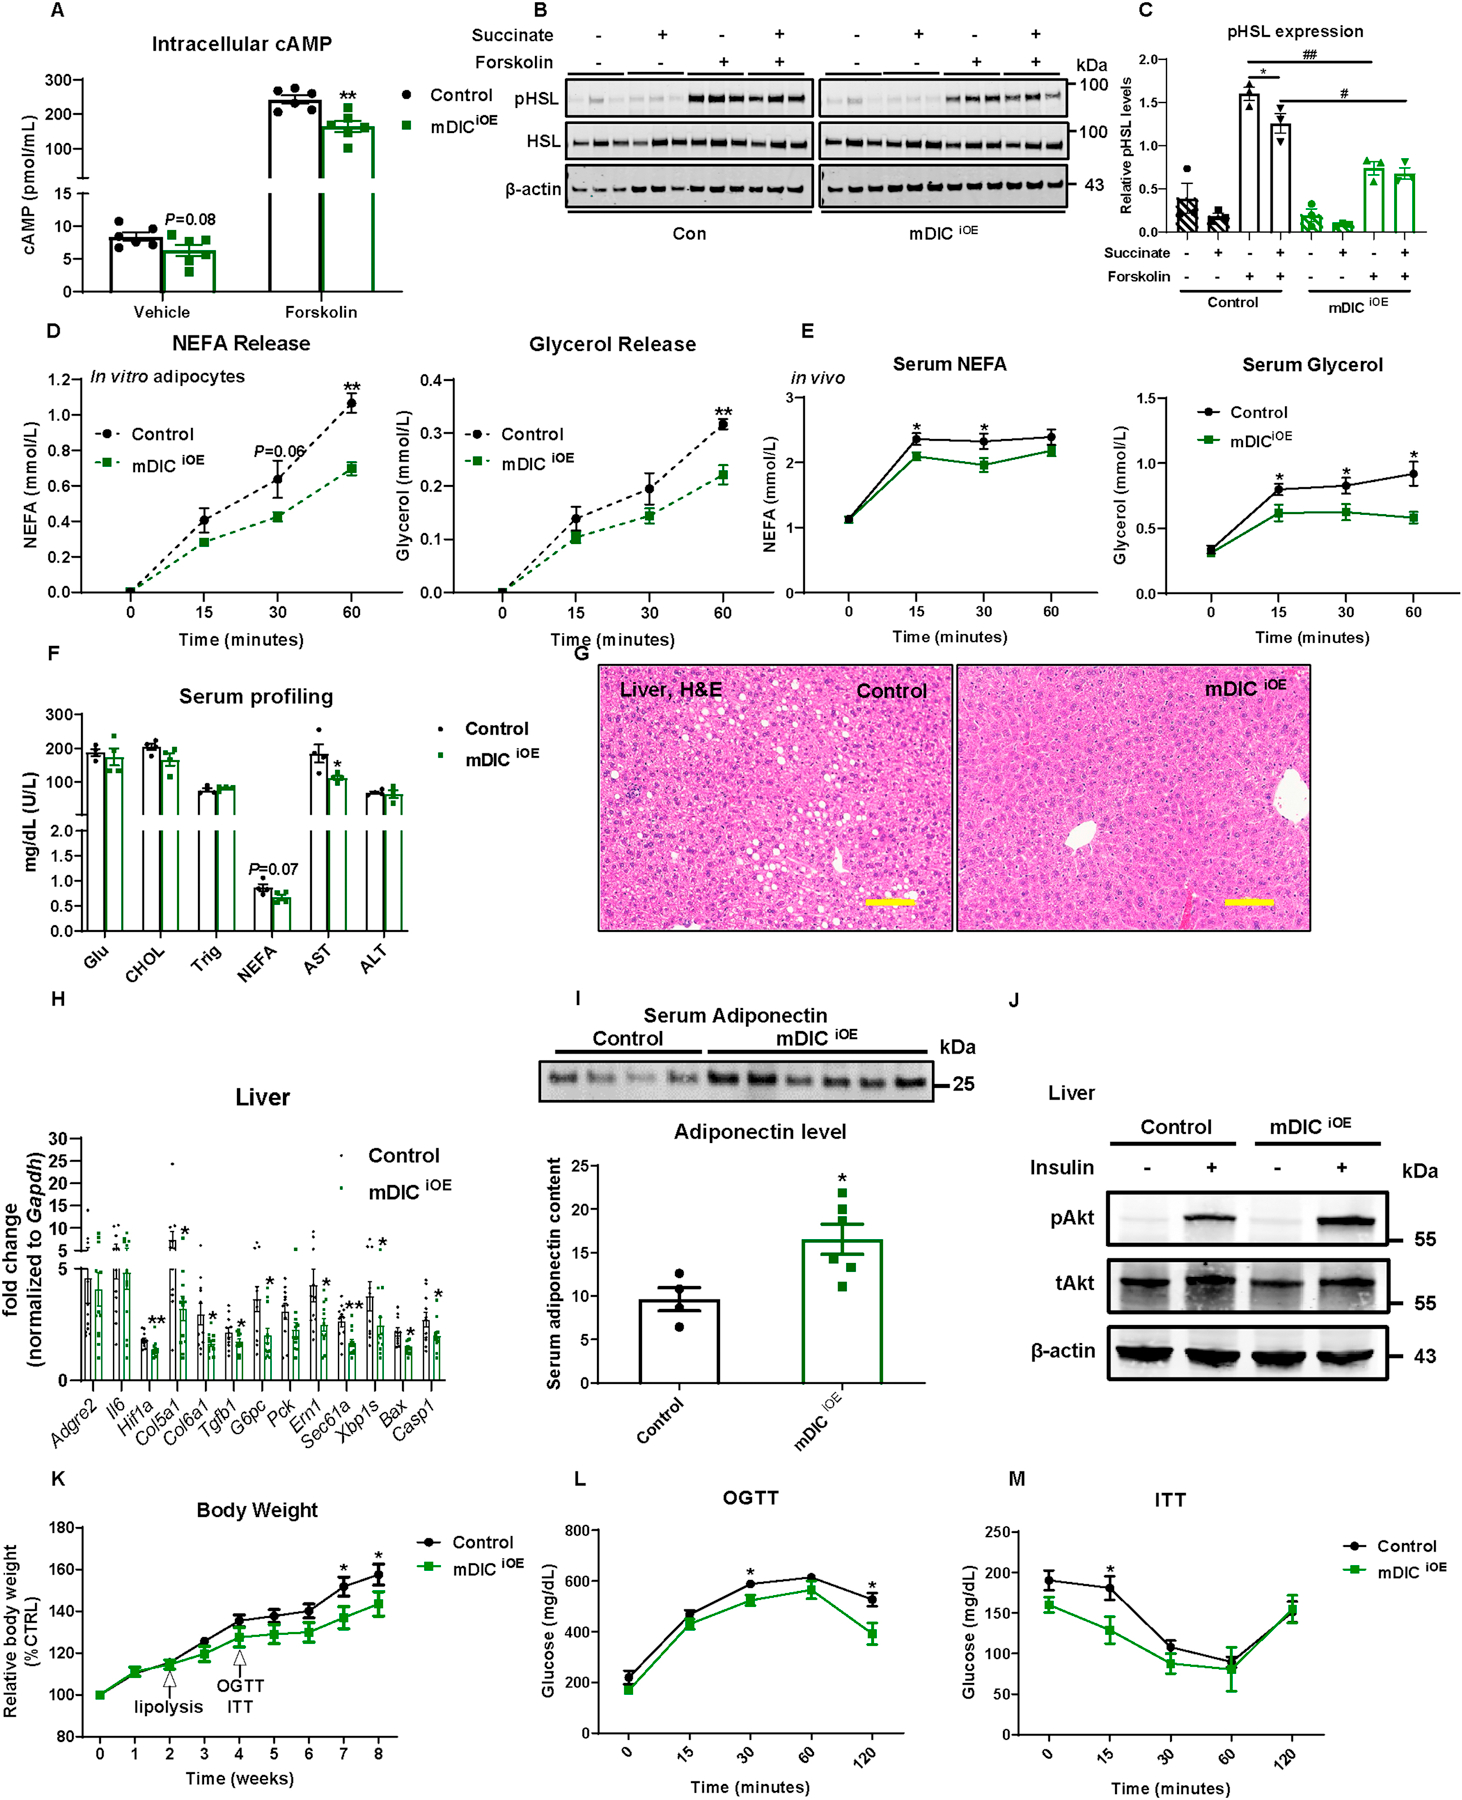
(A) Intracellular cAMP levels from in vitro differentiated adipocytes, n=6. (B-C) Western blotting image (B) and its quantification (C, n=3) for pHSL levels. (D-E) in vitro (D, n=3) and in vivo (E, n=9 (Control) or n=6 (mDICiOE)) lipolysis analyses in control and mDICiOE mice. (F-M) Control and mDICiOE mice were subjected to the following metabolic analyses: (F) Serum profiling (n=4); (G) H&E staining images of liver tissues (bar = 161 μm); (H) Selective inflammation, fibrosis, gluconeogenesis, ER stress, and apoptosis gene expression (n=12); (I) Circulating adiponectin levels (n=4 (Control) or n=6 (mDICiOE)); (J) Liver p-AKT (Ser 473) and total AKT expression after saline or insulin injection (n=3); (K) Relative body weight; (L-M) Glucose levels from (L) OGTT and (M) ITT experiments (n=8). For all the statistics: data are presented as mean ± SEM of biologically independent samples. *P<0.05, **P<0.01; #P<0.05, ##P<0.01. Two-tailed Student’s t-test (B, F, H-I); Two-way ANOVA followed by a Tukey post-test (C-E, K-M).
This raises the question as to whether mDIC overexpression-mediated suppression of adipose tissue lipolysis has the potential to contribute to improvements in fatty liver and NAFLD. We therefore examined the histological appearance of the liver and noticed a reduced lipid accumulation upon dox-HFD feeding (Fig. 6G). In addition to the morphological improvements, we obtained transcriptional readouts, demonstrating that mDIC overexpression in adipocytes significantly affected gene expression in the liver, including a reduction in markers of fibrosis (Hif1a, Col5a1, Col6a1, and Tgfb1), gluconeogenesis (G6pc), ER stress (Ern1 (IRE-1α), Sec61a, and Xbp1s), and cell death (Bax and Casp1) (Fig. 6H). These results further support an improvement in NASH manifestations in mDICiOE mice. We also aimed to investigate changes in insulin sensitivity. By Western blotting, we demonstrated a marked increase in circulating adiponectin levels upon mDIC overexpression (Fig. 6I). Consistent with the improvements of NASH and enhanced insulin sensitivity, we furthermore showed augmented pAKT induction in mDICiOE livers in response to insulin injection (Fig. 6J).
Systemically, mDICiOE mice were more resistant to dox-HFD-induced weight gain (Fig. 6K). In addition, even before the body weight started to diverge between groups, mDICiOE mice were significantly protected from glucose intolerance and insulin resistance (Figs. 6L–M). Furthermore, when mice were leaner upon dox-HFD feeding, adipose tissues of mDICiOE mice also showed a smaller adipocyte size and fewer crown-like structures in both sWAT and eWAT (Figs. S9A–B). However, gene expression of inflammatory, fibrotic, and lipolytic markers was not dramatically altered by mDIC overexpression (Figs. S9C–D).
We analyzed the degree of hepatic steatosis, steatohepatitis, and fibrosis in greater detail by subjecting both control and mDICiOE mice to dox-HFD feeding for a longer period (14 weeks). Compared to control mice, mDICiOE mice show significantly reduced triglyceride levels in the liver (Fig. 7A). NAS was scored through H&E-stained liver sections and demonstrated an improvement in liver steatosis, inflammatory cell infiltration, and hepatocellular ballooning in mDICiOE mice (Figs. 7B–C). We further observed a decreased content of F4/80 positive cells (Fig. 7D) by immunofluorescence staining in the mDICiOE liver. Further flow cytometry analyses (Fig. 7E) and inflammatory gene expression analyses (Fig. 7F) demonstrated a decrease in total and pro-inflammatory markers, as well as a dramatic enhancement in anti-inflammatory markers in mDICiOE mice. Concomitant with the reduced inflammatory response, mDICiOE mice display minimal collagen deposition in the liver, as assessed by picrosirius red staining (Fig. 7G). This highlights a potent protection against liver fibrosis.
Fig. 7. A sustained overexpression of mDIC in adipocytes protects against hepatic steatosis, steatohepatitis, and fibrosis.
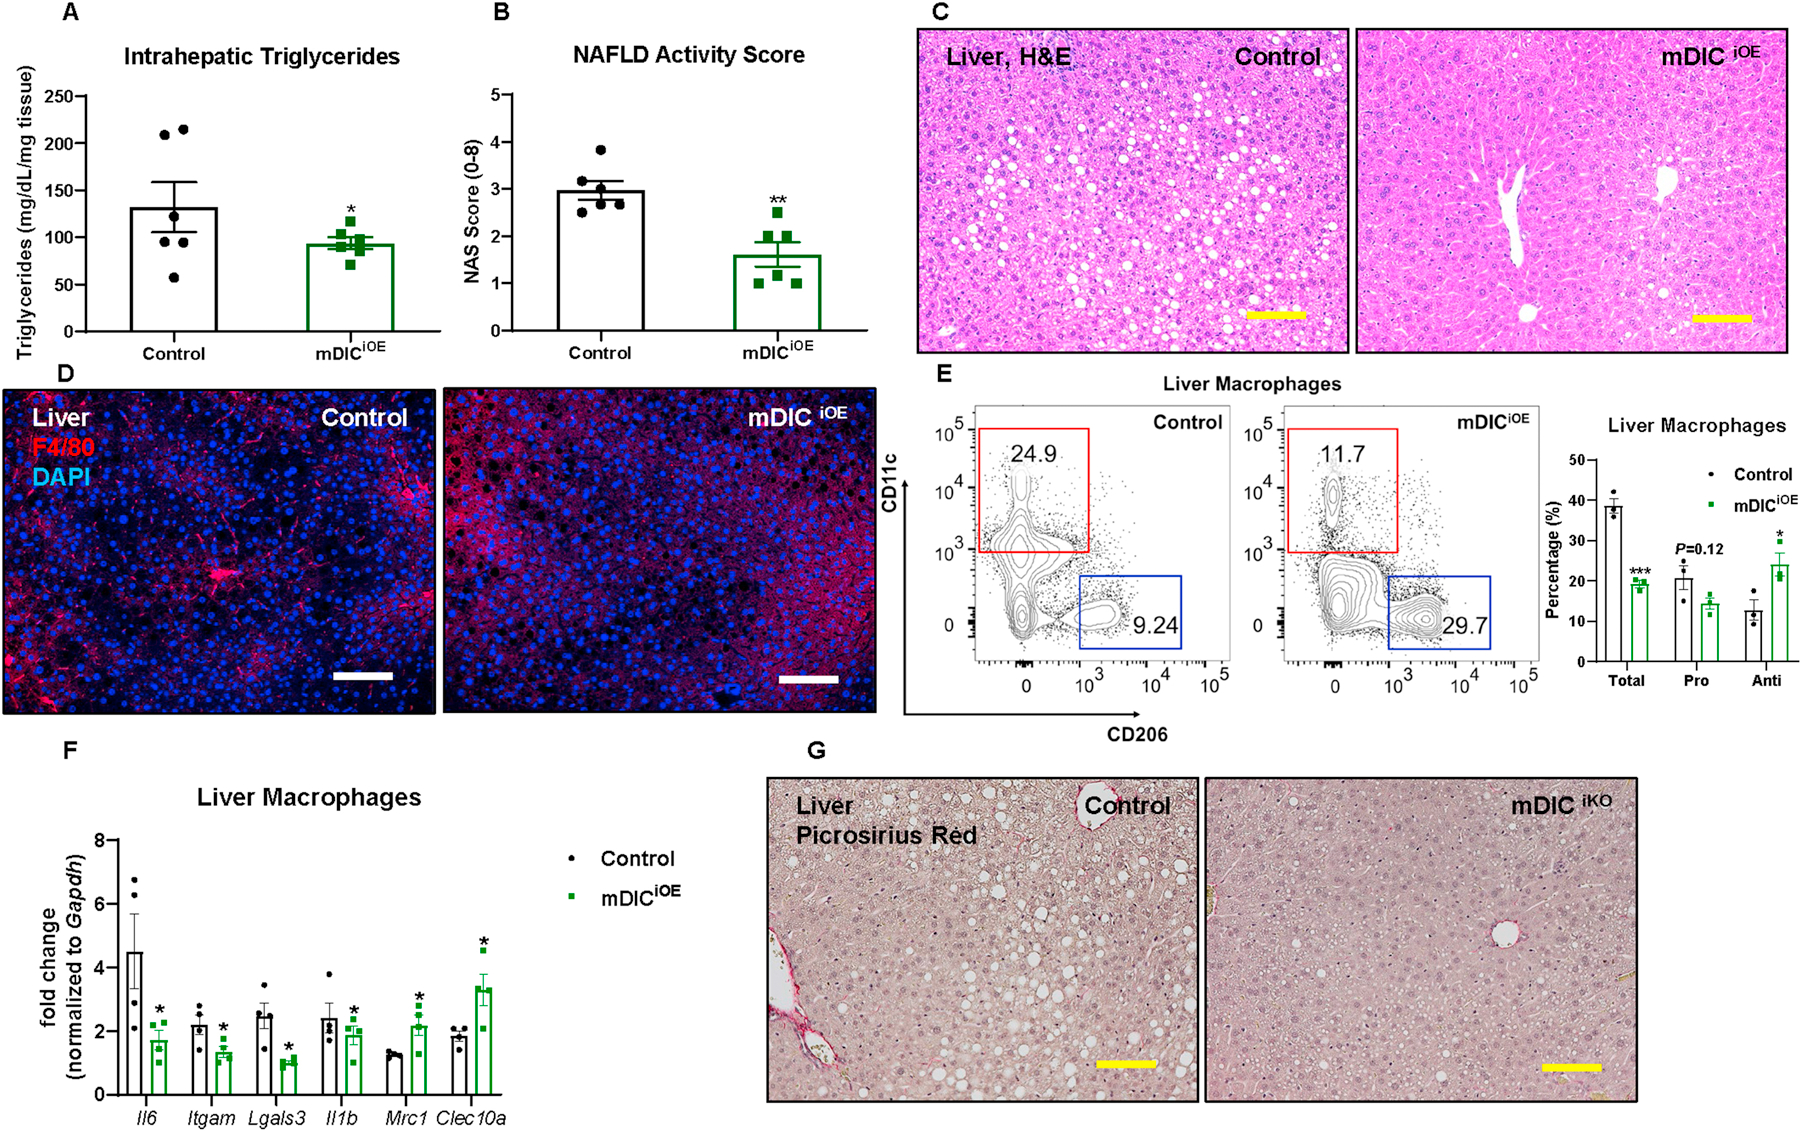
In control or mDICiOE mice fed with dox-HFD for 14 weeks: (A) Intrahepatic triglyceride levels; (B) NAFLD activity score (NAS), n=6; (C-D) H&E staining (C) and F4/80 immunofluorescence staining (D) images of liver tissues (bar = 161 μm); (E) Flow cytometry density plot and statistics (n=3); (F) Selective inflammation gene expression in liver macrophages (n=4); (G) Liver picrosirius red staining images (bar = 161 μm). For all the statistics: data are presented as mean ± SEM of biologically independent samples. *P<0.05, **P<0.01, ***P<0.001. Two-tailed Student’s t-test (A-B, E-F).
mDIC controls adipocyte lipolysis in a SUCNR1 dependent manner.
Previous studies suggested that SUCNR1 (GPR91) serves as a receptor for extracellular succinate to exert its anti-lipolytic effects in adipocytes[20] (Fig. 8A). We therefore hypothesized that mDIC inhibits adipocyte lipolysis through SUCNR1. We took advantage of an adeno-associated virus (AAV)-based CRISPR-Cas9 system to perform a knockout of Sucnr1 in in vitro differentiated adipocytes. We designed two single guide RNAs (sgRNAs) to test the efficiency of Sucnr1 disruption and concluded that sgRNA2 provided a superior reduction of SUCNR1 protein levels (Fig. 8B). Upon transducing cultured control and mDICiOE adipocytes with lacZ- or Sucnr1-sgRNA AAVs, we noticed that supplementing exogenous succinate resulted in a significant inhibition of forskolin-stimulated glycerol release in both control and mDICiOE adipocytes transduced by lacZ-sgRNA AAVs, but not in adipocytes transduced by Sucnr1-sgRNA AAVs (Fig. 8C). The NEFA release in response to forskolin stimulation also showed a trend similar to glycerol release (Fig. 8D). This further places SUCNR1 as a downstream mediator of mDIC’s anti-lipolytic action.
Fig. 8. mDIC controls adipocyte lipolysis in a SUCNR1-dependent manner.
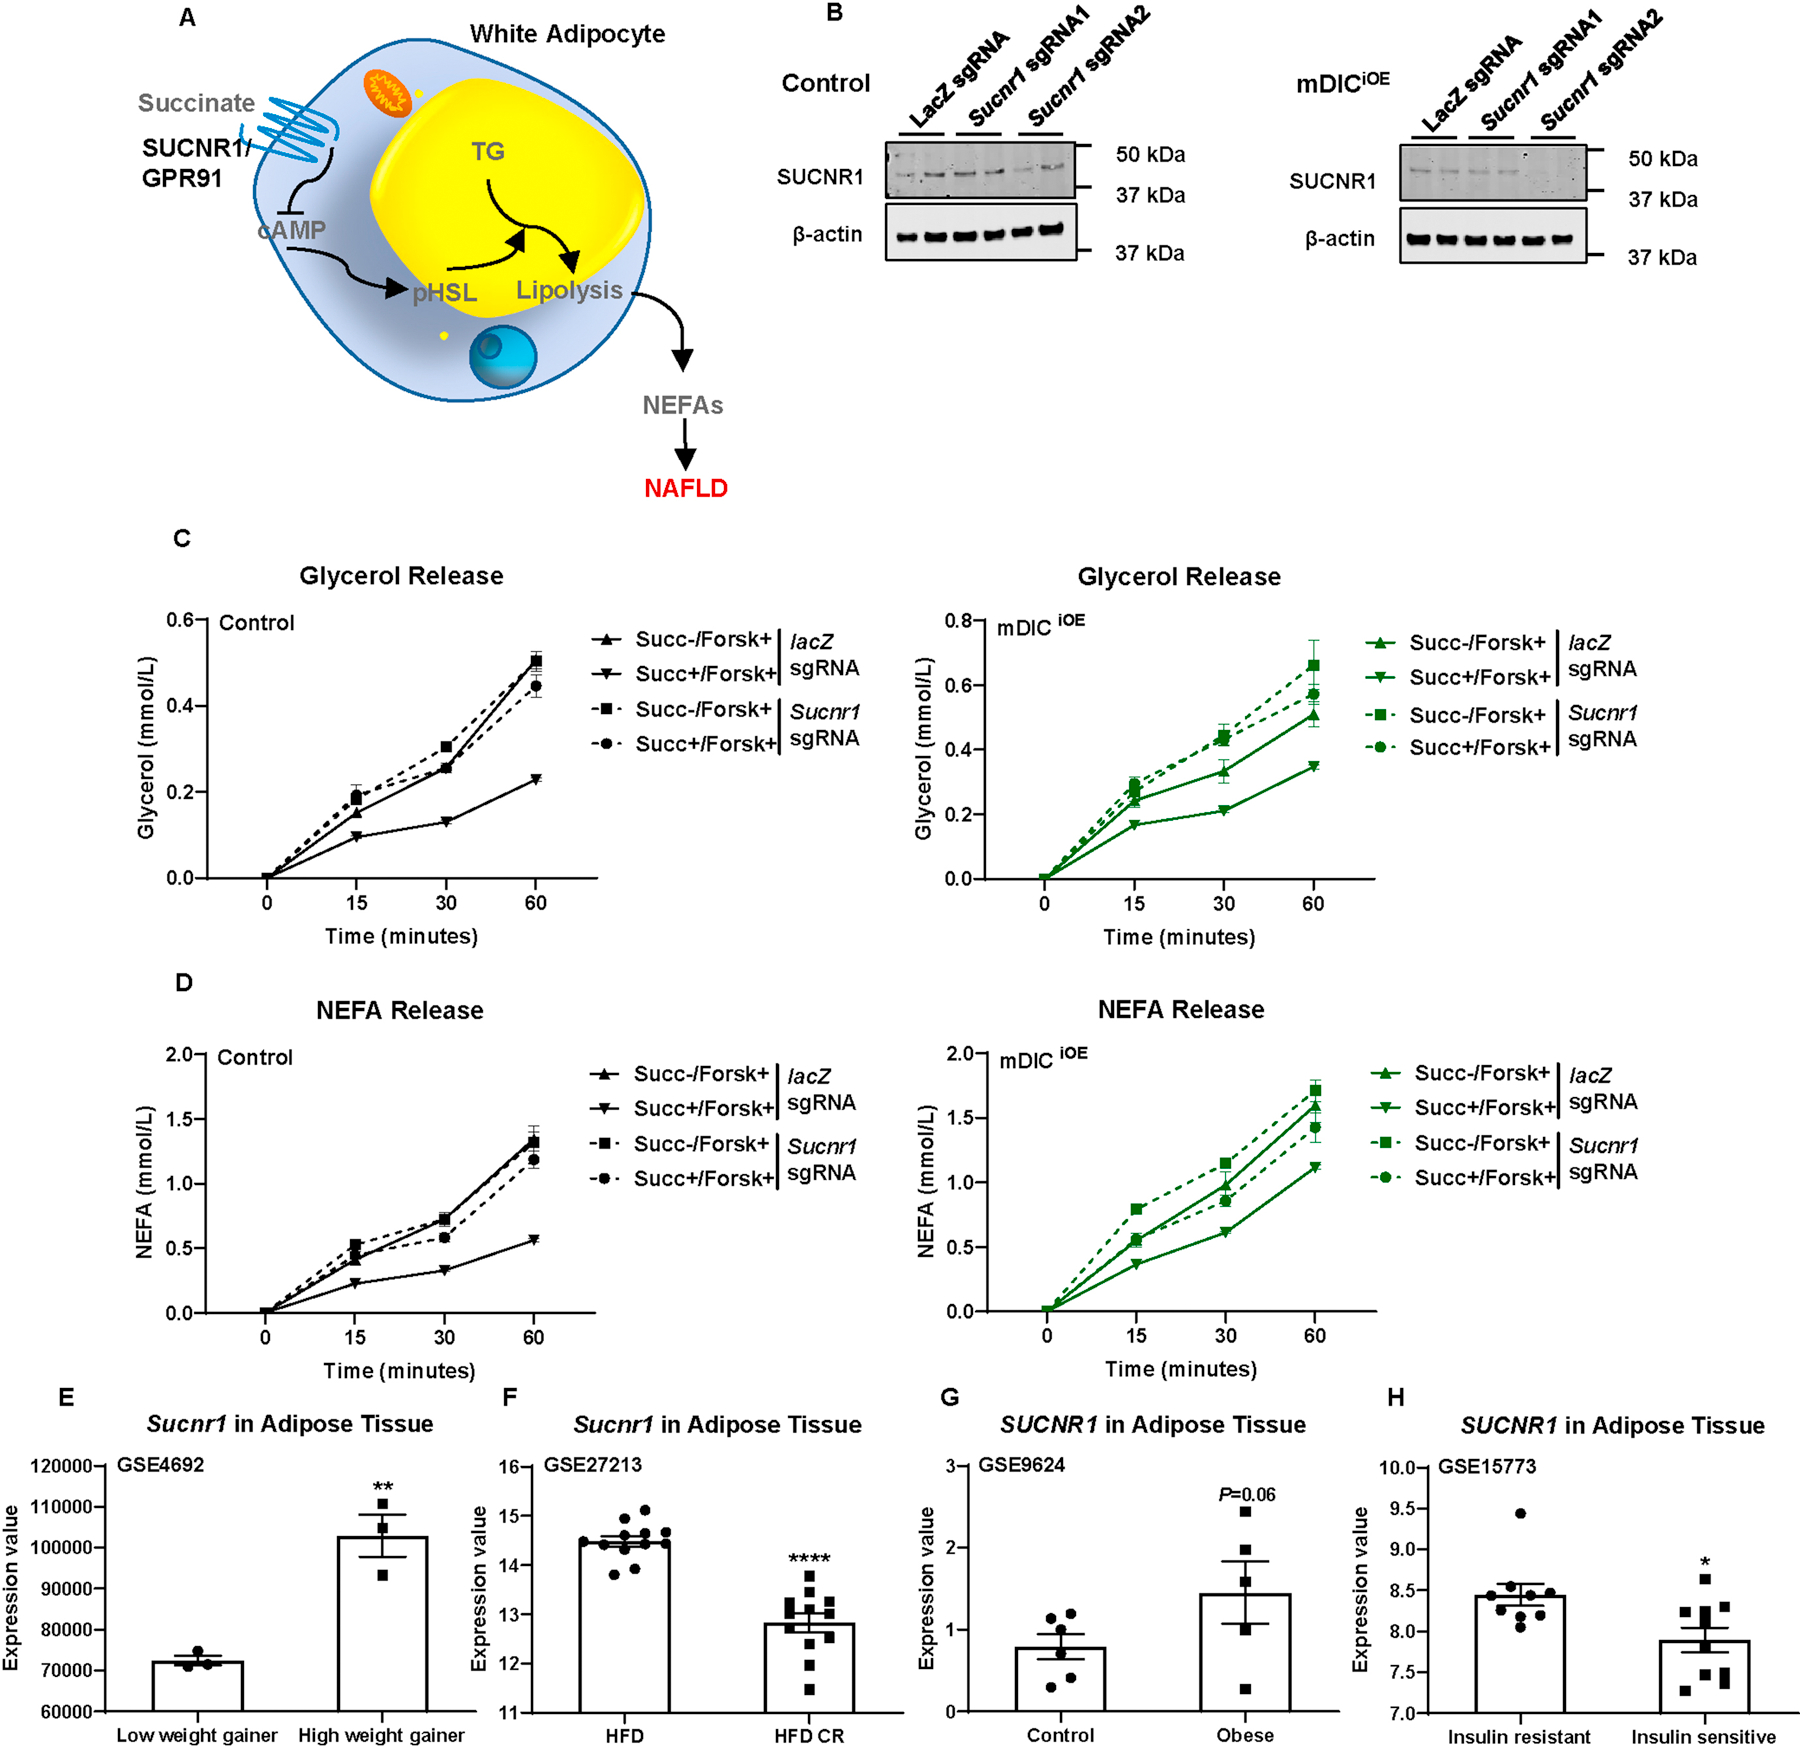
(A) The model of succinate controlling white adipocyte lipolysis and NEFA release dependent on SUCNR1 (GPR91). (B) Western blotting image for SUCNR1 levels in adipocytes transduced with LacZ sgRNA, Sucnr1 sgRNA1, or Sucnr1 sgRNA2 AAVs. (C-D) in vitro lipolysis analysis of control and mDICiOE adipocytes transduced with LacZ sgRNA or Sucnr1 sgRNA AAVs (n=6). (E-H) SUCNR1 expression from mouse or human genomic databases: (E) in sWAT from low and high weight gaining mice (n=3); (F) from HFD-challenged mice with or without calorie restriction (CR) (n=12); (G) from control or obese humans (n=6 (control) or n=5 (obese)); and (H) from insulin resistant or insulin sensitive human subjects (n=9 (insulin resistant) or n=10 (insulin sensitive)). For all the statistics: data are presented as mean ± SEM of biologically independent samples. *P<0.05, **P<0.01, ****P<0.0001. Two-tailed Student’s t-test (E-H).
Are changes in SUCNR1 levels relevant to human or rodent metabolic disease states? We explored genomic databases and discovered that: 1) Sucnr1 mRNA levels in adipose tissue were significantly higher in mice exhibiting a higher body weight gain (Fig. 8E, GSE4692[21]) and significantly lower in mice under caloric restriction (CR) (Fig. 8F, GSE27213[22]); 2) SUCNR1 mRNA levels in adipose tissue were higher in humans with obesity (Fig. 8G, GSE9624[23]) and significantly lower in those with enhanced insulin sensitivity (Fig. 8H, GSE15773[13]). These results further highlight the importance of the mDIC-succinate-SUCNR1 axis in regulating adipocyte lipolysis and systemic metabolic homeostasis.
Discussion
In the present study, we highlight a key role of mDIC, beyond its fundamental action as a mitochondrial inner membrane carrier, in governing adipocyte lipolysis through the export of the TCA cycle intermediate succinate (see e Graphic Abstract). We employed complementary loss- and gain-of-function mouse models to provide direct evidence that mDIC-mediated succinate export is necessary and sufficient to modulate adipocyte lipolysis, thereby impacting the development of NAFLD and systemic insulin resistance.
mDIC was initially described in rats and mice in 1998 and 1999, respectively[8, 9]. Its basic function lies in transporting mitochondrial malonate, malate, and succinate to the cytoplasm in exchange for phosphate, sulphate, sulphite, or thiosulphate[24]. The overall functions of mDIC in cellular metabolism and its impact on systemic physiology and pathophysiology however were yet to be delineated. Few previous reports have related mDIC to systemic metabolic homeostasis, as a contributor to hepatic gluconeogenesis through malate transport[10], a modulator of β-cell insulin secretion[11], and a promoter of cancer cell growth[25]. Notably, mDIC is predominantly expressed in white adipose tissues[8] and its expression is significantly altered in response to metabolic challenges, such as cold exposure or HFD feeding[26]. We now discovered that WAT mDIC expression is robustly associated with insulin sensitivity and intrahepatic lipid content in humans. Consistent with these observations, mDIC levels in WAT are reduced in women with obesity and insulin resistance[27]. All these observations suggest that succinate flux in the adipocyte, as mediated by mDIC, may play an important role in regulating systemic energy homeostasis. Our findings indeed shed new light on the relevance of mDIC-mediated succinate transport out of the mitochondrial matrix and its systemic impact by exerting control over adipocyte lipolysis, circulating NEFA levels, and liver lipid accumulation.
In adipocytes, lipolysis is a finely tuned process involving several key factors that either promote or inhibit the process[28]. Among these factors, insulin is physiologically the most important one, suppressing lipolysis in order to facilitate lipid storage in adipocytes[29]. Recently, another metabolic intermediate, lactate, has been identified to exert anti-lipolytic effects in a GPR81 and insulin-dependent manner[30]. Similarly, succinate has also been reported to inhibit adipose tissue lipolysis in a SUCNR1 (GPR91)-dependent manner[7]. Our observations demonstrate that mDIC-mediated succinate export from the mitochondrial matrix is at the core of its anti-lipolytic effects. We do not know whether the anti-lipolytic effect of the mDIC-succinate-SUCNR1 axis relies on insulin stimulation. We suspect that inhibition of lipolysis by mDIC-succinate might be independent of insulin-induced anti-lipolytic effects, since we previously demonstrated that insulin actually down-regulates mDIC levels in adipocytes[8]. Even though succinate is not directly consumed following its export from the mitochondrial matrix, its export constitutes a cataplerotic reaction for the TCA cycle. Our finding that mDIC serves as a crucial link between TCA cycle activity and adipocyte lipolysis has additional and important physiological implications. When white adipocyte mitochondria face a substrate overflow, mDIC is necessary and sufficient to remove succinate from the mitochondria, enabling it to act as a signaling molecule to inhibit lipolysis and reduce FFA substrate influx into the TCA cycle. The resulting substrate reduction of the TCA cycle further promotes the safe sequestration of FFAs in adipocytes, mitigating their lipotoxic potential in other organ systems. What is surprising at first sight is that despite a reduction in lipolysis, adipose tissue mass is in fact decreased and critical metabolic parameters that reflect overall health of adipocyte such as adiponectin are increased.
Our finding that treating mDICiKO mice with succinate corrects systemic glucose intolerance raises an additional interesting question: could a dietary supplementation with succinate serve as a potential therapeutic avenue to alleviate NAFLD and insulin resistance? Systemic succinate supplementation in fact significantly reduces obesity and glucose intolerance by stimulating brown adipocyte thermogenesis[31]. These findings in mice support the notion that succinate administration could improve metabolic dysfunction. However, a concerning point is that several studies have demonstrated an elevation in tissue or circulating succinate levels in obese, diabetic, and ischemia-reperfusion models[32–34]. Especially in the liver, succinate can activate stellate cells to promote fibrosis[35, 36]. Therefore, in order to utilize succinate as a dietary supplement to treat metabolic diseases, such as NAFLD, future endeavors need to resolve the following two issues: 1) achieve a local enrichment of succinate in adipose tissues after its intake; 2) avoid unfavorable fibrogenic side effects in other organs such as the liver and the heart.
In summary, we highlight a crucial role of mDIC in fine-tuning adipocyte lipolysis and ameliorating obesity-associated liver lipotoxicity. We believe that the mDIC-succinate-SUCNR1 axis may be a therapeutic pathway to overcome metabolic diseases, such as obesity and NAFLD.
Supplementary Material
Highlights.
Adipose mDIC inversely correlates with fatty liver and insulin resistance in humans
Export of succinate through mDIC inhibits lipolysis in adipocytes
Adipose mDIC deletion causes unrestrained lipolysis and promotes liver lipotoxicity
Overexpressing mDIC in adipocytes inhibits lipolysis and prevents liver lipotoxicity
The mDIC-succinate axis has potential for therapeutic intervention in NAFLD
Acknowledgements
We are grateful to all members of the Touchstone Diabetes Center at UT Southwestern for their helpful suggestions and kind support of this study. We sincerely thank the UT Southwestern Transgenic Core Facility for the generation of the transgenic mouse lines, the Metabolic Phenotyping Core for metabolite measurements and analyses, and the Pathology Core for histology processing. We also thank Shimadzu Scientific Instruments for the collaborative efforts in mass spectrometry technology resources.
Financial support statement: This study is supported by US National Institutes of Health grants R01-DK55758, R01-DK099110, RC2-DK118620, P01-DK088761, P01-AG051459 to P.E.S., and P30-DK56341 to S.K. Y.D. is partially supported by American Diabetes Association grants #1–19-JDF-082. J.-B.F. is supported by the Deutsche Forschungsgemeinschaft (DFG, German Research Foundation) grant 414232833.
Abbreviations
- AAV
adeno-associated virus
- ALT
alanine aminotransferase
- AST
aspartate aminotransferase
- AT
adipose tissue
- ATGL
adipose triglyceride lipase
- BAT
brown adipose tissue
- CR
caloric restriction
- dox
doxycycline
- eWAT
epidydimal white adipose tissue
- FFA
free fatty acids
- GIR
glucose infusion rate
- GPCR
G protein-coupled receptor
- H&E
hematoxylin and eosin
- HFD
high-fat diet
- HSL
hormone-sensitive lipase
- ITT
insulin tolerance test
- mDIC
mitochondrial dicarboxylate carrier
- mWAT
mesenteric white adipose tissue
- NAFLD
nonalcoholic fatty liver disease
- NAS
NAFLD activity score
- NASH
nonalcoholic steatohepatitis
- NEFA
non-esterified fatty acids
- OGTT
oral glucose tolerance test
- rtTA
reverse tetracycline-dependent transcriptional activator
- sgRNA
single guide RNA
- SUCNR1
succinate receptor 1
- sWAT
subcutaneous white adipose tissue
- TCA
tricarboxylic acid
- TRE
tetracycline responsive element
- vWAT
visceral white adipose tissue
- WAT
white adipose tissue
Footnotes
Publisher's Disclaimer: This is a PDF file of an unedited manuscript that has been accepted for publication. As a service to our customers we are providing this early version of the manuscript. The manuscript will undergo copyediting, typesetting, and review of the resulting proof before it is published in its final form. Please note that during the production process errors may be discovered which could affect the content, and all legal disclaimers that apply to the journal pertain.NAFLD
Conflict of interest statement: S.K. is a Scientific Advisory Board member for Merch, NovoNordisk, and Altimmune. S.K. also receives an Investigator-initiated Research grant from Janssen. All the other authors declare no conflict of interest.
Data availability statement: All data that support the findings of this study are included in the main figures and the supplementary material.
References
- [1].Perumpail BJ, Khan MA, Yoo ER, Cholankeril G, Kim D, Ahmed A. Clinical epidemiology and disease burden of nonalcoholic fatty liver disease. World J Gastroenterol 2017;23:8263–8276. [DOI] [PMC free article] [PubMed] [Google Scholar]
- [2].Younossi ZM. Non-alcoholic fatty liver disease - A global public health perspective. J Hepatol 2019;70:531–544. [DOI] [PubMed] [Google Scholar]
- [3].Sanyal AJ. Past, present and future perspectives in nonalcoholic fatty liver disease. Nat Rev Gastroenterol Hepatol 2019;16:377–386. [DOI] [PubMed] [Google Scholar]
- [4].Suzuki A, Diehl AM. Nonalcoholic Steatohepatitis. Annu Rev Med 2017;68:85–98. [DOI] [PubMed] [Google Scholar]
- [5].Bosy-Westphal A, Braun W, Albrecht V, Muller MJ. Determinants of ectopic liver fat in metabolic disease. Eur J Clin Nutr 2019;73:209–214. [DOI] [PubMed] [Google Scholar]
- [6].Esler WP, Bence KK. Metabolic Targets in Nonalcoholic Fatty Liver Disease. Cell Mol Gastroenterol Hepatol 2019;8:247–267. [DOI] [PMC free article] [PubMed] [Google Scholar]
- [7].Regard JB, Sato IT, Coughlin SR. Anatomical profiling of G protein-coupled receptor expression. Cell 2008;135:561–571. [DOI] [PMC free article] [PubMed] [Google Scholar]
- [8].Das K, Lewis RY, Combatsiaris TP, Lin Y, Shapiro L, Charron MJ, et al. Predominant expression of the mitochondrial dicarboxylate carrier in white adipose tissue. Biochem J 1999;344 Pt 2:313–320. [PMC free article] [PubMed] [Google Scholar]
- [9].Fiermonte G, Palmieri L, Dolce V, Lasorsa FM, Palmieri F, Runswick MJ, et al. The sequence, bacterial expression, and functional reconstitution of the rat mitochondrial dicarboxylate transporter cloned via distant homologs in yeast and Caenorhabditis elegans. J Biol Chem 1998;273:24754–24759. [DOI] [PubMed] [Google Scholar]
- [10].Mizuarai S, Miki S, Araki H, Takahashi K, Kotani H. Identification of dicarboxylate carrier Slc25a10 as malate transporter in de novo fatty acid synthesis. J Biol Chem 2005;280:32434–32441. [DOI] [PubMed] [Google Scholar]
- [11].Huypens P, Pillai R, Sheinin T, Schaefer S, Huang M, Odegaard ML, et al. The dicarboxylate carrier plays a role in mitochondrial malate transport and in the regulation of glucose-stimulated insulin secretion from rat pancreatic beta cells. Diabetologia 2011;54:135–145. [DOI] [PubMed] [Google Scholar]
- [12].An YA, Crewe C, Asterholm IW, Sun K, Chen S, Zhang F, et al. Dysregulation of Amyloid Precursor Protein Impairs Adipose Tissue Mitochondrial Function and Promotes Obesity. Nat Metab 2019;1:1243–1257. [DOI] [PMC free article] [PubMed] [Google Scholar]
- [13].Hardy OT, Perugini RA, Nicoloro SM, Gallagher-Dorval K, Puri V, Straubhaar J, et al. Body mass index-independent inflammation in omental adipose tissue associated with insulin resistance in morbid obesity. Surg Obes Relat Dis 2011;7:60–67. [DOI] [PMC free article] [PubMed] [Google Scholar]
- [14].Saddic LA, Nicoloro SM, Gupta OT, Czech MP, Gorham J, Shernan SK, et al. Joint analysis of left ventricular expression and circulating plasma levels of Omentin after myocardial ischemia. Cardiovasc Diabetol 2017;16:87. [DOI] [PMC free article] [PubMed] [Google Scholar]
- [15].DiStefano MT, Roth Flach RJ, Senol-Cosar O, Danai LV, Virbasius JV, Nicoloro SM, et al. Adipocyte-specific Hypoxia-inducible gene 2 promotes fat deposition and diet-induced insulin resistance. Mol Metab 2016;5:1149–1161. [DOI] [PMC free article] [PubMed] [Google Scholar]
- [16].Kusminski CM, Holland WL, Sun K, Park J, Spurgin SB, Lin Y, et al. MitoNEET-driven alterations in adipocyte mitochondrial activity reveal a crucial adaptive process that preserves insulin sensitivity in obesity. Nat Med 2012;18:1539–1549. [DOI] [PMC free article] [PubMed] [Google Scholar]
- [17].Byrne CD, Targher G. NAFLD: a multisystem disease. J Hepatol 2015;62:S47–64. [DOI] [PubMed] [Google Scholar]
- [18].Berg AH, Combs TP, Du X, Brownlee M, Scherer PE. The adipocyte-secreted protein Acrp30 enhances hepatic insulin action. Nat Med 2001;7:947–953. [DOI] [PubMed] [Google Scholar]
- [19].Straub LG, Scherer PE. Metabolic Messengers: Adiponectin. Nat Metab 2019;1:334–339. [DOI] [PMC free article] [PubMed] [Google Scholar]
- [20].de Castro Fonseca M, Aguiar CJ, da Rocha Franco JA, Gingold RN, Leite MF. GPR91: expanding the frontiers of Krebs cycle intermediates. Cell Commun Signal 2016;14:3. [DOI] [PMC free article] [PubMed] [Google Scholar]
- [21].Koza RA, Nikonova L, Hogan J, Rim JS, Mendoza T, Faulk C, et al. Changes in gene expression foreshadow diet-induced obesity in genetically identical mice. PLoS Genet 2006;2:e81. [DOI] [PMC free article] [PubMed] [Google Scholar]
- [22].Duivenvoorde LP, van Schothorst EM, Bunschoten A, Keijer J. Dietary restriction of mice on a high-fat diet induces substrate efficiency and improves metabolic health. J Mol Endocrinol 2011;47:81–97. [DOI] [PubMed] [Google Scholar]
- [23].Aguilera CM, Gomez-Llorente C, Tofe I, Gil-Campos M, Canete R, Gil A. Genome-wide expression in visceral adipose tissue from obese prepubertal children. Int J Mol Sci 2015;16:7723–7737. [DOI] [PMC free article] [PubMed] [Google Scholar]
- [24].Zhao Q, Zhou X, Curbo S, Karlsson A. Metformin downregulates the mitochondrial carrier SLC25A10 in a glucose dependent manner. Biochem Pharmacol 2018;156:444–450. [DOI] [PubMed] [Google Scholar]
- [25].Zhou X, Paredes JA, Krishnan S, Curbo S, Karlsson A. The mitochondrial carrier SLC25A10 regulates cancer cell growth. Oncotarget 2015;6:9271–9283. [DOI] [PMC free article] [PubMed] [Google Scholar]
- [26].Lin Y, Berg AH, Iyengar P, Lam TK, Giacca A, Combs TP, et al. The hyperglycemia-induced inflammatory response in adipocytes: the role of reactive oxygen species. J Biol Chem 2005;280:4617–4626. [DOI] [PubMed] [Google Scholar]
- [27].Kulyte A, Ehrlund A, Arner P, Dahlman I. Global transcriptome profiling identifies KLF15 and SLC25A10 as modifiers of adipocytes insulin sensitivity in obese women. PLoS One 2017;12:e0178485. [DOI] [PMC free article] [PubMed] [Google Scholar]
- [28].Yang A, Mottillo EP. Adipocyte lipolysis: from molecular mechanisms of regulation to disease and therapeutics. Biochem J 2020;477:985–1008. [DOI] [PMC free article] [PubMed] [Google Scholar]
- [29].Choi SM, Tucker DF, Gross DN, Easton RM, DiPilato LM, Dean AS, et al. Insulin regulates adipocyte lipolysis via an Akt-independent signaling pathway. Mol Cell Biol 2010;30:5009–5020. [DOI] [PMC free article] [PubMed] [Google Scholar]
- [30].Ahmed K, Tunaru S, Tang C, Muller M, Gille A, Sassmann A, et al. An autocrine lactate loop mediates insulin-dependent inhibition of lipolysis through GPR81. Cell Metab 2010;11:311–319. [DOI] [PubMed] [Google Scholar]
- [31].Mills EL, Pierce KA, Jedrychowski MP, Garrity R, Winther S, Vidoni S, et al. Accumulation of succinate controls activation of adipose tissue thermogenesis. Nature 2018;560:102–106. [DOI] [PMC free article] [PubMed] [Google Scholar]
- [32].Ceperuelo-Mallafre V, Llaurado G, Keiran N, Benaiges E, Astiarraga B, Martinez L, et al. Preoperative Circulating Succinate Levels as a Biomarker for Diabetes Remission After Bariatric Surgery. Diabetes Care 2019;42:1956–1965. [DOI] [PubMed] [Google Scholar]
- [33].Serena C, Ceperuelo-Mallafre V, Keiran N, Queipo-Ortuno MI, Bernal R, Gomez-Huelgas R, et al. Elevated circulating levels of succinate in human obesity are linked to specific gut microbiota. ISME J 2018;12:1642–1657. [DOI] [PMC free article] [PubMed] [Google Scholar]
- [34].Martin JL, Costa ASH, Gruszczyk AV, Beach TE, Allen FM, Prag HA, et al. Succinate accumulation drives ischaemia-reperfusion injury during organ transplantation. Nat Metab 2019;1:966–974. [DOI] [PMC free article] [PubMed] [Google Scholar]
- [35].Correa PR, Kruglov EA, Thompson M, Leite MF, Dranoff JA, Nathanson MH. Succinate is a paracrine signal for liver damage. J Hepatol 2007;47:262–269. [DOI] [PMC free article] [PubMed] [Google Scholar]
- [36].Li YH, Woo SH, Choi DH, Cho EH. Succinate causes alpha-SMA production through GPR91 activation in hepatic stellate cells. Biochem Biophys Res Commun 2015;463:853–858. [DOI] [PubMed] [Google Scholar]
Associated Data
This section collects any data citations, data availability statements, or supplementary materials included in this article.


