

Abstract
Background:
Progressive aortic valve disease has remained a persistent cause of concern in patients with left ventricular assist devices (LVADs). Aortic incompetence (AI) is a known predictor of both mortality and re-admissions in this patient population and remains a challenging clinical problem.
Methods:
Ten LVAD patients with de-novo aortic regurgitation, and 19 control LVAD patients were identified. Three-dimensional models of patients’ aortas were created from their CT scans, following which large-scale patient specific CFD simulations were performed with physiologically accurate boundary conditions using the SimVascular flow solver.
Results:
The spatial distributions of time averaged wall shear stress (TAWSS) and oscillatory shear index (OSI) show no significant differences in the aortic root in patients with and without AI (mean difference 0.67 dyne/cm2 (95% CI = [−0.51. 1.85]; p-value = 0.23). OSI was also not significantly different between both groups of patients (mean difference 0.03 (95% CI = [−0.07, 0.019]; p-value = 0.22). The localized wall shear stress on the leaflet tips were significantly higher in the AI group than the non-AI group (1.62 vs 1.35 dyne/cm2; mean difference 95% CI (0.15, 0.39); p < 0.001), whereas OSI was not significantly different between both groups (95% CI −0.009, 0.001; p = 0.17).
Conclusions:
Computational fluid dynamics serves a unique role in studying the hemodynamic features in LVAD patients where 4D-MRI remains unfeasible. Contrary to the widely accepted notions of highly disturbed flow, in this study we demonstrate that the aortic root is a region of relatively stagnant flow. We further identified localized hemodynamic features in the aortic root that challenges our understanding of how AI develops in this patient population.
Keywords: Computational Flow Dynamics, Left Ventricular Assist Device, Aortic Incompetence, SimVascular, Aortic Valve Regurgitation, Heart Failure, Cardiovascular Surgery, Treatment, Quality and Outcomes
Progressive aortic valve disease has remained a persistent cause of concern in patients with left ventricular assist devices (LVADs). Up to 15% of patients supported with these lifesaving implants progressively develop aortic valve degeneration within two years.1,2 Aortic incompetence (AI) is a known predictor of both mortality and re-admissions in this patient population.2 Despite advances in pump design and controller algorithms, compensating for backflow-induced loss of LVAD output in patients with AI remains a challenging clinical problem.
The prevailing hypotheses of how AI develops over time are centered on the hemodynamic changes brought by the LVAD. Modern continuous flow LVADs are non-pulsatile pumps with a rotating impeller that drives blood from the left ventricle into the aorta, bypassing the left ventricular outflow tract and aortic valve. Especially in the setting of low native cardiac ejection, the aortic valve remains persistently closed. Furthermore, it has been theorized that the narrow lumen of the LVAD outflow graft leads to flow disturbances characterized by high velocities and increased wall shear stresses in aortic root.3 Characterizing these hemodynamic features remains a challenge in this patient population, primarily due to the lack of MRI-safe LVAD systems precluding 4D-MRI flow studies.
Computational fluid dynamics (CFD) simulations provide a method to accurately predict the hemodynamics and ultimately serve as predictive tools to guide patient management; recent techniques make use of three dimensional patient-specific model geometries and clinically validated boundary conditions.4–7 Most CFD studies in patients with LVADs have been case reports or small case series with simplistic boundary conditions that fail to mimic human vascular physiology.8,9 In a recent paper, we reported how the geometric orientation of the LVAD outflow graft may influence the progression of aortic incompetence.10 While this remains one of the largest simulation studies of its kind, limitations included idealized assumptions rather than patient-specific calibration of distal vascular physiology, along with the constrained scale and complexity of each simulation study.
In this study, we utilize individually tuned vascular resistances and boundary conditions, patient and device-specific flow profiles, and a complete 3-dimensional reconstruction of the aortic valve, aorta, and major arch vessels in LVAD patients. Using scans taken at the time of LVAD implantation, we further detail the hemodynamic conditions that increase predisposition for downstream AI using flow solvers and novel methods that computationally quantify vascular stasis. Contrary to the widely accepted notions of highly disturbed flow, we demonstrate that the aortic root is a region of relatively stagnant flow with varying levels of recirculation and low wall shear stresses. Furthermore, we describe unique localized elevations of shear stress at the aortic valve leaflet tips – regions known to undergo pathological dystrophic changes under long-term LVAD support. By computationally testing the prevailing theories of why aortic insufficiency develops in this patient population, we identify flow features that may be used to guide post-LVAD follow-up in a patient specific fashion.
Methods:
Data Transparency and Openness Promotion
SimVascular, an open-source patient-specific cardiovascular flow modeling software was used for the experiments in this paper (Available at: https://github.com/SimVascular), with supplemental editing performed in Meshmixer (Autodesk, Inc.). Specific accessory scripts are available at (https://github.com/rohanshad/cfd_circulation_hf). Barring the patient imaging scans, data that support the findings of this study are available from the corresponding author upon reasonable request.
Patient Population
Twenty-nine patients who received an LVAD at our institution over a ten-year period (2009-2019) were retrospectively reviewed with approval from the Stanford University Institutional Review Board. (IRB-40972). We defined patients to have aortic incompetence if they developed de-novo or worsening AI, as determined by echocardiographic guidelines.11 Nine patients met the AI inclusion criteria, had thoracic computed tomography (CT) scans with sufficient resolution, and had neither aortic valve interventions nor bicuspid valves. 19 control patients with no pre-operative AI, no de-novo AI development, and an average duration of LVAD support similar to that of the AI cohort were randomly sampled.
Patient specific modelling
We utilize scans taken at the time of LVAD implantation and model competent valves. From CT images, pathlines, curves that approximately trace the centerlines of relevant vessels, were created of the aorta from the aortic root through the thoracic aorta, the three main branches of the aortic arch (brachiocephalic artery, left common carotid artery, and the left subclavian artery), and distal LVAD outflow tract were created (Figure 1). The vessel boundaries were manually defined as ‘segmentations’ at 30 – 40 horizontal cross-sections along the pathlines, and a 3-dimensional model was generated from these segmentations using a spline interpolation method in SimVascular.5 A model aortic valve in the closed state was generated based on a high resolution CT-scan using splines (Autodesk Fusion360, MeshMixer), which was then centered onto each patients aortic root, manually scaling the valve geometry for a given aortic root. Localized iterations of Laplacian smoothing operations were applied to the walls of the generated model to eliminate sharp transition zones between vessels and valve leaflets.
Figure 1:
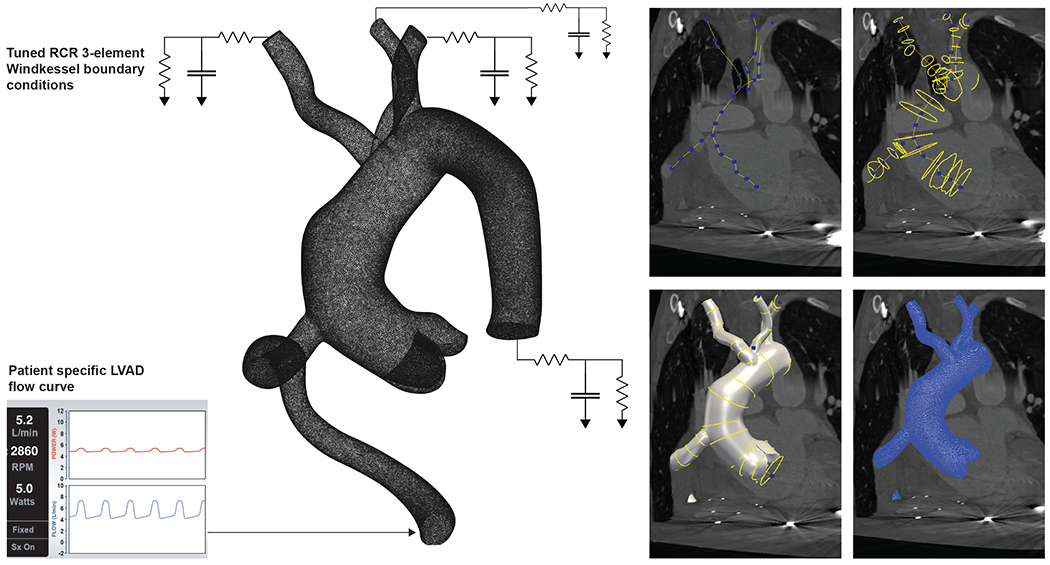
The boundary conditions represented as a circuit diagram for an example vascular geometry modelled in SimVascular. The 3-element Windkessel model accounts for patient specific peripheral vascular resistances. The panels on the right detail the steps in generating patient specific 3D models using SimVascular: B) Creating pathlines, C) Creating segmentation masks, D) Lofting a 3D model, and E) Meshing with tetgen to create a detailed unstructured mesh for further computational analyses.
Computational fluid dynamics pipeline
High resolution unstructured meshes were generated using the default TetGen meshing module in SimVascular. The minimum edge size was fixed at 1mm, leading to 3-dimensional meshes with approximately 4 million elements each. Blood is modeled as an incompressible viscous Newtonian fluid governed by the Navier Stokes equations which were solved with a stabilized finite element method with linear elements and a second order time advancement scheme.
where u is fluid velocity and p is pressure. These equations represent conservation of momentum and incompressibility. The density is set to ρ = 1.06 g/cm3 and viscosity is set to μ = 0.04 Poise. No-slip boundary conditions are prescribed at the arterial and LVAD graft walls, which are treated as rigid. The aortic valve is prescribed to be fully closed and also treated as rigid. The equations were solved using the SimVascular flowsolver.4
Physiological boundary conditions & pulsatile LVAD flow
The boundary conditions for each vascular outlet (thoracic aorta, brachiocephalic artery, left common carotid artery, and left subclavian artery) are determined from 3-element Windkessel models.6 The Windkessel models represent the downstream proximal resistance (Rp), capacitance (C), and peripheral vascular resistance (Rd) of each vessel. A custom python script was used to derive patient specific Rp, C, Rd values from patient specific LVAD flow measurements and clinically measured brachial artery pressures over a 6-month period for each patient. The total resistance is tuned to achieve the desired total flow and split to the outlets according to area. The ratio Rp/Rd = 0.065 was taken from the mean values of control subjects in the work by Laskey et al.12 Capacitance is tuned to the governing ordinary differential equations assuming zero flow in diastole, then manually adjusted to achieve the target pulse pressure. A template pulsatile LVAD flow profile was created by digitizing a selection of patient-specific LVAD flow curves mapped to invasively monitored arterial pressure readings. This template was used to map patient-specific LVAD flow profiles for each patient using clinically measured blood pressure readings and LVAD flow rates averaged over a 6-month period. This patient-specific flow profile is prescribed at the LVAD inlet.
Simulated pressures were validated against clinically measured systolic and diastolic arterial pressures. Simulations were run for approximately 5 cardiac cycles to remove initialization effects in the solution. Platelets were simulated as massless particles with a custom extension of the SimVascular svFSI-solver that solves the Lagrangian-frame advection equation
where s labels a particle and X(s, t) is its position at time t. The flow simulation results from the 5th cardiac cycle are used as the velocity field u. Flow stagnation was quantified by setting the flow entering the LVAD outflow graft as a non-diffusible dye and calculating the ratio of dye replaced fluid from otherwise ‘undyed’ stagnant fluid at a given cross-sectional section of the geometry. We use a continuous dye model to track residence time in the final cycle, in which a continuous variable tracks the fraction of flow remaining from the previous cycle at any location. This has advantages over particle-based computation of residence time, which is sensitive to the initial seeding of particles and low coverage over time due to washout.7 Each simulation was run on the Stanford Sherlock High Performance Computing Cluster, using 48 cores across 2 nodes per case. All results were processed in ParaView (Kitware, inc. NY) and custom R and python scripts.
Statistical Analyses
Categorical variables (Sex, Pre-Operative BMI, LVAD type) were compared using the Chi squared test. Continuous variables (Age, Pump flow, mean arterial pressure, LVAD support duration, time-averaged wall shear stresses (TAWSS), oscillatory shear indices (OSI)) were compared using the Welch’s two sample t-test. Differences between clinical and simulated pressure measurements were assessed using Bland & Altman plots. TAWSS and OSI were reported as means alongside confidence intervals. Probability distribution curves for TAWSS and OSI were used to illustrate spatial differences. Streamlines at peak systole were calculated and colored by velocity magnitude. A p-value threshold of 0.05 was used to define statistical significance. All statistical analyses were performed using R v3.6.3.
Results:
Patient characteristics are summarized in Table 1. Baseline characteristics including age, sex, pre-operative BMI, indication for LVAD, mean arterial pressure, grade of baseline aortic incompetence, pump speed (RPM) and pump flow were similar between both AI and non-AI groups (Table 1). Bland & Altman plots (Figure 2A) show that our simulated pressures were found to closely match clinically measured pressure targets (Figure 2), remaining within a 10% error margin. In both groups, most of the blood flow is directed towards the aortic arch, with little flow directed towards the aortic root (Figure 3A, 3B).
Table 1:
Patient characteristics for the AI and control groups
| AI (N = 9) | CONTROL (N = 19) | P-VALUE | |
|---|---|---|---|
| Age | 62.2 ± 9.7 | 55.4 ± 14.0 | 0.15 |
| Sex | 0.48 | ||
| Female | 3 (33.3%) | 4 (21.1%) | |
| Male | 6 (66.6%) | 15 (78.9%) | |
| Pre-operative BMI (kg/m2) | 25.1 ± 7.3 | 26.4 ± 4.3 | 0.63 |
| Mean Arterial Pressure (mm Hg) | 77 ± 7 | 79 ± 11 | 0.55 |
| LVAD type | 0.51 | ||
| Heartmate II | 5 (55.6%) | 13 (68.4%) | |
| HeartWare | 4 (44.4%) | 6 (31.6%) | |
| Pump flow (l/min) | 4.38 ± 0.87 | 4.61 ± 0.98 | 0.54 |
| Pump speed (rpm) | |||
| Heartmate II | 9028 ± 231 | 8839 ± 318 | 0.19 |
| HeartWare | 2495 ± 53 | 2560 ± 208 | 0.49 |
| LVAD support duration (days) | 499 (362,742) | 522 (179, 1346) | 0.14 |
. Continuous variables were compared using the Welch’s two-sample t-test. Categorical variables were compared using the Chi-squared test. Mean ± SD; Median (IQR), n (%)
Figure 2:
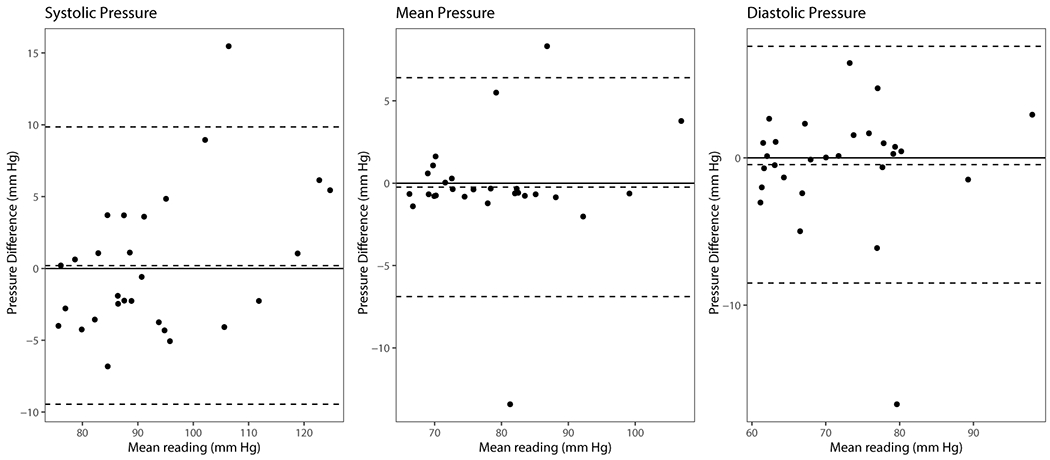
Bland Altman plots of systolic, mean and diastolic arterial pressure measurements compared to simulated pressures.
Figure 3: Flow simulation results for patients with and without AI:
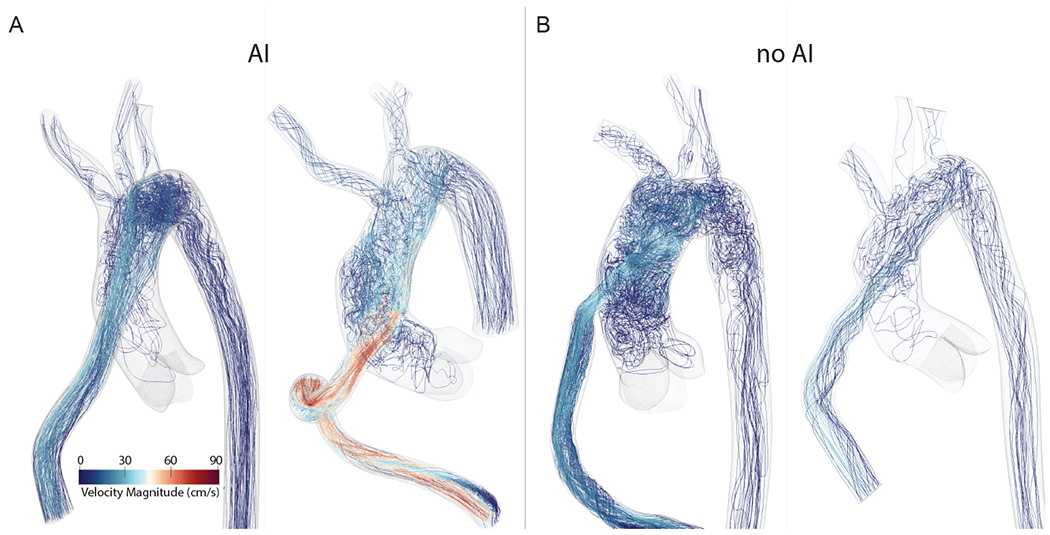
A) Computational Fluid Dynamics simulation results with rendered velocity streamlines for patients with AI, and B) for patients without AI. The majority of the flow is directed towards the aortic arch in all four cases regardless of AI, with little flow directed towards the aortic root.
TAWSS and OSI in the region of the aortic root and leaflets are shown in Figure 4. The probability density plots (Figure 4) for the spatial distributions of TAWSS and OSI show that the aortic root TAWSS distribution in patients with and without AI was not significantly different (mean difference 0.67 dyne/cm2 (95% CI = [−0.51, 1.85]; p-value = 0.23). OSI was also not significantly different between both groups of patients (mean difference 0.03 (95% CI = [−0.07, 0.019]; p-value = 0.22).
Figure 4: Analysis of time averaged wall shear stress (TAWSS) and Oscillatory Shear Index (OSI):

A) Representative simulations of patients with AI (left two panels) and without AI (right two panels) showing reduced TAWSS accumulation in the aortic roots. In some cases, such as in the right most panel, the TAWSS is markedly increased in the region immediately opposite to where the LVAD outflow graft is affixed to the aorta. B) Distribution of OSI over the models, showing an overall very similar OSI pattern between AI and non-AI patients. Figure 4C and D quantify this similarity using probability density plots of aortic root TAWSS and OSI respectively.
Representative examples of simulation results from the advection-diffusion solver are shown in Figure 5. Cross sections at the level of the aortic arch and the aortic root are shown for a sequence of time points to illustrate regions of stagnant flow. Plots depicting flow stagnation as a function of time are shown in the adjacent panel (Figure 5). Aortic root flow stagnation was similar in both patients with and without AI (95% CI [−0.18, 0.09]; p-value 0.54). In 4 cardiac cycles, only 25% of the blood in the aortic root was washed out by the inflow jet (Figure 5D).
Figure 5: Quantifying flow stagnation:
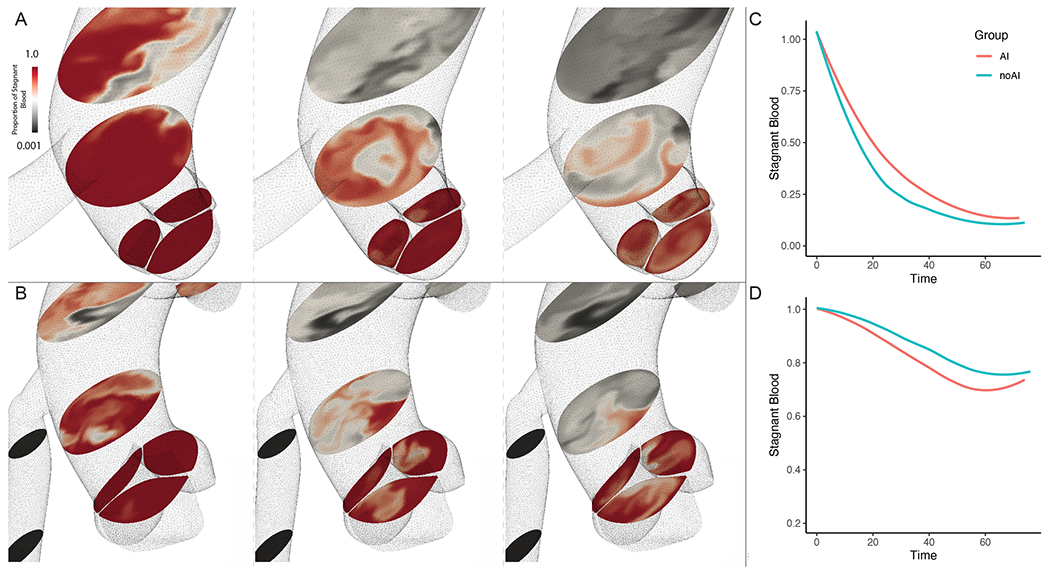
A) Representative images from a patient with AI, the left most panel showing the flow of fluid into the aorta with dye (black) at an early time-point. Within a single cardiac cycle, the dye replaces almost all the stagnant fluid (red) in the aortic arch, however the aortic root remains unperturbed. By the end of one cardiac cycle, we can see that the flow in the aortic sinuses appear to form small zones of recirculation with varying degrees of fluid admixture near the leaflet edges. B) We notice similar flow features in patients without AI, though in this specific case the proximal ascending aorta fluid is washed out more rapidly than in the AI case described above. C) A plot quantifying the degree of admixture represented by the fraction of stagnant (red) fluid still remaining at the end of 4 cardiac cycles in the aortic arch, and D) in the aortic root.
A detailed representation of the local hemodynamic conditions near the aortic valve leaflets for both AI and non-AI patients is shown in Figure 6. The localized wall shear stress on the leaflet tips were significantly higher in the AI group than the non-AI group (1.62 vs 1.35 dyne/cm2; mean difference 95% CI (0.15, 0.39); p < 0.001), whereas differences in OSI remained non-significant between both groups (95% CI −0.009, 0.001; p = 0.17).
Figure 6: Analysis of valvular cusps and commissural free edges:
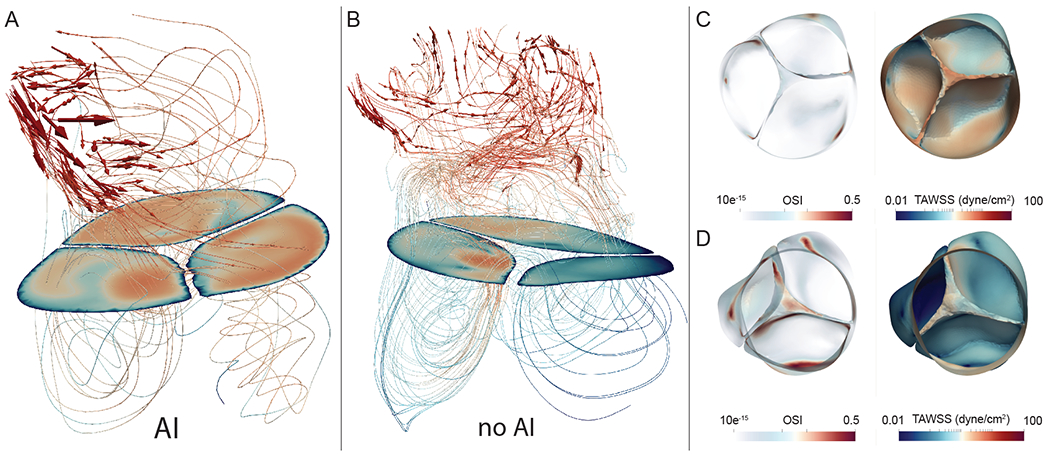
A) Shows a representative simulation in a patient with AI at peak systole. Note that the velocity streamlines are directed parallel to the leaflet tips, and while aortic root velocities remain low (recirculation areas beneath the solid plane), the leaflet tips themselves have a high TAWSS accumulation (log-scale) (Figure 6C). This effect is not seen in most patients without AI (Figure 6B & D).
Discussion:
Our simulations demonstrate that bulk fluid properties in the aorta remains similar across both patient groups. The majority of fluid flow is directed towards the aortic arch, with little flow directed at the aortic root and aortic valve. Similar to findings from a patient specific CFD case report published recently, we show that while flow instabilities are seen close to the regions of flow separation in the aortic arch, little flow enters into the aortic root.9 As a result of this relatively low velocity flow domain as compared to healthy patients, the walls of the aortic roots across patients both with and without AI are thus exposed to relatively lower wall shear stresses. The root TAWSS measurements remained similar in both groups, thus exposure to high shear stresses and high velocity jets directed towards the aortic root itself are unlikely to explain why certain LVAD patients develop AI over time. These results suggest that the long held hypotheses of high flow velocities, high root pressures, and high wall shear stresses at the aortic root are unlikely to explain the progression of AI in LVAD patients.3
The role and importance of pulsatility in LVAD associated adverse events remain uncertain.13 A prolonged loss of pulsatile flow is known to lead to significant dystrophic changes in aortic smooth muscle cells, which can further lead to weakening of the aortic walls and progressive dilation of the aortic sinus.14,15 Studies have additionally shown an increased risk of gastrointestinal bleeding and arterio-venous malformations in patients with low LVAD pulsatility.16–18 The lack of flow velocity oscillations may also lead to chronic remodeling of microvasculature and arterial smooth muscle cells, as has been noted in the aortic wall and renal parenchyma.15,19 Historically, however, aortic incompetence and dystrophic changes in the aortic valve have been described in both pulsatile and non-pulsatile LVAD systems.3,15 Our simulation method allowed us to map patient-specific LVAD flow profiles with varying degrees of pulsatility as captured by the device waveform.20 In these simulations, OSI describes the degree of deviation of the wall shear stress from its average direction during pulsatile flow.21 OSI was found to be similar in the aortic roots across patients with and without AI, showing that loss of pulsatile flow is in and of itself unlikely to primarily drive the progression of AI in LVAD patients.
It is also hypothesized that once platelets are activated in the impeller of the LVAD, the downstream stagnant flow in the aortic root may favor the deposition of thrombi.22–26 Commissural fusion is a relatively well characterized feature in patients supported with LVADs, primarily thought to be a fibrotic process in a persistently closed aortic valve, though organizing thrombus has been seen in some individuals.22,27,28 We found that blood in the aortic arch was rapidly washed out by the high velocity LVAD flow jet in both groups of patients. In the aortic root, however, flow remains stagnant for a longer period of time (Figure 5). No significant differences were seen in the fraction of stagnant flow remaining in the aortic roots between patients who developed AI and those who did not, suggesting that a primary thrombotic etiology is also unlikely.
The striking dystrophic changes previously described in the aortic valves prompted us to assess the localized hemodynamics of the region immediately proximal to the aortic valves and ensure that the valve leaflets were rendered in our 3D models. We found a significant increase in TAWSS in the commissural free edges of the aortic valve leaflets in the AI group. This is despite the relatively lower flow into the aortic root across all LVAD patients. On further analysis, we find that in patients with AI, localized recirculation zones above the aortic roots contribute to increased accumulation of TAWSS in the same regions of the aortic leaflets as one would find fusion of the aortic valve leaflets on gross morphology and histopathology (Figure 6). OSI readings from the leaflet tips were similar between patients with and without AI. It is known that changes in wall shear stress may contribute to endothelial dysfunction and subsequent changes in the behavior of smooth muscle cells.29,30 These findings indicate that flow mediated localized changes in the distribution of wall shear stress of aortic valve leaflets may contribute to the dystrophic changes that lead up to the development of AI. Of note, a closed aortic valve with minimal native ejection has previously been identified as an independent predictor of progression to severe AI in LVAD patients.31 All patients in this study however, had a persistently closed aortic valve on follow-up echocardiography visits. While we cannot definitively conclude whether the root hemodynamics or the persistently closed state of the valve is to blame for the progression of AI, our results indicate it is likely a combination of both, as not all patients without valve opening develop this complication, and a persistently closed aortic valve would only amplify the exposure time to the high TAWSS. While our simulations represent a ‘snapshot’ of 5-cardiac cycles, it is likely that the effects of these baseline changes accumulate over the years in a non-linear fashion.
Despite these extensive patient specific simulations, there remain limitations inherent to the computational techniques employed.32 The fluid dynamics simulations cannot, for example, account for the progression of milder grades of aortic regurgitation and chronic valvular tissue remodeling.33,34 While there were significant WSS distribution differences at the aortic valve leaflet tips, our methods don’t allow for causal inferences to be drawn from the association between TAWSS and long-term commissural fusion and valvular remodeling. Our current work is also limited by the lack of realistic fluid-structure interactions (FSI) in our simulations. We have recently developed methods to resolve the tissue properties of the aortic valve leaflets under a range of pressure conditions, though these have not yet been integrated within SimVascular and require further validation.35,36 Furthermore, the coronary arteries were poorly resolved preventing the accurate quantification of coronary flow under LVAD support. Nonetheless, our work is the most comprehensive simulation study on LVAD patients to date, using clinically validated target variables, patient-specific vascular and aortic leaflet models, and novel advection-diffusion solvers run on individually tuned boundary conditions. Finally, from a translational standpoint, increases in numerical efficiency and computational power ensure that these simulations can be readily performed within clinically actionable timeframes.
Conclusions
The post-surgical configuration determines the hemodynamic profile, and thus computational fluid dynamics serves a unique role in assessing LVAD patients for follow up where 4D-MRI remains unfeasible. In this study we identified that with LVAD support, the aortic root is largely a region of vascular stasis, with significantly higher WSS on the leaflet tips in patients with AI.
Clinical Perspective.
What’s New?
In this study, we utilize individually tuned vascular resistances and boundary conditions, patient and device-specific flow profiles, and a complete 3-dimensional reconstruction of the aortic valve, aorta, and major arch vessels in LVAD patients
Contrary to the widely accepted notions of highly disturbed flow, we demonstrate that the aortic root is a region of relatively stagnant flow with varying levels of recirculation and low wall shear stresses.
We describe unique localized elevations of shear stress at the aortic valve leaflet tips – regions known to undergo pathological dystrophic changes under long-term LVAD support.
What are the clinical implications?
The post-surgical configuration determines the hemodynamic profile, and thus computational fluid dynamics serves a unique role in assessing LVAD patients for follow up where 4D-MRI remains unfeasible.
Acknowledgements
Some of the computing for this project was performed on the Sherlock cluster. We would like to thank Stanford University and the Stanford Research Computing Center for providing computational resources and support that contributed to these research results.
Sources of Funding
Alexander D. Kaiser was supported in part by a grant from the National Heart, Lung and Blood Institute 1T32HL098049 (Training Program in Mechanisms and Innovation in Vascular Disease at Stanford). Alexander D. Kaiser and Alison L. Marsden were supported in part by the National Science Foundation SSI grant #1663671. Rohan Shad was supported in part by the American Heart Association Postdoctoral Fellowship Award (Grant #834986)
Non-standard Abbreviations and Acronyms
- LVADs
Left ventricular assist devices
- AI
Aortic incompetence
- CFD
Computational fluid dynamics
- CT
Computed tomography
- TAWSS
Time-averaged wall shear stresses
- OSI
Oscillatory shear indices
Footnotes
Disclosures
None.
References
- 1.Holley CT, Fitzpatrick M, Roy SS, Alraies MC, Cogswell R, Souslian L, Eckman P, John R. Aortic insufficiency in continuous-flow left ventricular assist device support patients is common but does not impact long-term mortality. J Heart Lung Transplant. 2017;36:91–96. [DOI] [PubMed] [Google Scholar]
- 2.Truby LK, Garan AR, Givens RC, Wayda B, Takeda K, Yuzefpolskaya M, Colombo PC, Naka Y, Takayama H, Topkara VK. Aortic Insufficiency During Contemporary Left Ventricular Assist Device Support: Analysis of the INTERMACS Registry. JACC Heart Fail. 2018;6:951–960. [DOI] [PMC free article] [PubMed] [Google Scholar]
- 3.Cowger J, Pagani FD, Haft JW, Romano MA, Aaronson KD, Kolias TJ. The Development of Aortic Insufficiency in Left Ventricular Assist Device-Supported Patients. Circ Heart Fail. 2010;3:668–674. [DOI] [PMC free article] [PubMed] [Google Scholar]
- 4.Updegrove A, Wilson NM, Merkow J, Lan H, Marsden AL, Shadden SC. SimVascular: An Open Source Pipeline for Cardiovascular Simulation. Ann Biomed Eng. 2017;45:525–541. [DOI] [PMC free article] [PubMed] [Google Scholar]
- 5.Lan H, Updegrove A, Wilson NM, Maher GD, Shadden SC, Marsden AL. A Re-Engineered Software Interface and Workflow for the Open-Source SimVascular Cardiovascular Modeling Package. J Biomech Eng. 2018;140:024501. [DOI] [PMC free article] [PubMed] [Google Scholar]
- 6.Kim HJ, Vignon-Clementel IE, Figueroa CA, Ladisa JF, Jansen KE, Feinstein JA, Taylor CA. On coupling a lumped parameter heart model and a three-dimensional finite element aorta model. Ann Biomed Eng. 2009;37:2153–2169. [DOI] [PubMed] [Google Scholar]
- 7.Esmaily-Moghadam M, Hsia T-Y, Marsden AL. A non-discrete method for computation of residence time in fluid mechanics simulations. Phys Fluids. 2013;25:110802. [DOI] [PMC free article] [PubMed] [Google Scholar]
- 8.Ahmad Bakir A, Al Abed A, Stevens MC, Lovell NH, Dokos S. A Multiphysics Biventricular Cardiac Model: Simulations With a Left-Ventricular Assist Device. Front Physiol. 2018;9:1259. [DOI] [PMC free article] [PubMed] [Google Scholar]
- 9.Yoshida S, Toda K, Miyagawa S, Sawa Y. Computational fluid dynamics visualizes turbulent flow in the aortic root of a patient under continuous-flow left ventricular assist device support. J Thorac Cardiovasc Surg. 2020;159:e205–e207. [DOI] [PubMed] [Google Scholar]
- 10.Kasinpila P, Kong S, Fong R, Shad R, Kaiser AD, Marsden AL, Woo YJ, Hiesinger W. Use of patient-specific computational models for optimization of aortic insufficiency after implantation of left ventricular assist device. J Thorac Cardiovasc Surg. 2020;S0022522320311739. [DOI] [PMC free article] [PubMed] [Google Scholar]
- 11.Stainback RF, Estep JD, Agler DA, Birks EJ, Bremer M, Hung J, Kirkpatrick JN, Rogers JG, Shah NR. Echocardiography in the Management of Patients with Left Ventricular Assist Devices: Recommendations from the American Society of Echocardiography. J Am Soc Echocardiogr. 2015;28:853–909. [DOI] [PubMed] [Google Scholar]
- 12.Laskey WK, Parker HG, Ferrari VA, Kussmaul WG, Noordergraaf A. Estimation of total systemic arterial compliance in humans. J Appl Physiol Bethesda Md 1985. 1990;69:112–119. [DOI] [PubMed] [Google Scholar]
- 13.Barić D Why pulsatility still matters: a review of current knowledge. Croat Med J. 2014;55:609–620. [DOI] [PMC free article] [PubMed] [Google Scholar]
- 14.Westaby S, Bertoni GB, Clelland C, Nishinaka T, Frazier OH. Circulatory support with attenuated pulse pressure alters human aortic wall morphology. J Thorac Cardiovasc Surg. 2007;133:575–576. [DOI] [PubMed] [Google Scholar]
- 15.Nishimura T, Tatsumi E, Takaichi S, Taenaka Y, Wakisaka Y, Nakatani T, Masuzawa T, Takewa Y, Nakamura M, Endo S, Nakata M, Takano H. Prolonged nonpulsatile left heart bypass with reduced systemic pulse pressure causes morphological changes in the aortic wall. Artif Organs. 1998;22:405–410. [DOI] [PubMed] [Google Scholar]
- 16.Guha A, Eshelbrenner CL, Richards DM, Monsour HP. Gastrointestinal Bleeding After Continuous-flow Left Ventricular Device Implantation: Review of Pathophysiology and Management. Methodist DeBakey Cardiovasc J. 2015;11:24–27. [DOI] [PMC free article] [PubMed] [Google Scholar]
- 17.Wever-Pinzon O, Selzman CH, Drakos SG, Saidi A, Stoddard GJ, Gilbert EM, Labedi M, Reid BB, Davis ES, Kfoury AG, Li DY, Stehlik J, Bader F. Pulsatility and the risk of nonsurgical bleeding in patients supported with the continuous-flow left ventricular assist device HeartMate II. Circ Heart Fail. 2013;6:517–526. [DOI] [PubMed] [Google Scholar]
- 18.Habazettl H, Kukucka M, Weng YG, Kuebler WM, Hetzer R, Kuppe H, Pries AR. Arteriolar Blood Flow Pulsatility in a Patient Before and After Implantation of an Axial Flow Pump. Ann Thorac Surg. 2006;81:1109–1111. [DOI] [PubMed] [Google Scholar]
- 19.Kihara S, Litwak KN, Nichols L, Litwak P, Kameneva MV, Wu Z, Kormos RL, Griffith BP. Smooth muscle cell hypertrophy of renal cortex arteries with chronic continuous flow left ventricular assist. Ann Thorac Surg. 2003;75:178–83; discussion 183. [DOI] [PubMed] [Google Scholar]
- 20.Caruso MV, Gramigna V, Rossi M, Serraino GF, Renzulli A, Fragomeni G. A computational fluid dynamics comparison between differentoutflow graft anastomosis locations of Left Ventricular Assist Device (LVAD) in a patient-specific aortic model. Int J Numer Methods Biomed Eng. 2015;31:e02700. [DOI] [PubMed] [Google Scholar]
- 21.Ku DN, Giddens DP, Zarins CK, Glagov S. Pulsatile flow and atherosclerosis in the human carotid bifurcation. Positive correlation between plaque location and low oscillating shear stress. Arterioscler Dallas Tex. 1985;5:293–302. [DOI] [PubMed] [Google Scholar]
- 22.Rose AG, Park SJ, Bank AJ, Miller LW. Partial aortic valve fusion induced by left ventricular assist device. Ann Thorac Surg. 2000;70:1270–1274. [DOI] [PubMed] [Google Scholar]
- 23.Karmonik C, Partovi S, Loebe M, Schmack B, Weymann A, Lumsden AB, Karck M, Ruhparwar A. Computational fluid dynamics in patients with continuous-flow left ventricular assist device support show hemodynamic alterations in the ascending aorta. J Thorac Cardiovasc Surg. 2014;147:1326–1333.e1. [DOI] [PubMed] [Google Scholar]
- 24.Xenos M, Girdhar G, Alemu Y, Jesty J, Slepian M, Einav S, Bluestein D. Device Thrombogenicity Emulator (DTE) − Design optimization methodology for cardiovascular devices: A study in two bileaflet MHV designs. J Biomech. 2010;43:2400–2409. [DOI] [PMC free article] [PubMed] [Google Scholar]
- 25.Hellums JD, Peterson DM, Stathopoulos NA, Moake JL, Giorgio TD. Studies on the Mechanisms of Shear-Induced Platelet Activation. In: Hartmann A, Kuschinsky W, editors. Cerebral Ischemia and Hemorheology. Berlin, Heidelberg: Springer; 1987. p. 80–89. [Google Scholar]
- 26.Chivukula VK, Beckman JA, Prisco AR, Dardas T, Lin S, Smith JW, Mokadam NA, Aliseda A, Mahr C. Left Ventricular Assist Device Inflow Cannula Angle and Thrombosis Risk. Circ Heart Fail. 2018;11:e004325. [DOI] [PubMed] [Google Scholar]
- 27.Letsou GV, Connelly JH, Delgado RM, Myers TJ, Gregoric ID, Smart FW, Frazier OH. Is Native Aortic Valve Commissural Fusion in Patients With Long-term Left Ventricular Assist Devices Associated With Clinically Important Aortic Insufficiency? J Heart Lung Transplant. 2006;25:395–399. [DOI] [PubMed] [Google Scholar]
- 28.Martina JR, Schipper MEI, De Jonge N, Ramjankhan F, De Weger RA, Lahpor JR, Vink A. Analysis of aortic valve commissural fusion after support with continuous-flow left ventricular assist device. Interact Cardiovasc Thorac Surg. 2013;17:616–624. [DOI] [PMC free article] [PubMed] [Google Scholar]
- 29.Chistiakov DA, Orekhov AN, Bobryshev YV. Effects of shear stress on endothelial cells: go with the flow. Acta Physiol. 2017;219:382–408. [DOI] [PubMed] [Google Scholar]
- 30.Shav D, Gotlieb R, Zaretsky U, Elad D, Einav S. Wall shear stress effects on endothelial-endothelial and endothelial-smooth muscle cell interactions in tissue engineered models of the vascular wall. PLoS ONE. 2014;9. [DOI] [PMC free article] [PubMed] [Google Scholar]
- 31.Deo SV, Sharma V, Cho YH, Shah IK, Park SJ. De novo aortic insufficiency during long-term support on a left ventricular assist device: A systematic review and meta-analysis. ASAIO J. 2014;60:183–188. [DOI] [PubMed] [Google Scholar]
- 32.Marsden AL, Esmaily-Moghadam M. Multiscale Modeling of Cardiovascular Flows for Clinical Decision Support. Appl Mech Rev. 2015;67:030804. [Google Scholar]
- 33.Sacks MS, Yoganathan AP. Heart valve function: a biomechanical perspective. Philos Trans R Soc B Biol Sci. 2007;362:1369–1391. [DOI] [PMC free article] [PubMed] [Google Scholar]
- 34.Ambrosi D, Ben Amar M, Cyron CJ, DeSimone A, Goriely A, Humphrey JD, Kuhl E. Growth and remodelling of living tissues: perspectives, challenges and opportunities. J R Soc Interface. 2019;16:20190233. [DOI] [PMC free article] [PubMed] [Google Scholar]
- 35.Bäumler K, Vedula V, Sailer AM, Seo J, Chiu P, Mistelbauer G, Chan FP, Fischbein MP, Marsden AL, Fleischmann D. Fluid–structure interaction simulations of patient-specific aortic dissection. Biomech Model Mechanobiol. 2020;19:1607–1628 [DOI] [PubMed] [Google Scholar]
- 36.Kaiser AD, Shad R, Hiesinger W, Marsden AL. A Design-Based Model of the Aortic Valve for Fluid-Structure Interaction. ArXiv.org. Preprint posted on 5 October 2020. arXiv:2010.02346 [DOI] [PMC free article] [PubMed] [Google Scholar]