

Abstract
Low reward responsiveness (RR) is associated with poor psychological wellbeing, psychiatric disorder risk, and psychotropic treatment resistance. Functional MRI studies have reported decreased activity within the brain’s reward network in individuals with RR deficits, however the neurochemistry underlying network hypofunction in those with low RR remains unclear. This study employed ultra-high field Glutamate Chemical Exchange Saturation Transfer (GluCEST) imaging to investigate the hypothesis that glutamatergic deficits within the reward network contribute to low RR. GluCEST images were acquired at 7.0T from 45 participants (ages 15–29, 30 females) including 15 healthy individuals, 11 with depression, and 19 with psychosis spectrum symptoms. The GluCEST contrast, a measure sensitive to local glutamate concentration, was quantified in a meta-analytically defined reward network comprised of cortical, subcortical, and brainstem regions. Associations between brain GluCEST contrast and Behavioral Activation System Scale RR scores were assessed using multiple linear regressions. Analyses revealed that reward network GluCEST contrast was positively and selectively associated with RR, but not other clinical features. Follow-up analyses identified that this association was driven by the subcortical reward network and network areas that encode the salience of valenced stimuli. We observed no association between RR and the GluCEST contrast within non-reward cortex. This study thus provides new evidence that reward network glutamate levels contribute to individual differences in RR. Decreased reward network excitatory neurotransmission or metabolism may be mechanisms driving reward network hypofunction and RR deficits. These findings provide a framework for understanding the efficacy of glutamate-modulating psychotropics such as ketamine for treating anhedonia.
INTRODUCTION
Reward responsiveness (RR) is a psychological construct that indexes an individual’s capacity to experience pleasure or positive affect from the anticipation or attainment of rewards, and that falls within the Research Domain Criteria (RDoC) Positive Valence Domain of human functioning. Low RR is a symptom common to diverse psychiatric disorders including depression and psychosis spectrum disorders that predicts poor treatment response and prognosis [1–5]. In individuals without a diagnosable psychiatric disorder, low RR is furthermore associated with increased risk of developing psychopathology [6–8]. RR is thus a dimensional construct associated with psychological wellbeing [9] that cuts across both DSM-defined diagnostic categories and clinical versus non-clinical samples. Elucidating neural features that contribute to individual differences in RR has broad implications for understanding the neurobiology of psychiatric illness and pharmacological treatment response.
Functional MRI studies have provided insight into circuit-level correlates of RR, demonstrating that lower RR is associated with lower activity [10–15] and connectivity [10, 16] within the brain’s reward network. This pattern of altered brain function has been observed both in patients with psychiatric disorders that affect RR [13, 14, 16] and in healthy individuals with non-clinical anhedonia [10–12]. Compromised reward network functioning has therefore been directly implicated in the expression of reward-related deficits. Nevertheless, the neurochemical mechanisms underlying such network hypofunction in those with lower RR remain unclear. Although dopamine is classically associated with reward, glutamate is also a major modulator of reward network functioning [17–22]. Mesolimbic reward pathway dopaminergic inputs from the ventral tegmental area to the ventral striatum are largely activated by glutamatergic neurotransmission [20, 23], hence glutamate impacts reward anticipation and incentive salience. Furthermore, large glutamatergic efferents connecting the prefrontal cortex to the striatum can influence motivation and evaluation of stimulus valence [18, 20, 24]. Given the potential for glutamatergic signaling to affect diverse aspects of reward responsivity, here we investigate the hypothesis that glutamatergic deficits within the reward network contribute to diminished RR.
This hypothesis is motivated in part by results from preclinical and clinical studies that pharmacologically manipulate the glutamatergic system. In rodents and non-human primates, antagonism of AMPA and group 1 metabotropic glutamate receptors decreases the rewarding effects of drugs and food [25–28]. In humans, ketamine—which indirectly drives glutamatergic activation of AMPA receptors on excitatory neurons via interneuron NMDA blockade [29, 30]—is capable of rapidly reducing anhedonia [31, 32]. Though convergent evidence from preclinical and clinical studies indicates that glutamate availability in reward-associated regions may be a critical modulator of RR, validation in humans remains elusive. This noteworthy gap in the literature exists in part due to limitations in our ability to study glutamate in the brain in vivo.
To date, proton magnetic resonance spectroscopy (1HMRS) has been the method most commonly used to study glutamate in vivo [33]. A main benefit of 1HMRS is that it can simultaneously measure the concentration of diverse neurochemicals, including glutamate, creatine, choline, myo-inositol, glutathione, and N-acetylaspartate, providing important insight into brain biochemistry and relationships amongst neurometabolites. Its utility in measuring glutamate, however, is principally limited by the low concentration of glutamate in the brain compared to water and resonance overlap with glutamine and GABA [34, 35]. This study therefore harnesses a complementary approach to imaging brain glutamate at ultra-high field (7.0T): Glutamate Chemical Exchange Saturation Transfer (GluCEST) imaging [36, 37]. GluCEST is a magnetization transfer-based method that measures glutamate levels via a water pool-dependent imaging contrast, thus largely overcoming the concentration limitations of 1HMRS. Critically, the magnitude of the contrast effect observed, quantified as the GluCEST contrast, is proportional to the local concentration of glutamate [36]. While both 1HMRS and GluCEST have inherent pros and cons, key advantages of GluCEST include a substantial increase in sensitivity to glutamate [36] and the ability to more directly mitigate effects of cerebrospinal fluid contamination on glutamate quantification. Moreover, GluCEST produces a high-resolution image that covers a large expanse of the brain with small voxel sizes (a 5 mm thick sagittal slice with complete in-plane brain coverage), thereby providing enhanced spatial coverage and spatial resolution [34].
Here, we quantified the GluCEST contrast in a meta-analytic reward network in individuals with and without diagnosable psychopathologies to test the overarching hypothesis that individual variation in RR is affected by brain glutamate. Based on aforementioned results from functional MRI studies and trials of glutamate-modulating psychotropics, we predicted that reduced RR would be associated with lower levels of reward network glutamate. Further, because the total reward network is a neuroanatomically expansive network encompassing areas that respond to rewards, areas that respond to negative outcomes, and areas that encode the magnitude of both rewarding and negative outcomes, we undertook analyses designed to provide anatomical- and valence-specificity regarding the relationship between brain GluCEST and RR.
METHODS
Participants
To sample a broad range of RR, we studied healthy individuals and individuals with psychiatric conditions that can affect RR. The final study sample (N=45, ages 15–29, 30 female) thus included a typically developing group (no Axis I diagnoses or subthreshold psychosis symptomatology, no history of psychotropic medication use, N=15) and a clinical group comprised of individuals classified by doctoral-level clinician scientists (TDS, CK, MEC) as having depressive disorders (N=11) or psychosis spectrum disorders (N=19 total, including 12 with clinical high risk symptoms and 7 with a diagnosed psychotic disorder). Study exclusion criteria and participant medication information are reported in the Supplementary Information (SI). All procedures were approved by the Institutional Review Boards of the University of Pennsylvania and/or the Children’s Hospital of Philadelphia. All participants over the age of 18 provided written informed consent prior to study participation. For minors, informed assent and written parental consent were obtained.
Clinical Questionnaires
To assess RR, participants completed the Behavioral Activation System (BAS) Scale [38]. Factor analyses have identified three independent, empirically-derived BAS subscales, which have been validated in both non-clinical and psychiatric samples [16, 38–40]: BAS Reward Responsiveness (BAS RR), BAS Drive, and BAS Fun Seeking. The five BAS RR items were reverse scored and summed to produce a dimensional, trait-like measure of RR [38, 41] ranging from 5 (low RR) to 20 (high RR). Participants additionally completed the Patient-Reported Outcomes Measurement Information System (PROMIS) Depression scale and the PRIME Screen-Revised (PS-R) [42, 43]. These scales were used to generate graded measures of depression severity and subthreshold positive psychosis symptom severity, respectively.
MRI Acquisition
MRI data were acquired on a 7.0T Siemens Terra at the University of Pennsylvania. Acquisition of GluCEST images and B0 and B1 maps was completed as described in previous studies [36, 44], and as detailed extensively in the SI. Briefly, GluCEST images were acquired in a 5 mm sagittal slice (slice number: 1, slice thickness: 5 mm) positioned in the right hemisphere to cover key reward network regions. This GluCEST field of view (FOV) offers full in-plane brain coverage (matrix size: 224 × 224) with 1 × 1 mm2 in-plane resolution [36, 44]. Structural images including T1-weighted uniform (UNI) images and corresponding INV1 and INV2 images were acquired with a Magnetization
Prepared 2 Rapid Acquisition Gradient Echoes (MP2RAGE) sequence (acquisition details in SI) [45]. GluCEST and MP2RAGE data were originally acquired from a total of 53 participants. Raw and processed UNI images, GluCEST images, B0 maps, and B1 maps from all 53 participants underwent stringent visual quality control procedures. Eight of the 53 participants were ultimately excluded from the study due to identifiable motion in GluCEST images or the presence of large inhomogeneity artifacts in B0 maps, resulting in the final analytic study sample of N=45 individuals from which all reported results were obtained.
MR Image Processing
Figure 1 provides an overview of the image analysis pipeline.
Figure 1. Overview of Structural and GluCEST Processing.
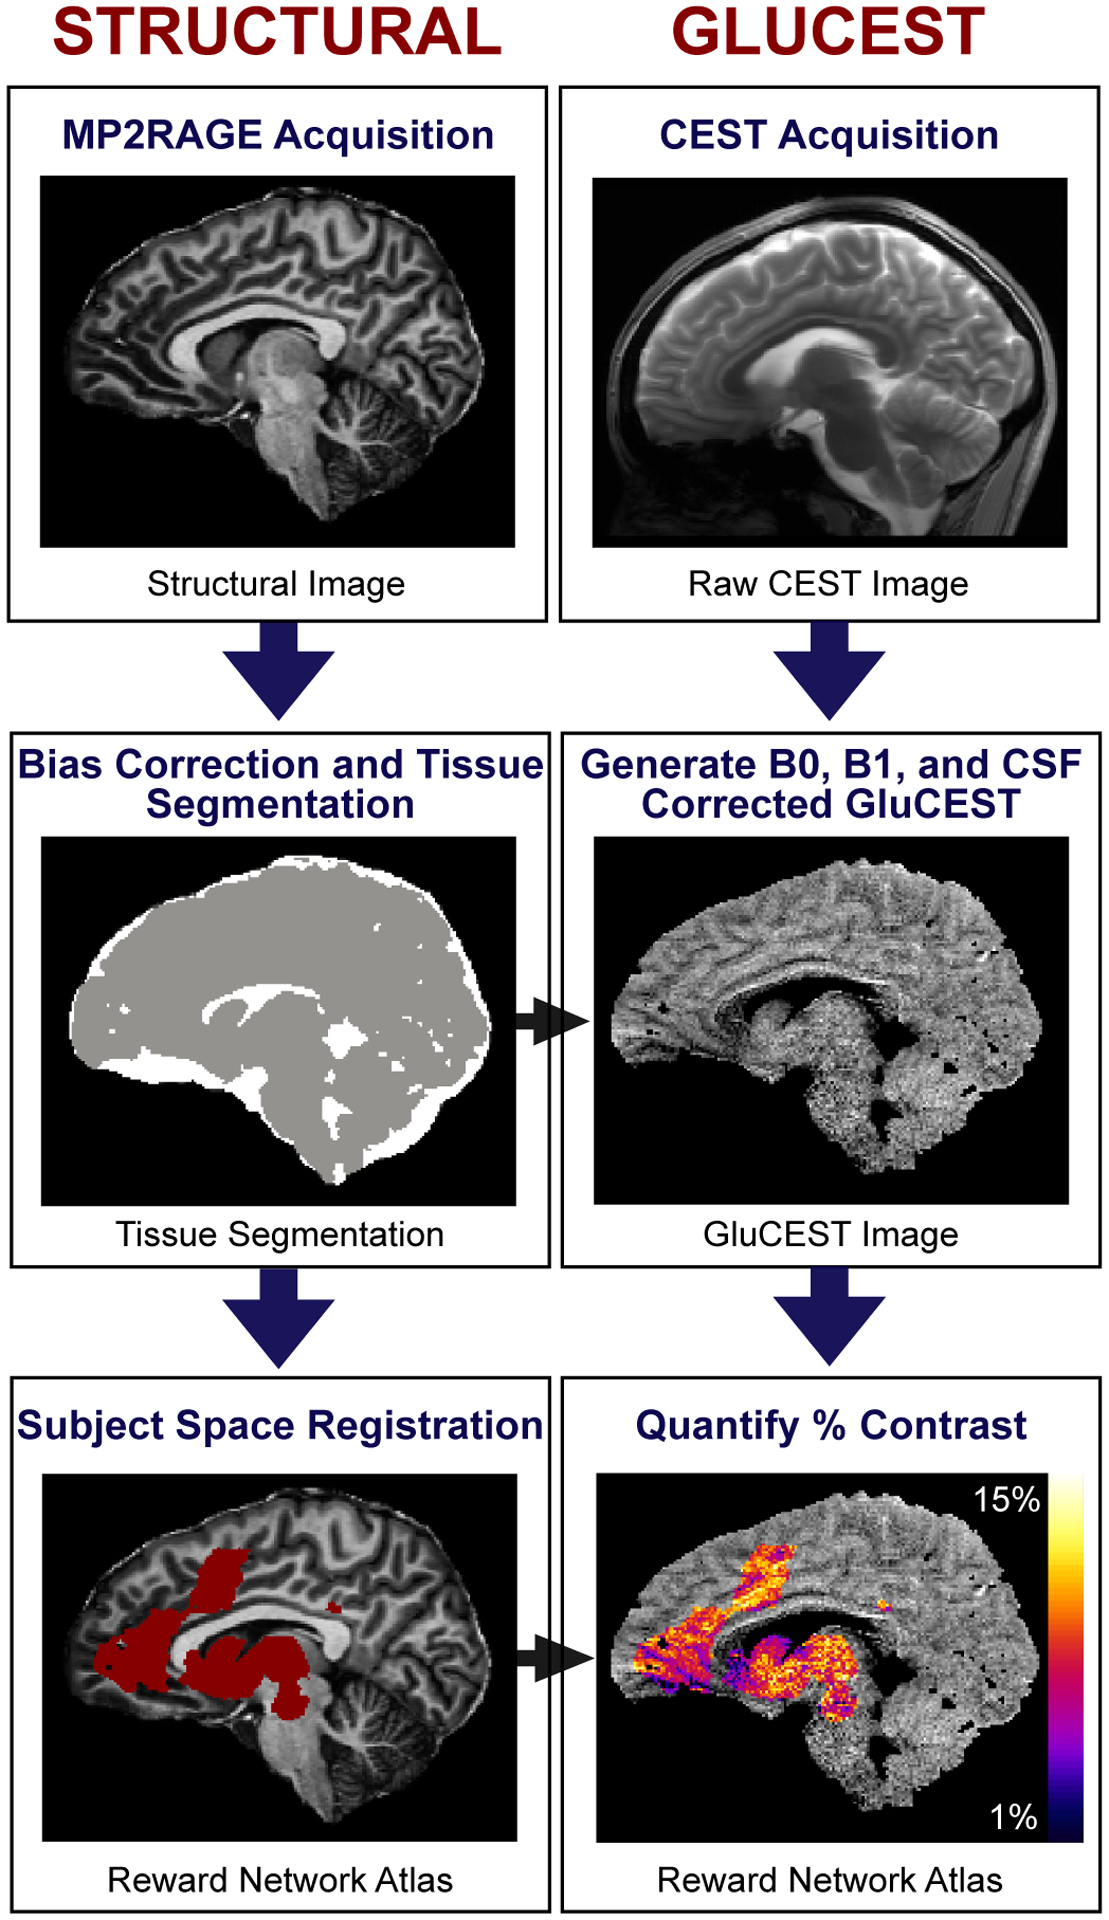
Structural: Structural images acquired as part of the 7.0T Magnetization Prepared 2 Rapid Acquisition Gradient Echoes (MP2RAGE) sequence were bias field corrected and used to generate tissue segmentation maps (cerebrospinal fluid voxels shown in white, brain tissue in gray). Atlases were registered from MNI space to participant images. GluCEST: B0 and B1 inhomogeneity-corrected GluCEST images were generated from raw Chemical Exchange Saturation Transfer (CEST) images, and voxels labeled as cerebrospinal fluid (CSF) by tissue segmentation maps were removed from final GluCEST images. The GluCEST contrast was then estimated in the meta-analytic reward network. The color bar (bottom right) represents the average GluCEST contrast in each 1 × 1 × 5 mm3 GluCEST voxel, scaled from 1% contrast (dark blue) to 15% contrast (light yellow).
Structural Image Processing
INV2 and UNI images were bias field corrected using Advanced Normalization Tools (ANTs) N4 [46], and used for tissue segmentation and atlas registration, respectively. FSL FAST [47] was employed to generate three tissue segmentation maps and gray matter density maps. In order to register atlases from MNI space to participant images, UNI images were first non-linearly registered to the MNI152 nonlinear T1 template using ANTs symmetric diffeomorphic image normalization [48].
GluCEST Image Processing
GluCEST images represent the GluCEST contrast (%) in each voxel (equation in SI). GluCEST images were first corrected for B0 and B1 inhomogeneity effects using in-house Matlab software, as previously described [36, 44]. As prior, voxels that had a B0 offset of greater than ± 1 ppm and voxels with relative B1 values outside of the 0.3–1.3 range were excluded [44], as were voxels labeled as cerebrospinal fluid by tissue segmentation maps.
Reward Network Delineation
To study the relationship between reward network GluCEST and RR, we delineated the reward network (Figure 2A) using a recent meta-analysis of 206 functional MRI studies [49] (further meta-analysis details are provided in the SI). The meta-analytic reward network atlas was aligned from MNI space to GluCEST images by applying the inverse of pre-computed composite UNI-to-MNI transforms, and extracting the portion of the atlas that corresponded to a participant’s GluCEST FOV. It should be noted that the GluCEST FOV did not provide complete coverage of the reward network. Accordingly, the percent of the network included in each participant’s GluCEST acquisition was calculated to provide an estimate of network spatial coverage, and included as a model covariate in a sensitivity analysis.
Figure 2. Association Between Dimensional Reward Responsiveness and Reward Network GluCEST.
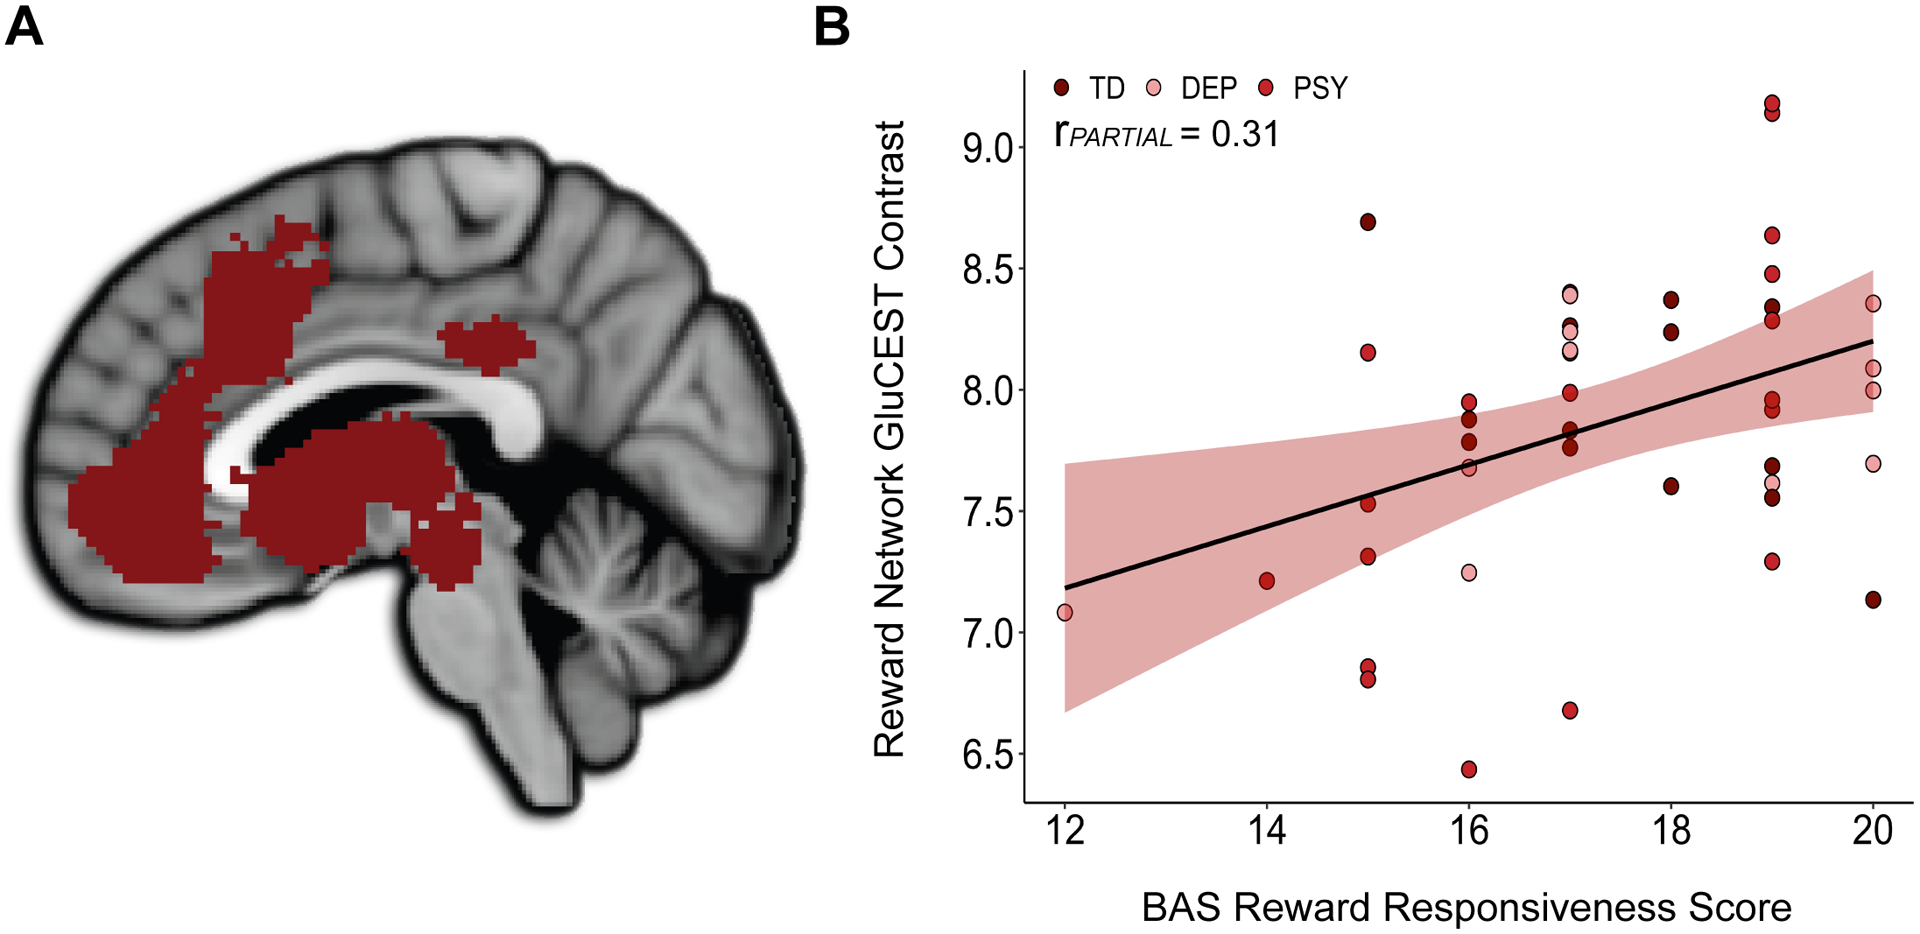
A) The meta-analytically defined reward network comprised of cortical, subcortical, and upper brainstem regions. B) Reward network GluCEST contrast was positively associated with BAS Reward Responsiveness scores across typically developing and clinical groups. Data points are differently colored for typically developing (TD) individuals, individuals with a depressive disorder (DEP), and individuals with a psychosis spectrum disorder (PSY).
Given that the reward network is inherently heterogeneous in both regional anatomy and valence-encoding, we furthermore subdivided the meta-analytic reward network both structurally and functionally for analyses designed to enhance the anatomical and functional precision of our primary results. Specifically, we independently evaluated cortical and subcortical regions of the network, defined using Harvard-Oxford [50] cortical and subcortical atlases. We additionally partitioned the network into three valence-specific components based on the original meta-analysis [49], including an appetitive/positive valence encoding component, an aversive/negative valence encoding component, and a salience component.
Statistical Analysis
Statistical analyses were performed in R 4.0.2. We investigated associations between GluCEST contrast and BAS RR scores across the entire sample using multiple linear regressions. All regressions reported controlled for age and sex and met linearity, homoscedasticity, and normality assumptions. For each multiple regression analysis, the individual predictor t-value quantifying the association between GluCEST and BAS RR scores was used to calculate a partial r value (rPARTIAL): an estimate of the association effect size. False discovery rate correction (FDR; pFDR) was employed to correct for multiple comparisons within anatomical and valence-specific follow-up analyses. Following the main analyses, we conducted a series of rigorous sensitivity and specificity analyses to ensure that observed effects were not being driven by reward network gray matter density, reward network coverage, depression symptoms, psychosis symptoms, or scores on other BAS domains. Each of these variables was included as a model covariate in a multiple linear regression.
Code Availability
All analytic code is available at https://github.com/PennLINC/sydnor_glucest_rewardresponsiveness_2020.
RESULTS
BAS Reward Responsiveness Indexes RR Across Typically Developing and Clinical Groups
Sample demographics and clinical information are presented in Table 1. BAS RR scores were variable across the entire sample (min = 12, max = 20, mean = 17.4, SD = 1.9), reflecting the dimensional nature of this measure, and more variable in the clinical than the typically developing group (Table 1). There was a trend for BAS RR scores to be higher in females than males (t = 1.79, p = 0.081).
Table 1. Sample Demographics and Clinical Characteristics.
Age, sex, race, and clinical questionnaire score means are presented for the study sample, as well as for the typically developing and clinical groups that make up the sample. Differences between typically developing and clinical groups were evaluated using two-sided independent samples t-tests (for age and clinical scores) and Pearson’s chi-squared tests (for sex and race).
| Demographic and Clinical Variables | Study Sample N=45 |
Typically Developing N=15 |
Clinical N=30 |
T-test or Pearson’s Chi-squared |
|---|---|---|---|---|
| Age | 22.78 (2.8) | 22.60 (2.9) | 22.87 (2.8) | p = 0.770 |
| Female | 30 | 10 | 20 | |
| >1 race | 3 | 1 | 2 | |
| BAS Reward Responsiveness Score | 17.36 (1.9) | 17.53 (1.4) | 17.27 (2.1) | p = 0.658 |
| PROMIS Depression Symptom Score | 12.84 (6.3) | 9.73 (1.8) | 14.40 (7.1) | p = 0.002* |
| PS-R Positive Psychosis Symptom Score | 5.98 (9.7) | 0.53 (1.1) | 8.7 (10.9) | p < 0.001* |
Indicates a significant difference between groups in a two-sided independent samples t-test with unequal variances. BAS: Behavioral Activation System; PROMIS: Patient-Reported Outcomes Measurement Information System; PS-R: PRIME Screen-Revised.
Reward Network GluCEST Does Not Differ Between Typically Developing and Clinical Groups
Reward network GluCEST contrast did not significantly differ between the typically developing and clinical group in an ANCOVA controlled for age and sex, indicating that diagnostic status did not influence reward network glutamate level. Diagnostic status was, however, related to the GluCEST signal within specific, anatomically-defined regions of interest, in a manner that largely replicated previously published 7.0T 1HMRS case-control studies (see the SI for full results and comparisons to previous 1HMRS studies).
Reward Network GluCEST is Dimensionally Associated with RR
To investigate relationships between the dimensional construct of RR and glutamate within brain regions that do and do not subserve reward-related functions, we conducted a multiple regression with reward network GluCEST and non-reward network GluCEST as predictors of BAS RR. BAS RR scores were significantly positively associated with reward network GluCEST contrast in this model (estimate = 1.01, rPARTIAL = 0.31, p = 0.048; Figure 2). Highlighting the specificity of this association, BAS RR scores were not significantly associated with non-reward network GluCEST contrast, i.e. with GluCEST in regions not included in the meta-analytic reward network (estimate = 0.11, rPARTIAL = 0.03, p = 0.864). The association between BAS RR scores and reward network GluCEST contrast did not differ between males and females, as indicated by a non-significant interaction term (p = 0.693) between sex and GluCEST contrast for predicting BAS RR.
Association Between Reward Network GluCEST and RR is Driven by Subcortical Regions
Anatomical division of the total reward network into cortical and subcortical components (Figure 3A) revealed a non-significant association between BAS RR scores and cortical reward network GluCEST contrast. There was, however, a significant association between BAS RR scores and subcortical reward network GluCEST (estimate = 0.69, rPARTIAL = 0.37, pFDR = 0.027; Figure 3B), suggesting that the main result was driven by subcortical reward regions. In an exploratory analysis designed to provide enhanced anatomical resolution, we further divided the reward network into 11 distinct anatomical regions. Region-specific multiple regressions revealed the strongest associations between BAS RR scores and the GluCEST contrast within the caudate, posterior cingulate, and thalamus, followed by the brainstem (midbrain/upper pons) and the nucleus accumbens (Supplementary Figure 1), though results of these regional analyses did not survive FDR correction.
Figure 3. Association Between Dimensional Reward Responsiveness and Subcortical Reward Network GluCEST.
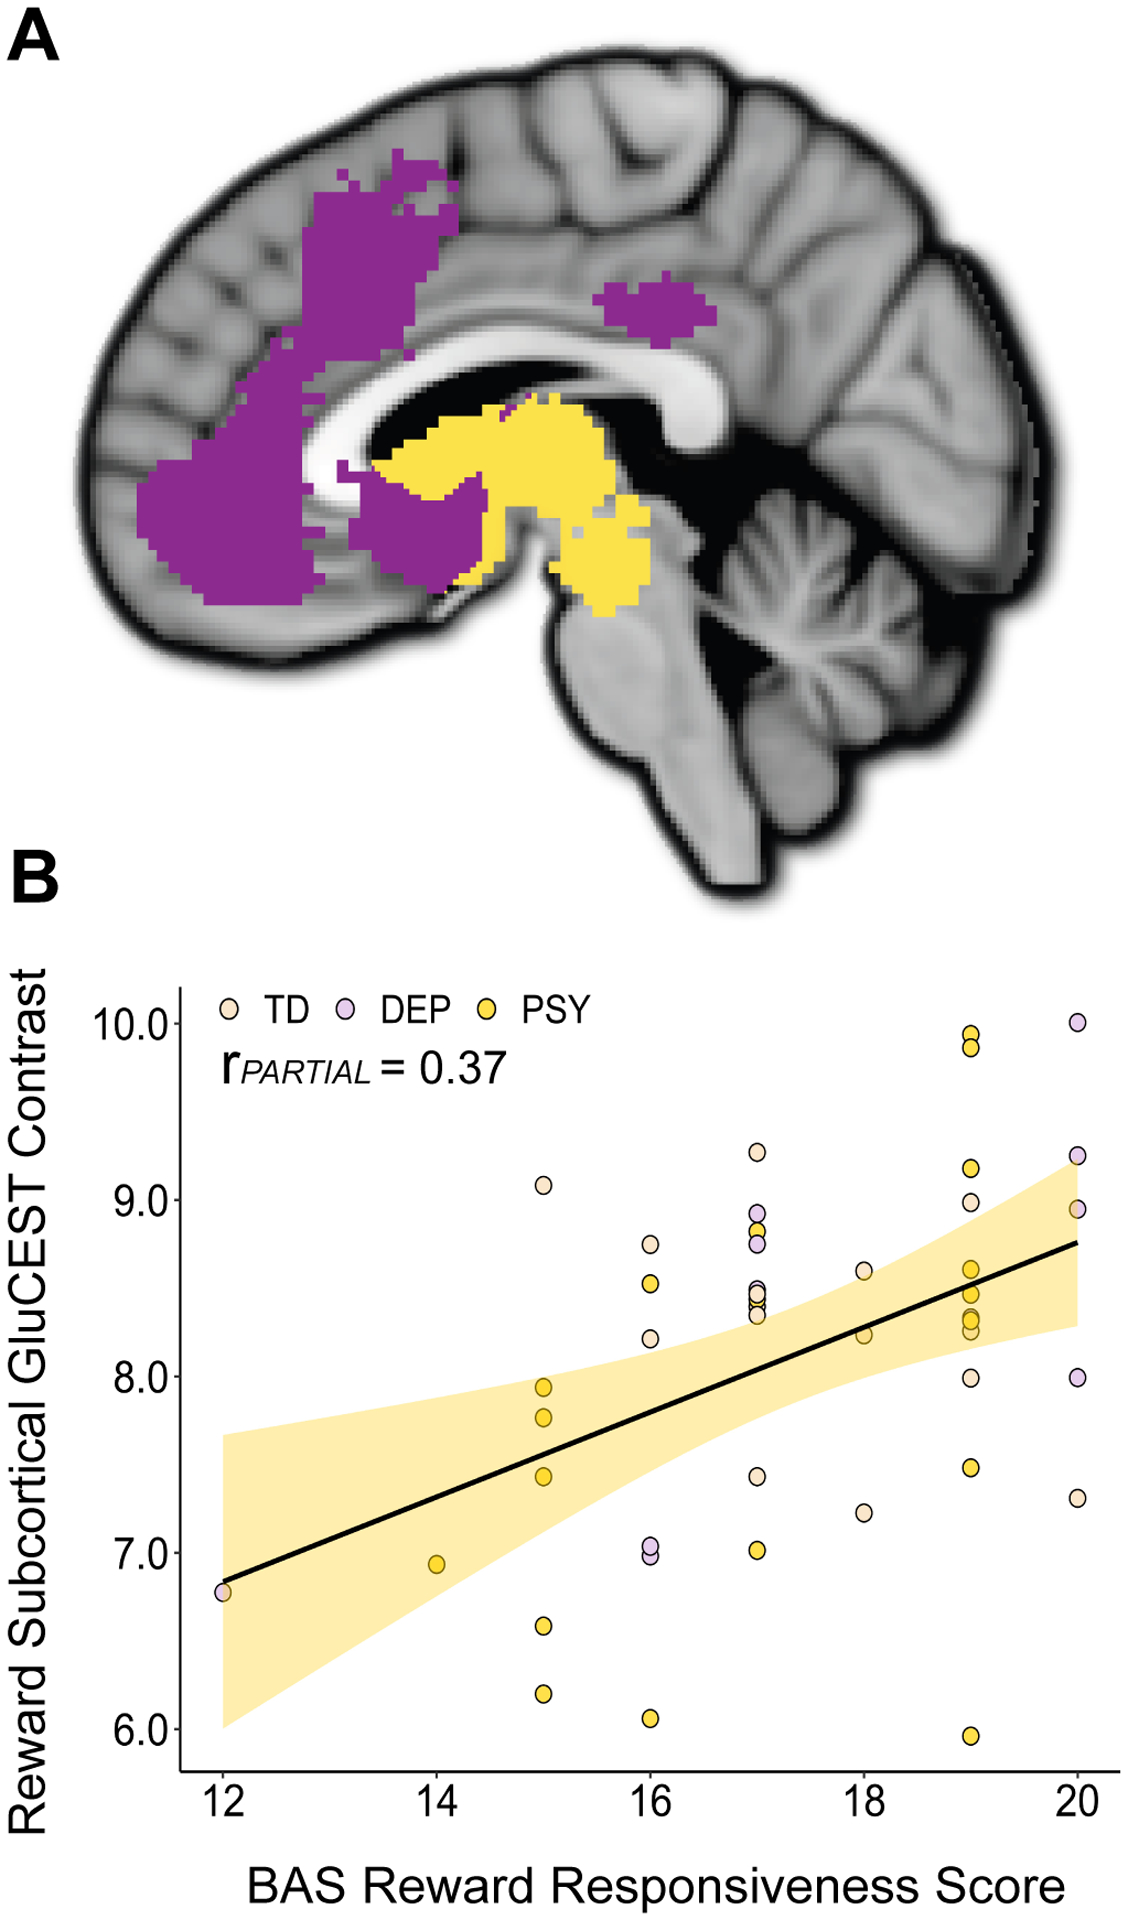
A) Cortical (purple) and subcortical (yellow) components of the reward network. B) GluCEST imaging revealed a significant association between BAS Reward Responsiveness scores and the GluCEST contrast in the subcortical reward network. Individual data points are colored based on diagnosis; TD: typically developing, DEP: depressive disorder, PSY: psychosis spectrum disorder.
Reward Network GluCEST Findings are Influenced by Valence-Encoding
The reward network was next functionally subdivided into 1) areas that are activated by appetitive stimuli only, 2) areas that are activated by aversive stimuli only, and 3) areas that respond to both appetitive and aversive stimuli, and are thus understood to encode the salience of valenced stimuli [49]. Independent, valence-specific multiple regressions revealed that the association between BAS RR scores and GluCEST contrast was significant in reward network regions responsive to stimulus salience (estimate = 0.95, rPARTIAL = 0.42, pFDR = 0.014) and trend-level in appetitive-encoding regions (estimate = 0.76, rPARTIAL = 0.29, pFDR = 0.083), but not significant in aversive-encoding regions (Figure 4).
Figure 4. Effect Size Determined by Valence Encoding.
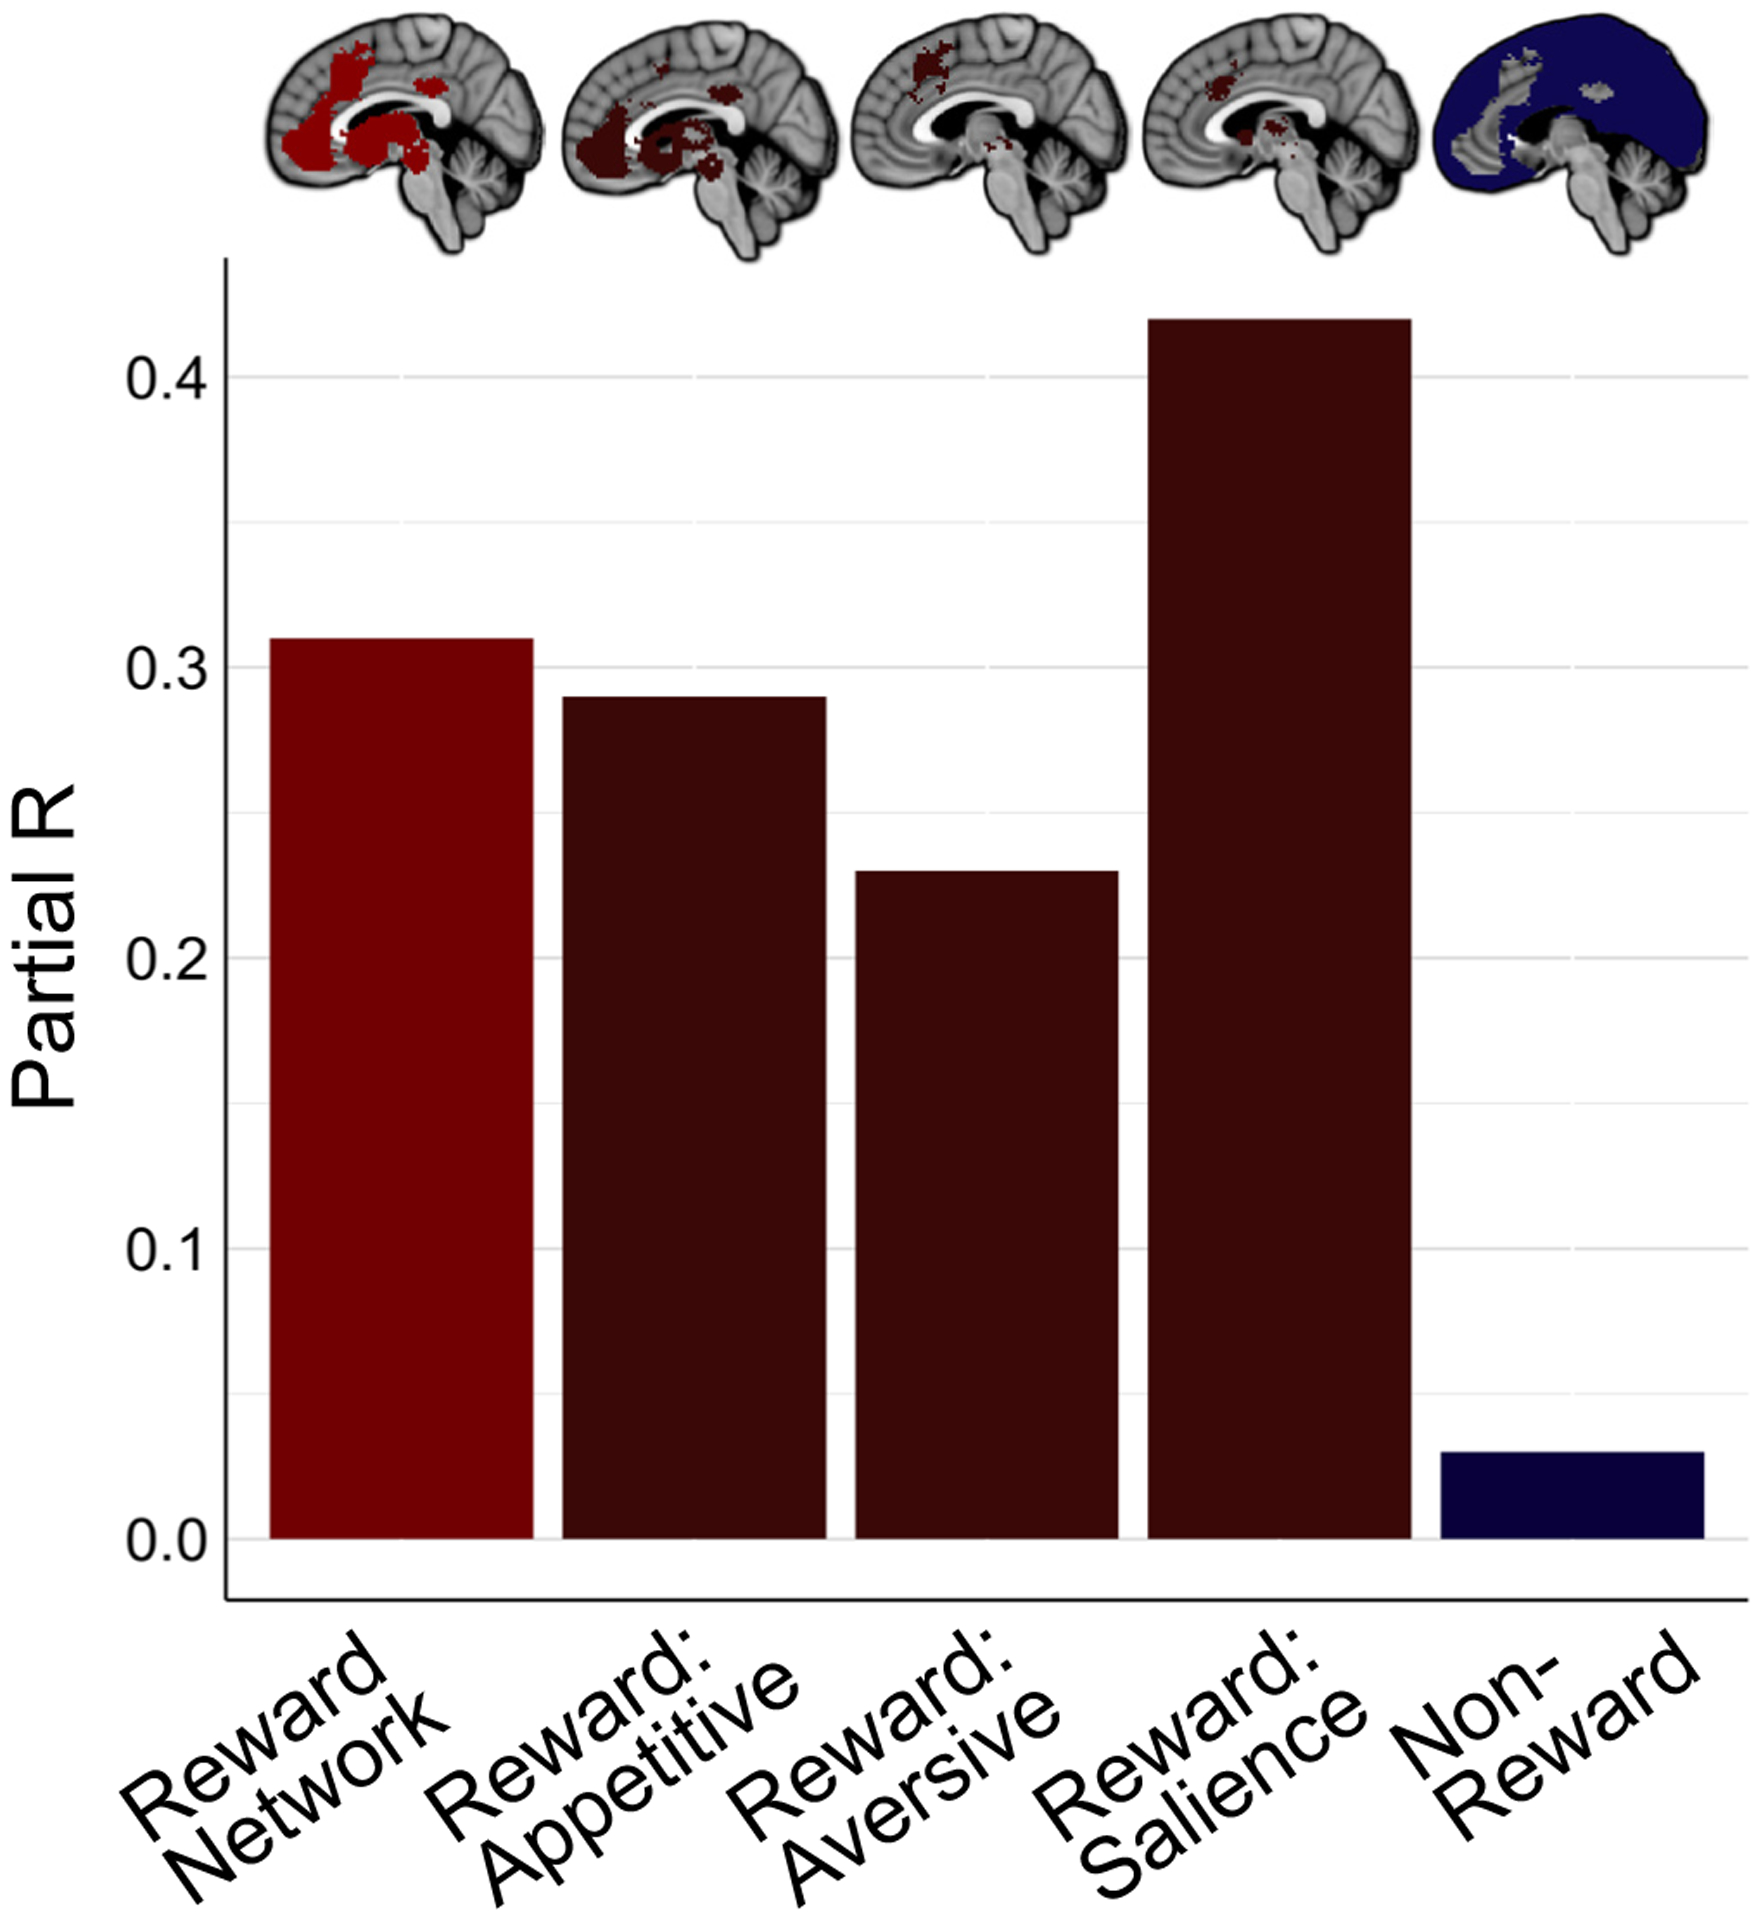
Effect sizes for the association between brain GluCEST contrast and BAS Reward Responsiveness scores for the total reward network, appetitive-encoding reward network regions, aversive-encoding reward network regions, salience-encoding reward network regions, and non-reward regions (left to right). Partial R values were derived from independent multiple linear regressions, as reported in the text.
Sensitivity Analyses Provide Convergent Results
A series of sensitivity analyses (all controlled for age and sex) confirmed that the association observed between reward network GluCEST contrast and RR was not attributable to other brain features, methodological considerations, or comorbid psychiatric symptoms. Specifically, the association between reward network GluCEST and BAS RR scores remained significant when controlling for reward network gray matter density (estimate = 1.06, rPARTIAL = 0.36, p = 0.020), indicating that differences in network tissue composition were not driving results. Given that the GluCEST FOV did not encompass the entirety of the reward network, we confirmed that controlling for percent coverage of the total reward network did not alter our findings (estimate = 1.05, rPARTIAL =0.35, p = 0.022). To further confirm that differential network coverage was not impacting results, we performed an exploratory analysis that only included reward network voxels for which greater than 50% of participants had GluCEST data. This did not impact significance (estimate = 0.90, rPARTIAL = 0.35, p = 0.022). Finally, the association between reward network GluCEST and BAS RR scores remained significant when controlling for typically developing versus clinical group (estimate = 1.04, rPARTIAL = 0.35, p = 0.024).
Reward Network GluCEST Associations are Specific to the Construct of RR
To confirm the specificity of the association between reward network GluCEST contrast and RR, we conducted specificity analyses using multiple regressions that included additional measures of clinical features. All models included age, sex, and BAS RR scores as predictors. Notably, in these models we did not find any significant associations between reward network GluCEST contrast and PS-R scores (p = 0.267), PROMIS Depression scores (p = 0.383), BAS Drive scores (p = 0.685), or BAS Fun Seeking scores (p = 0.371). Conversely, BAS RR remained significant or trend-level significant in all of these models (p = 0.016 covarying for PS-R, p = 0.081 covarying for PROMIS Depression, p = 0.022 covarying for BAS Drive, p = 0.085 covarying for BAS Fun Seeking).
GluCEST and Single Voxel 1HMRS Demonstrate Cross-Method Agreement
Finally, to compare results between GluCEST and 1HMRS, the method most frequently employed to measure brain glutamate in vivo, 1HMRS data were collected from a subsample of the 45 study participants (final N=20 following quality control procedures). 1HMRS data were collected from a single voxel of interest (VOI) positioned in the right anterior cingulate cortex, a frequently studied 1HMRS VOI in psychiatry [51–56]. Independent multiple regression analyses revealed that associations of BAS RR scores with both 1) 1HMRS-derived glutamate concentration within the VOI and 2) mean GluCEST within the VOI were similar in strength, suggesting cross-method convergence. Moreover, 1HMRS- and GluCEST-derived measures of glutamate were positively correlated within the VOI. The strength of this correlation was dependent on the degree of anatomical overlap between the 1HMRS VOI and the GluCEST FOV, and ranged from rPARTIAL = 0.26 in all participants, to rPARTIAL = 0.36 in those with > 50% anatomical overlap, to rPARTIAL = 0.60 in those with > 90% anatomical overlap. Extended results and corresponding methods are available in the SI.
DISCUSSION
Using a clinically diverse sample and the novel 7.0T glutamate imaging method GluCEST, we found that a lower GluCEST contrast in the brain’s reward network was dimensionally related to diminished RR. This finding links individual differences in RR to differences in neurochemistry within brain regions involved in reward encoding, incentive salience, and valence evaluation. The association observed here between GluCEST and RR was specific to the reward network, and selective for RR but not other clinical features. This work therefore provides evidence of a neuroanatomically- and construct-specific relationship between reward network glutamate and RR, implicating a main excitatory neurotransmitter and neurometabolite in reward sensitivity and anhedonia.
Glutamate-modulating psychotropics have recently demonstrated efficacy for treating anhedonia [31, 32], motivating clinical interest in parsing relationships between glutamate and reward functioning. Yet, to our knowledge, this is the first study to demonstrate that an in vivo measure of glutamate quantified in cortical, subcortical, and brainstem reward regions relates to RR. A handful of previous investigations examined associations between anhedonia severity and brain glutamate using 1HMRS, yet these studies predominantly reported null results [51–54, 57, 58]. This discrepancy between past 1HMRS findings and this report is likely attributable to the following technical and conceptual advances offered by the present study: 1) in contrast to previous 1HMRS anhedonia studies, which assessed metabolites within the anterior cingulate cortex [51–54, 57] or striatum [58] only, we quantified the GluCEST contrast across a neuroanatomically expansive portion of the reward network; 2) we acquired GluCEST data at 7.0T (rather than at 3.0T [52–54, 58]), thus capitalizing on improvements in sensitivity and signal-to-noise ratio obtainable at higher field strengths [59]; and 3) we studied a transdiagnostic sample using a dimensional measure of RR—an approach distinct from past efforts focused on patients with major depression and severe clinical anhedonia [51–54, 57, 58]. Considered in conjunction with prior studies relating low RR to reduced reward network BOLD activity [10–15], these GluCEST results thus provide novel evidence that reward region glutamatergic deficits may in part drive the association between reward network hypofunction and low RR.
The circuitry of the reward network has been extensively delineated in rodents and non-human primates, and the importance of glutamatergic projections within this network has been described [17–22, 24]. Cortical reward glutamatergic efferents converge in the midbrain and striatum, two key regions for reward anticipation, detection, and responding, likely explaining the stronger association between GluCEST and RR observed in the subcortical reward network. The relationship between GluCEST and RR was additionally influenced by regional valence-related functioning, as it was stronger in brain areas that encode appetitive stimuli or the salience of valenced stimuli than in those that preferentially respond to aversive stimuli. This finding is consistent with the RDoC classification of RR within the Positive Valence Domain, as well as with theories positing that glutamatergic signaling in reward-subserving brain regions mediates stimulus and incentive salience [60, 61].
The central role that glutamatergic neurotransmission plays in reward-associated processes provides a direct mechanism—decreased excitatory neural communication—by which lower glutamate levels in reward network regions could lead to network dysfunction and diminished RR. This interpretation accords with preclinical findings that glutamate receptor pharmacological blockade decreases responding to rewards [25–28], whereas optogenetic activation of reward network glutamatergic afferents is rewarding and reinforcing [62–64]. Moreover, this interpretation is supported by the fact that the CEST acquisition employed in this study is sensitive to glutamate at the pH found within glutamate-containing synaptic vesicles (pH 5–6) and synaptic and extra-synaptic spaces (pH 7–7.5) [36, 65, 66]. Still, GluCEST’s sensitivity to glutamate at a pH of ~7 ensures it additionally measures intracellular glutamate present within both neurons and astrocytes. Glutamate located within these cellular compartments plays a vital role not only in neurotransmission, but also in neurometabolism [67]. Accordingly, both decreased excitatory signaling and altered network metabolism could contribute to the association observed between lower reward network GluCEST contrast and lower RR.
Deficits in RR frequently emerge during adolescence [68] and following periods of chronic stress [8, 69]. Notably, these are two timeframes characterized by overall reductions in glutamatergic synapses and signaling [70, 71]. Our GluCEST results thus provide a framework for understanding the link between the onset of diminished RR and neurobiological changes that occur during neurodevelopment or stress-induced neurodegeneration, i.e., during two vulnerable periods for glutamate perturbations. Given that diminished RR is furthermore a risk factor for development of mood disorders [6, 68, 72] and suicidality [73–75], we speculate that low reward network glutamate may partially mediate the association between low RR and development of these psychopathologies.
For individuals with diagnosed psychopathologies, anhedonia is a consistent predictor of poor psychotropic treatment response [1–5]. The present work suggests that some patients with anhedonia may have a glutamate-based disruption, potentially explaining why such individuals do not respond to conventional antidepressants, which target monoamines, or conventional antipsychotics, which are dopamine antagonists. Clinical trials that harness 7.0T GluCEST to assess the role of reward network glutamate level in treatment resistance would thus be highly informative. These trials could provide insight into the utility of ultra-high field neurochemical imaging for predicting treatment response, potentially paving the way to neurochemistry-informed treatment stratification in psychiatry. Currently, clinical translation of 7.0T GluCEST is limited by a lack of widely available 7.0T MRIs, the high cost of scanning, and insufficient data available for defining normative versus low ranges of the GluCEST contrast. However, increased integration of 7.0T imaging into routine clinical care and collection of GluCEST data from large healthy and patient samples would enable the use of objective, evidence-based, neurobiological CEST imaging measures in psychiatric patient care.
GluCEST has inherent limitations [36, 44], including the acquisition FOV, which limited analysis to a portion of the reward network. Regarding the GluCEST contrast, it must be noted that while at least 70% of the CEST effect is directly attributable to magnetization transfer from glutamate to water, up to 30% of the signal can come from exchangeable protons on other macromolecules (e.g. creatine), though notably none of the signal is from glutamine [36]. Unlike 1HMRS, GluCEST does not provide information about other neurochemicals (e.g. myo-inositol or N-acetylaspartate). Future studies may thus consider acquiring both GluCEST and 1HMRS data in a complementary manner. This would simultaneously capitalize on the enhanced spatial coverage and resolution provided by GluCEST and the localized measurement of multiple metabolites enabled by 1HMRS. Last, we did not exclude individuals taking psychotropic medications given our clinical study sample, though medications may impact brain neurochemicals. Adjustment for medication did not, however, alter our results: partial correlations between BAS RR scores and reward network GluCEST, subcortical reward GluCEST, and salience reward GluCEST all remained significant (ps < 0.05) when controlling for psychotropic medication use (yes/no).
In conclusion, by harnessing the ultra-high field glutamate imaging method GluCEST, we identified a significant and selective relationship between RR and the GluCEST contrast in the brain’s reward network, implicating reward network glutamatergic deficiencies in diminished reward sensitivity. Future longitudinal studies designed to parse relationships between brain glutamate, RR deficits, and progression to psychopathology are warranted. More broadly, this study demonstrates the utility of in vivo neurochemical imaging, highlighting its potential to identify druggable targets for ameliorating psychiatric symptoms that are frequently treatment-resistant.
Supplementary Material
Acknowledgements
We would like to thank the recruitment team at the Penn-CHOP Lifespan Brain Institute, led by Thomas Hohing, Karthik Prabhakaran and Jacqueline Meeks, for assistance with 7.0T MRI data collection.
Funding Sources: This work was supported by National Institute of Mental Health R01s MH119185 (DRR) and MH120174 (DRR), a National Institute of Aging R56 AG066656 (DRR), a NARSAD Young Investigator Grant from the Brain & Behavior Research Foundation (DRR), a University of Pennsylvania Research Foundation Grant (DRR), and the University of Pennsylvania Institute for Translational Medicine and Therapeutics (TDS, JY). Additional support was provided by R01 MH119219 (REG, RCG), R01 MH113565 (DHW), R01 MH107703 (TDS), R01 MH112847 (TDS, RTS), T32 MH014654-43 (BL), P41 NIBIB EB015893 (RR), and the Lifespan Brain Institute—a collaboration between the University of Pennsylvania School of Medicine and Children’s Hospital of Philadelphia. The funding sources were not directly involved in study design, data collection, data analysis, data interpretation, or manuscript writing.
Footnotes
Conflict of Interest
All authors declare no conflict of interest.
Supplementary Information
Supplementary information is available at MP’s website.
References
- 1.McMakin DL, Olino TM, Porta G, Dietz LJ, Emslie G, Clarke G, et al. Anhedonia Predicts Poorer Recovery Among Youth With Selective Serotonin Reuptake Inhibitor Treatment–Resistant Depression. J Am Acad Child Adolesc Psychiatry. 2012;51:404–411. [DOI] [PMC free article] [PubMed] [Google Scholar]
- 2.Uher R, Perlis RH, Henigsberg N, Zobel A, Rietschel M, Mors O, et al. Depression symptom dimensions as predictors of antidepressant treatment outcome: replicable evidence for interest-activity symptoms. Psychol Med. 2012;42:967–980. [DOI] [PMC free article] [PubMed] [Google Scholar]
- 3.Nutt D, Demyttenaere K, Janka Z, Aarre T, Bourin M, Canonico PL, et al. The other face of depression, reduced positive affect: the role of catecholamines in causation and cure. J Psychopharmacol Oxf Engl. 2007;21:461–471. [DOI] [PubMed] [Google Scholar]
- 4.Wolf DH. Anhedonia in schizophrenia. Curr Psychiatry Rep. 2006;8:322–328. [DOI] [PubMed] [Google Scholar]
- 5.Vrieze E, Demyttenaere K, Bruffaerts R, Hermans D, Pizzagalli DA, Sienaert P, et al. Dimensions in major depressive disorder and their relevance for treatment outcome. J Affect Disord. 2014;155:35–41. [DOI] [PMC free article] [PubMed] [Google Scholar]
- 6.Winer ES, Bryant J, Bartoszek G, Rojas E, Nadorff MR, Kilgore J. Mapping the relationship between anxiety, anhedonia, and depression. J Affect Disord. 2017;221:289–296. [DOI] [PMC free article] [PubMed] [Google Scholar]
- 7.Cressman VL, Schobel SA, Steinfeld S, Ben-David S, Thompson JL, Small SA, et al. Anhedonia in the psychosis risk syndrome: associations with social impairment and basal orbitofrontal cortical activity. NPJ Schizophr. 2015;1:15020. [DOI] [PMC free article] [PubMed] [Google Scholar]
- 8.Pizzagalli DA. Depression, Stress, and Anhedonia: Toward a Synthesis and Integrated Model. Annu Rev Clin Psychol. 2014;10:393–423. [DOI] [PMC free article] [PubMed] [Google Scholar]
- 9.Taubitz LE, Pedersen WS, Larson CL. BAS Reward Responsiveness: A unique predictor of positive psychological functioning. Personal Individ Differ. 2015;80:107–112. [DOI] [PMC free article] [PubMed] [Google Scholar]
- 10.Keller J, Young CB, Kelley E, Prater K, Levitin DJ, Menon V. Trait anhedonia is associated with reduced reactivity and connectivity of mesolimbic and paralimbic reward pathways. J Psychiatr Res. 2013;47:1319–1328. [DOI] [PubMed] [Google Scholar]
- 11.Wacker J, Dillon DG, Pizzagalli DA. The role of the nucleus accumbens and rostral anterior cingulate cortex in anhedonia: Integration of resting EEG, fMRI, and volumetric techniques. NeuroImage. 2009;46:327–337. [DOI] [PMC free article] [PubMed] [Google Scholar]
- 12.Simon JJ, Walther S, Fiebach CJ, Friederich H-C, Stippich C, Weisbrod M, et al. Neural reward processing is modulated by approach- and avoidance-related personality traits. NeuroImage. 2010;49:1868–1874. [DOI] [PubMed] [Google Scholar]
- 13.Harvey P-O, Armony J, Malla A, Lepage M. Functional neural substrates of self-reported physical anhedonia in non-clinical individuals and in patients with schizophrenia. J Psychiatr Res. 2010;44:707–716. [DOI] [PubMed] [Google Scholar]
- 14.Stepien M, Manoliu A, Kubli R, Schneider K, Tobler PN, Seifritz E, et al. Investigating the association of ventral and dorsal striatal dysfunction during reward anticipation with negative symptoms in patients with schizophrenia and healthy individuals. PLOS ONE. 2018;13:e0198215. [DOI] [PMC free article] [PubMed] [Google Scholar]
- 15.Smoski MJ, Felder J, Bizzell J, Green SR, Ernst M, Lynch TR, et al. fMRI of alterations in reward selection, anticipation, and feedback in major depressive disorder. J Affect Disord. 2009;118:69–78. [DOI] [PMC free article] [PubMed] [Google Scholar]
- 16.Sharma A, Wolf DH, Ciric R, Kable JW, Moore TM, Vandekar SN, et al. Common Dimensional Reward Deficits Across Mood and Psychotic Disorders: A Connectome-Wide Association Study. Am J Psychiatry. 2017;174:657–666. [DOI] [PMC free article] [PubMed] [Google Scholar]
- 17.Haber SN, Knutson B. The Reward Circuit: Linking Primate Anatomy and Human Imaging. Neuropsychopharmacology. 2010;35:4–26. [DOI] [PMC free article] [PubMed] [Google Scholar]
- 18.Haber SN. Corticostriatal circuitry. Dialogues Clin Neurosci. 2016;18:7–21. [DOI] [PMC free article] [PubMed] [Google Scholar]
- 19.Sesack SR, Carr DB, Omelchenko N, Pinto A. Anatomical substrates for glutamate-dopamine interactions: evidence for specificity of connections and extrasynaptic actions. Ann N Y Acad Sci. 2003;1003:36–52. [DOI] [PubMed] [Google Scholar]
- 20.Sesack SR, Grace AA. Cortico-Basal Ganglia Reward Network: Microcircuitry. Neuropsychopharmacology. 2010;35:27–47. [DOI] [PMC free article] [PubMed] [Google Scholar]
- 21.Höflich A, Michenthaler P, Kasper S, Lanzenberger R. Circuit Mechanisms of Reward, Anhedonia, and Depression. Int J Neuropsychopharmacol. 2018;22:105–118. [DOI] [PMC free article] [PubMed] [Google Scholar]
- 22.Geisler S, Wise RA. Functional implications of glutamatergic projections to the ventral tegmental area. Rev Neurosci. 2008;19:227–244. [DOI] [PMC free article] [PubMed] [Google Scholar]
- 23.Stuber GD, Britt JP, Bonci A. Optogenetic modulation of neural circuits that underlie reward seeking. Biol Psychiatry. 2012;71:1061–1067. [DOI] [PMC free article] [PubMed] [Google Scholar]
- 24.Cox J, Witten IB. Striatal circuits for reward learning and decision-making. Nat Rev Neurosci. 2019;20:482–494. [DOI] [PMC free article] [PubMed] [Google Scholar]
- 25.D’Souza MS. Glutamatergic transmission in drug reward: implications for drug addiction. Front Neurosci. 2015;9:404. [DOI] [PMC free article] [PubMed] [Google Scholar]
- 26.Bisaga A, Danysz W, Foltin RW. Antagonism of glutamatergic NMDA and mGluR5 receptors decreases consumption of food in baboon model of binge-eating disorder. Eur Neuropsychopharmacol. 2008;18:794–802. [DOI] [PMC free article] [PubMed] [Google Scholar]
- 27.You Z-B, Wang B, Zitzman D, Azari S, Wise RA. A role for conditioned ventral tegmental glutamate release in cocaine seeking. J Neurosci Off J Soc Neurosci. 2007;27:10546–10555. [DOI] [PMC free article] [PubMed] [Google Scholar]
- 28.Lee B, Platt DM, Rowlett JK, Adewale AS, Spealman RD. Attenuation of Behavioral Effects of Cocaine by the Metabotropic Glutamate Receptor 5 Antagonist 2-Methyl-6-(phenylethynyl)-pyridine in Squirrel Monkeys: Comparison with Dizocilpine. J Pharmacol Exp Ther. 2005;312:1232–1240. [DOI] [PubMed] [Google Scholar]
- 29.Koike H, Iijima M, Chaki S. Involvement of AMPA receptor in both the rapid and sustained antidepressant-like effects of ketamine in animal models of depression. Behav Brain Res. 2011;224:107–111. [DOI] [PubMed] [Google Scholar]
- 30.Duman Ronald S., Sanacora G Krystal JH. Altered Connectivity in Depression: GABA and Glutamate Neurotransmitter Deficits and Reversal by Novel Treatments. Neuron. 2019;102:75–90. [DOI] [PMC free article] [PubMed] [Google Scholar]
- 31.Lally N, Nugent AC, Luckenbaugh DA, Niciu MJ, Roiser JP, Zarate CA. Neural correlates of change in major depressive disorder anhedonia following open-label ketamine. J Psychopharmacol Oxf Engl. 2015;29:596–607. [DOI] [PMC free article] [PubMed] [Google Scholar]
- 32.Ballard ED, Wills K, Lally N, Richards EM, Luckenbaugh DA, Walls T, et al. Anhedonia as a clinical correlate of suicidal thoughts in clinical ketamine trials. J Affect Disord. 2017;218:195–200. [DOI] [PMC free article] [PubMed] [Google Scholar]
- 33.Proton Henning A. and multinuclear magnetic resonance spectroscopy in the human brain at ultra-high field strength: A review. NeuroImage. 2018;168:181–198. [DOI] [PubMed] [Google Scholar]
- 34.Wu B, Warnock G, Zaiss M, Lin C, Chen M, Zhou Z, et al. An overview of CEST MRI for non-MR physicists. EJNMMI Phys. 2016;3:19. [DOI] [PMC free article] [PubMed] [Google Scholar]
- 35.Hu J, Yang S, Xuan Y, Jiang Q, Yang Y, Haacke EM. Simultaneous Detection of Resolved Glutamate, Glutamine, and γ-Aminobutyric Acid at 4 Tesla. J Magn Reson. 2007;185:204–213. [DOI] [PMC free article] [PubMed] [Google Scholar]
- 36.Cai K, Haris M, Singh A, Kogan F, Greenberg JH, Hariharan H, et al. Magnetic resonance imaging of glutamate. Nat Med. 2012;18:302–306. [DOI] [PMC free article] [PubMed] [Google Scholar]
- 37.Nanga RPR, DeBrosse C, Kumar D, Roalf D, McGeehan B, D’Aquilla K, et al. Reproducibility of 2D GluCEST in healthy human volunteers at 7 T. Magn Reson Med. 2018;80:2033–2039. [DOI] [PMC free article] [PubMed] [Google Scholar]
- 38.Carver CS, White TL. Behavioral inhibition, behavioral activation, and affective responses to impending reward and punishment: The BIS/BAS Scales. J Pers Soc Psychol. 1994;67:319–333. [Google Scholar]
- 39.Jorm AF, Christensen H, Henderson AS, Jacomb PA, Korten AE, Rodgers B. Using the BIS/BAS scales to measure behavioural inhibition and behavioural activation: Factor structure, validity and norms in a large community sample. Personal Individ Differ. 1998;26:49–58. [Google Scholar]
- 40.Campbell-Sills L, Liverant GI, Brown TA. Psychometric evaluation of the behavioral inhibition/behavioral activation scales in a large sample of outpatients with anxiety and mood disorders. Psychol Assess. 2004;16:244–254. [DOI] [PubMed] [Google Scholar]
- 41.Kasch KL, Rottenberg J, Arnow BA, Gotlib IH. Behavioral activation and inhibition systems and the severity and course of depression. J Abnorm Psychol. 2002;111:589–597. [DOI] [PubMed] [Google Scholar]
- 42.Kobayashi H, Nemoto T, Koshikawa H, Osono Y, Yamazawa R, Murakami M, et al. A self-reported instrument for prodromal symptoms of psychosis: testing the clinical validity of the PRIME Screen-Revised (PS-R) in a Japanese population. Schizophr Res. 2008;106:356–362. [DOI] [PubMed] [Google Scholar]
- 43.Miller T, Cicchetti D, Markovich P, McGlashan T, Woods S. The SIPS screen: a brief self-report screen to detect the schizophrenia prodrome. Schizophr Res. 2004;70(Suppl 1):78.(abstract 31). [Google Scholar]
- 44.Roalf DR, Nanga RPR, Rupert PE, Hariharan H, Quarmley M, Calkins ME, et al. Glutamate imaging (GluCEST) reveals lower brain GluCEST contrast in patients on the psychosis spectrum. Mol Psychiatry. 2017;22:1298–1305. [DOI] [PMC free article] [PubMed] [Google Scholar]
- 45.Marques JP, Kober T, Krueger G, van der Zwaag W, Van de Moortele P-F, Gruetter R. MP2RAGE, a self bias-field corrected sequence for improved segmentation and T1-mapping at high field. NeuroImage. 2010;49:1271–1281. [DOI] [PubMed] [Google Scholar]
- 46.Tustison NJ, Avants BB, Cook PA, Zheng Y, Egan A, Yushkevich PA, et al. N4ITK: Improved N3 Bias Correction. IEEE Trans Med Imaging. 2010;29:1310–1320. [DOI] [PMC free article] [PubMed] [Google Scholar]
- 47.Zhang Y, Brady M, Smith S. Segmentation of brain MR images through a hidden Markov random field model and the expectation-maximization algorithm. IEEE Trans Med Imaging. 2001;20:45–57. [DOI] [PubMed] [Google Scholar]
- 48.Avants BB, Epstein CL, Grossman M, Gee JC. Symmetric diffeomorphic image registration with cross-correlation: evaluating automated labeling of elderly and neurodegenerative brain. Med Image Anal. 2008;12:26–41. [DOI] [PMC free article] [PubMed] [Google Scholar]
- 49.Bartra O, McGuire JT, Kable JW. The valuation system: a coordinate-based meta-analysis of BOLD fMRI experiments examining neural correlates of subjective value. NeuroImage. 2013;76:412–427. [DOI] [PMC free article] [PubMed] [Google Scholar]
- 50.Desikan RS, Ségonne F, Fischl B, Quinn BT, Dickerson BC, Blacker D, et al. An automated labeling system for subdividing the human cerebral cortex on MRI scans into gyral based regions of interest. NeuroImage. 2006;31:968–980. [DOI] [PubMed] [Google Scholar]
- 51.Colic L, von Düring F, Denzel D, Demenescu LR, Lord AR, Martens L, et al. Rostral Anterior Cingulate Glutamine/Glutamate Disbalance in Major Depressive Disorder Depends on Symptom Severity. Biol Psychiatry Cogn Neurosci Neuroimaging. 2019;4:1049–1058. [DOI] [PubMed] [Google Scholar]
- 52.Walter M, Henning A, Grimm S, Schulte RF, Beck J, Dydak U, et al. The relationship between aberrant neuronal activation in the pregenual anterior cingulate, altered glutamatergic metabolism, and anhedonia in major depression. Arch Gen Psychiatry. 2009;66:478–486. [DOI] [PubMed] [Google Scholar]
- 53.Gabbay V, Mao X, Klein RG, Ely BA, Babb JS, Panzer AM, et al. Anterior Cingulate Cortex γ-Aminobutyric Acid in Depressed Adolescents. Arch Gen Psychiatry. 2012;69:139–149. [DOI] [PMC free article] [PubMed] [Google Scholar]
- 54.Gabbay V, Bradley KA, Mao X, Ostrover R, Kang G, Shungu DC. Anterior cingulate cortex γ-aminobutyric acid deficits in youth with depression. Transl Psychiatry. 2017;7:e1216. [DOI] [PMC free article] [PubMed] [Google Scholar]
- 55.Sydnor VJ, Roalf DR. A meta-analysis of ultra-high field glutamate, glutamine, GABA and glutathione 1HMRS in psychosis: Implications for studies of psychosis risk. Schizophr Res. 2020; doi: 10.1016/j.schres.2020.06.028. [DOI] [PMC free article] [PubMed] [Google Scholar]
- 56.Moriguchi S, Takamiya A, Noda Y, Horita N, Wada M, Tsugawa S, et al. Glutamatergic neurometabolite levels in major depressive disorder: a systematic review and meta-analysis of proton magnetic resonance spectroscopy studies. Mol Psychiatry. 2019:24:952–964. [DOI] [PMC free article] [PubMed] [Google Scholar]
- 57.Godlewska BR, Masaki C, Sharpley AL, Cowen PJ, Emir UE. Brain glutamate in medication-free depressed patients: a proton MRS study at 7 Tesla. Psychol Med. 2018;48:1731–1737. [DOI] [PMC free article] [PubMed] [Google Scholar]
- 58.Bradley KA, Alonso CM, Mehra LM, Xu J, Gabbay V. Elevated striatal γ-aminobutyric acid in youth with major depressive disorder. Prog Neuropsychopharmacol Biol Psychiatry. 2018;86:203–210. [DOI] [PMC free article] [PubMed] [Google Scholar]
- 59.Moser E, Stahlberg F, Ladd ME, Trattnig S. 7-T MR--from research to clinical applications? NMR Biomed. 2012;25:695–716. [DOI] [PubMed] [Google Scholar]
- 60.Batten SR, Pomerleau F, Quintero J, Gerhardt GA, Beckmann JS. The role of glutamate signaling in incentive salience: second-by-second glutamate recordings in awake Sprague-Dawley rats. J Neurochem. 2018;145:276–286. [DOI] [PMC free article] [PubMed] [Google Scholar]
- 61.Berridge KC. From prediction error to incentive salience: mesolimbic computation of reward motivation. Eur J Neurosci. 2012;35:1124–1143. [DOI] [PMC free article] [PubMed] [Google Scholar]
- 62.Britt JP, Benaliouad F, McDevitt RA, Stuber GD, Wise RA, Bonci A. Synaptic and Behavioral Profile of Multiple Glutamatergic Inputs to the Nucleus Accumbens. Neuron. 2012;76:790–803. [DOI] [PMC free article] [PubMed] [Google Scholar]
- 63.Qi J, Zhang S, Wang H-L, Wang H, de Jesus Aceves Buendia J, Hoffman AF, et al. A glutamatergic reward input from the dorsal raphe to ventral tegmental area dopamine neurons. Nat Commun. 2014;5:5390. [DOI] [PMC free article] [PubMed] [Google Scholar]
- 64.Yoo JH, Zell V, Wu J, Punta C, Ramajayam N, Shen X, et al. Activation of Pedunculopontine Glutamate Neurons Is Reinforcing. J Neurosci. 2017;37:38–46. [DOI] [PMC free article] [PubMed] [Google Scholar]
- 65.Atluri PP, Ryan TA. The Kinetics of Synaptic Vesicle Reacidification at Hippocampal Nerve Terminals. J Neurosci. 2006;26:2313–2320. [DOI] [PMC free article] [PubMed] [Google Scholar]
- 66.Egashira Y, Takase M, Watanabe S, Ishida J, Fukamizu A, Kaneko R, et al. Unique pH dynamics in GABAergic synaptic vesicles illuminates the mechanism and kinetics of GABA loading. Proc Natl Acad Sci. 2016;113:10702–10707. [DOI] [PMC free article] [PubMed] [Google Scholar]
- 67.McKenna MC. The glutamate-glutamine cycle is not stoichiometric: Fates of glutamate in brain. J Neurosci Res. 2007;85:3347–3358. [DOI] [PubMed] [Google Scholar]
- 68.Bennik EC, Nederhof E, Ormel J, Oldehinkel AJ. Anhedonia and depressed mood in adolescence: course, stability, and reciprocal relation in the TRAILS study. Eur Child Adolesc Psychiatry. 2014;23:579–586. [DOI] [PubMed] [Google Scholar]
- 69.Stanton CH, Holmes AJ, Chang SWC, Joormann J. From Stress to Anhedonia: Molecular Processes through Functional Circuits. Trends Neurosci. 2019;42:23–42. [DOI] [PMC free article] [PubMed] [Google Scholar]
- 70.Duman RS. Pathophysiology of depression and innovative treatments: remodeling glutamatergic synaptic connections. Dialogues Clin Neurosci. 2014;16:11–27. [DOI] [PMC free article] [PubMed] [Google Scholar]
- 71.Shimizu M, Suzuki Y, Yamada K, Ueki S, Watanabe M, Igarashi H, et al. Maturational decrease of glutamate in the human cerebral cortex from childhood to young adulthood: a 1H-MR spectroscopy study. Pediatr Res. 2017;82:749–752. [DOI] [PubMed] [Google Scholar]
- 72.Stringaris A, Vidal-Ribas Belil P, Artiges E, Lemaitre H, Gollier-Briant F, Wolke S, et al. The Brain’s Response to Reward Anticipation and Depression in Adolescence: Dimensionality, Specificity, and Longitudinal Predictions in a Community-Based Sample. Am J Psychiatry. 2015;172:1215–1223. [DOI] [PMC free article] [PubMed] [Google Scholar]
- 73.Winer ES, Drapeau CW, Veilleux JC, Nadorff MR. The Association between Anhedonia, Suicidal Ideation, and Suicide Attempts in a Large Student Sample. Arch Suicide Res. 2016;20:265–272. [DOI] [PubMed] [Google Scholar]
- 74.Hawes M, Galynker I, Barzilay S, Yaseen ZS. Anhedonia and suicidal thoughts and behaviors in psychiatric outpatients: The role of acuity. Depress Anxiety. 2018;35:1218–1227. [DOI] [PubMed] [Google Scholar]
- 75.Winer ES, Nadorff MR, Ellis TE, Allen JG, Herrera S, Salem T. Anhedonia predicts suicidal ideation in a large psychiatric inpatient sample. Psychiatry Res. 2014;218:124–128. [DOI] [PubMed] [Google Scholar]
Associated Data
This section collects any data citations, data availability statements, or supplementary materials included in this article.