

Abstract
The role of myeloid-derived suppressor cells (MDSC) in infant immune ontogeny is unknown. Here, we evaluated MDSC frequency and relationship with infant vaccine responses throughout the first year of life in a prospective cohort study. Ninety-one South African infant-mother pairs were enrolled at delivery, and blood samples were collected at 0, 6, 10, and 14 weeks, 6 months, 9 months, and one year. MDSC frequencies were quantified, and immune responses to the childhood vaccines Bacillus Calmette-Guérin (BCG), hepatitis B (HepB), and combination diphtheria, tetanus, and pertussis (dTaP) were measured by antigen-specific CD4+ T cell proliferation and IFN-γ production. Vaccine-specific antibody responses to HepB, dTaP and Haemophilus influenzae type b (Hib) were quantified via ELISA. MDSC frequency in mothers-infant pairs was strongly correlated; the frequency of MDSC decreased in both mothers and infants during the months after delivery/birth; and by one year, infant MDSC frequencies rebounded to birth levels. Higher MDSC frequency at vaccination was associated with a lack of subsequent IFN-γ release in response to vaccine antigens, with the exception of BCG. In this study, MDSC had no effect on T cell proliferation or antibody responses, except for the Hepatitis B vaccine where higher MDSC at 6 weeks (time of initial vaccination) correlated weakly with higher antibody titers. The potential for MDSC-mediated suppression of vaccine antigen-specific IFN-γ responses should be explored further, and considered when evaluating candidate infant vaccines.
Keywords: MDSC, Cellular immunity, Vaccines, Infant immunity
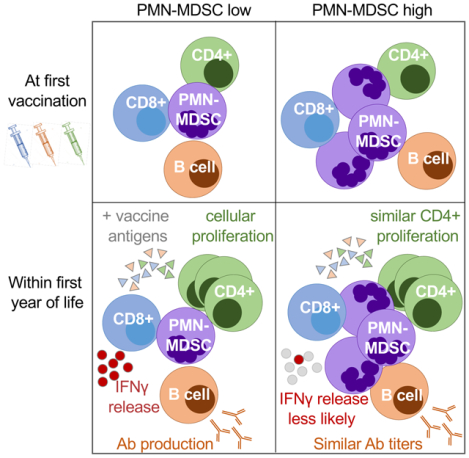
Graphical Abstract
Summary Sentence:
A longitudinal analysis of infant MDSC frequency and association with vaccine antigen recall responses.
INTRODUCTION
Despite substantial worldwide progress toward reducing childhood mortality, an estimated 5.3 million children under age five died in 2018; 75% of these deaths occurred within the first year of life and largely from preventable causes, including infection1. Routine immunization provides critical protection against many of the most common childhood infections. However, drastic changes in the immune system during the first year of life present a challenge to the development of broad and potent protective immunity in infants via vaccination. After birth, the immune system must develop from a tolerogenic, fetal state to one that is capable of generating effective innate and adaptive responses to pathogens and/or vaccine antigens that result in lasting protective immunity. Therefore, a better understanding of infant immune ontogeny, particularly the role of regulatory and suppressor cell populations during the transition from fetal-tolerant to active immune status, is critical to develop effective infant vaccines and vaccination strategies.
Myeloid-derived suppressor cells (MDSC) are a heterogeneous population of cells composed of myeloid progenitors with a potent capacity for suppressing T cell responses (reviewed in [2]). MDSC are commonly classified into two distinct subsets: monocytic (M-MDSC) or polymorphonuclear (PMN-MDSC; formerly referred to as granulocytic MDSC or G-MDSC). We and others have previously shown that MDSC, particularly PMN-MDSC, are present in higher frequencies in cord blood compared to the circulation of healthy adults3,4. Further, these neonatal MDSC are capable of suppressing CD4+ and CD8+ T cell proliferation and IFN-γ production to polyclonal stimulation in-vitro. Importantly, there is substantial variation in the frequency of MDSC between individual neonates3,4. Thus, it is possible that differential persistence of MDSC postnatally may impact infants’ ability to mount antigen-specific responses; however, this has not yet been explored. Here we performed a longitudinal assessment of infant MDSC through the first year of life in a cohort of South African infants at high risk of infectious disease, with the overall goal of understanding 1.) the kinetics of MDSC frequency throughout the first year of life and 2.) whether MDSC alter adaptive responses to routine childhood vaccinations. We hypothesized that an inverse correlation would exist between infant MDSC frequency at the time of vaccination and subsequent cellular and humoral responses to vaccine antigens.
METHODS
Cohort and Sample Collection.
This prospective cohort study of 91 infant-mother pairs was performed at a primary care Midwife Obstetric Unit in Khayelitsha, Western Cape Province, South Africa between March 2013 and January 2017. For study inclusion, mothers had to be ≥18 years with known HIV-1 infection status. Only infants delivered at a gestational age >36 weeks without complications during pregnancy or labor were eligible and infant birth weight must have been >2.4 kgs. All HIV-exposed infants were tested for HIV-1 via DNA PCR at 6 weeks of age and were HIV-negative.
Throughout the study, infants received all routine vaccines according to the South African Expanded Program on Immunization schedule. Relevant to this study, the Bacillus Calmette-Guérin (BCG; Danish strain 1331) vaccine was administered at birth, while the Hepatitis B, Haemophilius Influenza B (HiB), and DTaP (Diphtheria, Tetanus, acellular Pertussis) vaccines were administered initially at 6 weeks of age with boosters at 10 and 14 weeks (Supplemental Fig. 1).
Infant blood was collected at birth, 6, 10, and 14 weeks, at 6 and 9 months, and one year of age (Supplemental Figure 1). Maternal blood was collected at delivery and again at one year postpartum. All blood samples were collected into heparinized tubes and transported to the laboratory within a maximum of 6 hours for processing.
Flow Cytometry.
Plasma was isolated from whole blood samples and stored at −80°C. Plasma volume was replaced by PBS prior to ficoll density gradient centrifugation to isolate peripheral blood mononuclear cells (PBMC) from the remaining blood. In PBMC samples with obvious red blood cell (RBC) contamination, RBC were depleted using glycophorin A micro beads (StemCell Technologies). Because PMN-MDSC do not survive cryopreservation5, staining for MDSC and T cell assays were performed on fresh samples using the gating strategies shown in Supplemental Figure 2.
MDSC characterization and frequency:
One million PBMC were added to a well of a 96-well round-bottom plate and incubated with an amine reactive viability marker VIVID Pacific Blue (Life technologies) for 20 minutes at room temperature (RT), washed twice with 2% FCS-PBS, then stained with the following extracellular markers for 20 minutes at RT(all antibodies were obtained from BD Biosciences unless otherwise noted): anti-CD15 APC (clone H198; Biolegend); anti-HLA-DR APC-Cy7 (clone L234), anti-CD11b PE-Cy7 (clone ICRF44), anti-CD33-PE-Cy5 (clone WM53) and anti-CD14 PE (clone M5E2). Cells were washed twice prior to fixation with Cell Fix (BD). All antibodies were previously titrated on infant cells and gates were set based on fluorescence minus one (FMO) controls.
PBMC stimulation and carboxyfluorescein succinimidyl ester (CFSE) incorporation:
Freshly isolated PBMC were stained with 0.25uL of Cell Trace™ CFSE (Life Technologies, USA) per 1×10⁷ cells in 1mL PBS for 8 minutes and quenched with 2mL FBS. After staining, PBMC were plated at 1×10⁶ cells/mL in a 48-well plate for stimulation with vaccine antigens in RPMI culture medium containing 1% penicillin-streptomycin, 15% Human Serum, 50pg/mL recombinant human IL-7 (rhIL-7), and optimized concentrations of the following antigens: 1ug/mL Tuberculin purified protein derivative (PPD; Statens Serum Institut, DK-2300, Copenhagen, Denmark), 0.25ug/mL Tetanus toxoid (TT) [TETAVAX, Aventis Pharma (Pty) Ltd], or 5ug/mL Hepatitis B surface antigen (HBSAg) [Advanced Immunochemical Inc.]. Cells without any antigen served as a negative control, and 5uL/well Dynabeads®, a human T cell activator through CD3/CD28, served as positive control [Life Technologies]. In the wells with TT and HepB antigens, 0.5ug/mL CD28/CD49d (BD Fastimmune™) co-stimulations were additionally added, as these antigens alone did not generate a measurable response. Stimulations were incubated for 5 days. Daily, 50pg/mL IL-7 was added per well for the rest of the incubation period to enhance the growth and survival of cells6,7. At the end of the incubation, cells were transferred to a 96-well round-bottom plate for staining. Live cells were identified by staining with the amine reactive VIVID Pacific Blue viability marker (Life Technologies) for 20 minutes at RT. Following two washes and permeabilization with 10% BD FACS™ Permeabilizing Solution 2 (BD Biosciences), cells were stained intracellularly with anti-CD3 APC-Cy7 (clone SK7) and anti-CD4 APC (clone L200), both from BD Biosciences.
For all flow cytometric analyses, fluorescence was measured using an LSRII (BD Biosciences). All compensation and analysis was performed using FlowJo (Tree Star, Inc.). Fluorescence minus one (FMO) controls were used to distinguish positive and negative cell populations.
IFN-gamma ELISpot analysis.
Effector PBMC were plated at 200,000 cells per well in a 96–well hydrophobic polyvinylidene difluoride membrane-bottomed plate (Millipore) coated overnight with 10 μg/mL mouse anti–human IFN-γ monoclonal antibody (1-D1K; Mabtech). The following stimulation conditions were added to one well of the plate: 1 × 10⁴ CFU Mycobacterium bovis bacillus Calmette-Guérin (BCG; Danish stain 1331; SSI); 5μg/mL Hepatitis B (HBsAg) recombinant antigen Immunochemical Inc.); 5μg/mL Bordetella pertussis cell lysate (Difco); 2uL/well of Purified Tetanus Toxoid 40IU/dose (TETAVAX, Aventis Pharma); or 40ug/mL PHA-P (Murex Remel). CD28/CD49d (0.5ug/mL; BD Fastimmune™) co-stimulation was added to wells containing TT and HepB antigens, while IL-12 (10ng/mL) and IL-7 (1ng/mL, R&D Systems) were added to all wells. Plates were incubated overnight (16–20h) at 37°C in 5% CO2.
Following incubation, plates were washed with PBS containing 0.05% Tween-20 (PBT), and incubated at room temperature (RT) for 2 hours with 1 μg/mL of secondary biotinylated mouse anti–human IFN-γ MAb at (7-B6–1, mouse IgG1; Mabtech). Avidin biotinylated enzyme complex (AEC; Vectastain ABC Elite Kit, PK-6100; Vector Laboratories) was added at RT for 2h, followed by AEC peroxidase substrate (Vectastain). After developing plates for ~7 min, the reaction was stopped by washing with water, and plates were air-dried. Colored spot-forming cells (SFCs) were counted using an automated ELISPOT reader (Immunospot; Cellular Technology). The number of spot forming cells (SFC) was calculated by subtracting the mean number of spots in the negative control wells from the mean number of spots for each stimulation condition. An IFN-γ result was considered positive when the background-subtracted number of SFC was twice the background (negative control).
Antigen-specific Enzyme-Linked Immunosorbent Assays (ELISA).
The antibody response to vaccination was measured using stored infant plasma samples from week 14, and month 6. Specific IgG against HBsAg (Alpha Diagnostic International), TT (ESR108G, Serion), B. pertussis (ESR120G Serion Immundiagnostica), and Hib capsular polysaccharide were measured (VaccZyme) via ELISA. All reagents, including controls, were supplied with the commercial kits and manufacturer’s instructions were followed.
Statistics.
The primary study outcomes included 1.) MDSC frequencies longitudinally over time in the infants and mothers; 2.) MDSC frequency in infants exposed to HIV versus -unexposed infants; and 3.) the association of infant MDSC frequency with the magnitude of vaccine antigen-specific T cell proliferation, IFN-γ production, and antibody production. Our primary analysis included a correlation of MDSC frequency at the time of first vaccination versus the magnitude of immune response after stimulation with vaccine specific antigens, which was measured by CD4+ T cell proliferation (CFSE incorporation), IFN-γ production (ELISPOT), or serum antibody titers (ELISA). However, some infants never responded above the predetermined threshold for an assay. Thus, we performed an additional secondary analysis in which infants were binarized into “responders,” who at one or more time points mounted a measurable immune response vs. “non-responders.” The definition of “responder” vs “non-responder” was determined as follows for each assay: For the CFSE incorporation analysis, the limit of detection was defined as 3 times the median absolute deviation of the negative control well (cells alone), which was 2.5% CFSE-lo CD4+ T cells. For ELISPOT analysis, the limit of detection was defined as 10 spot-forming units (SFU) per well at any time point tested after initial vaccination (6 weeks for HepB, Bordetella pertussis, and TT) for all antigens except BCG. All infants mounted robust IFN-γ production in response to BCG stimulation; thus, those infants were binarized into “high” and “low” responders around 695 SFU (the cohort median peak response after the birth time point). For humoral responses, infants were retrospectively classified as a “low” or “high” responder based on the median peak cohort response.
Statistical analyses were performed using custom script in R and is available upon request. A sample size of 91 infants allowed an 80% power (2-sided, alpha = 0.05) to detect an inverse correlation of at least 0.3 between MDSC frequencies at the time a vaccine was administered and the magnitude of the immune responses to that vaccine, such as antigen-specific T cell proliferation or IFN-γ production. These estimates were conservative, however, as they assumed comparisons at only a single time point. Additional power was obtained using longitudinal data from all infants. Wilcoxon rank sum tests, were used to compare infant and maternal MDSC frequencies between time points, as well as the frequency of responders/non-responders or high/low responders for a given vaccine antigen. The strength of the correlation was determined via Pearson’s correlation for all continuous variable analyses, including MDSC frequency comparisons as well as those correlating the frequency of MDSC at the time of initial vaccination with the subsequent peak magnitude of immune response at any of the later time points.
Study Approval.
This study was approved by the University of Cape Town (HREC # 165/2012) and the Western IRB (study 1131007) Research Ethics Committees. Written, informed consent was obtained from all mothers with proxy consent for their infants before study participation.
RESULTS
Study Participant Characteristics.
The median gestational age of the neonates in the cohort was 39.1 weeks with a median birthweight of 3.2 kilograms (Table 1). Slightly over half of the enrolled infants were male. Ninety-five percent of these infants were exclusively breastfed and 36% of the infants were born to HIV-infected mothers. None of the infants tested positive for HIV. While an initial study objective was to determine differences in infant MDSC frequency and vaccine response by HIV exposure status, we found no significant difference in MDSC frequency between infants exposed to HIV (HEU) and their HIV-unexposed counterparts (HU) at any time point (Supplemental Figure 3A). Similarly, we found no difference in MDSC frequency between HIV+ and HIV-negative mothers in this study at delivery or one year postpartum, suggesting that pregnancy either drives MDSC expansion to comparable levels as seen during HIV infection or that pregnancy may modify the known expansion of MDSC associated with HIV (Supplemental Figure 3B). Therefore, data from HEU and HU infants were combined for further analyses. At the 6 week visit, 61 mother-infant pairs (67%) were retained in the study, 75% of which were retained by the end of the study at one year. There were no infant deaths during the study, and all maternal or clinic-card reported morbidities are described in Supplemental Table 1.
Table 1.
Cohort characteristics throughout the timeline of the study.
| Birth (N=91) | 6 weeks (N=61) | 10 weeks (N=61) | 14 weeks (N=57) | 6 months (N=53) | 9 months (N=45) | 1 year (N=46) | |
|---|---|---|---|---|---|---|---|
| Sex, Male, N (%) | 51 (56%) | 34 (56%) | 32 (52%) | 30 (53%) | 27 (51%) | 25 (56%) | 26 (57%) |
| Median weight, kg (IQR) | 3.2 (3.0–3.5) | 4.4 (4.2–4.9) | 5.4 (4.9–5.9) | 6.1 (5.7–6.7) | 7.6 (6.9–8.4) | 8.7 (8.0–9.8) | 9.8 (8.7–10.4) |
| Exclusively Breastfed, N (%) | 86 (95%) | 53 (87%) | 51 (84%) | 45 (79%) | 26 (49%) | 14 (31%) | 12 (26%) |
| Median gestational age, weeks (IQR) | 39.1 (38–40) | -- | -- | -- | -- | -- | -- |
| HIV exposure, N (%) | 33 (36%) | 24 (39%) | 23 (38%) | 22 (39%) | 21 (40%) | 18 (40%) | 18 (39%) |
Longitudinal Infant MDSC Frequency.
We have previously shown that the frequency of M-MDSC were less than 1% of live cells in healthy infants3; they were therefore not assessed in this study. Here, we defined MDSC as PMN-MDSC, or HLA-DR−CD14− CD11b+CD33+CD15+ cells isolated from the low bouyant density (PBMC) fraction of a whole blood Ficoll gradient (Supplemental Figure 2) as previously described3. All MDSC frequencies are reported as the proportion of live cells.
In accordance with our hypothesis, infant median MDSC frequency was highest at birth, and comprised 0.6% of the live cell population. Median MDSC frequency declined over time for the first few months of life (0.53% at 6 weeks, 0.36% at 10 weeks, and 0.2% at 14 weeks). However, at 6 months (26 weeks) of age, the median frequency increased to similar levels that were observed at birth (median 0.65%; Figure 1A). Between birth and one year (the last time point measured) there were marked differences in the change in infant MDSC frequencies, with some displaying a decreased MDSC frequency and others displaying an increase. However, overall the MDSC frequency remained similar between birth and one year of life (0.6% for both time points; Figure 1B). Infant MDSC frequency was correlated between birth and 6 weeks (r=0.39; p=0.005; Figure 1C); this correlation was not observed between birth and any other time point, including 1 year (r=0.18; p=0.3; Figure 1D).
Figure 1.
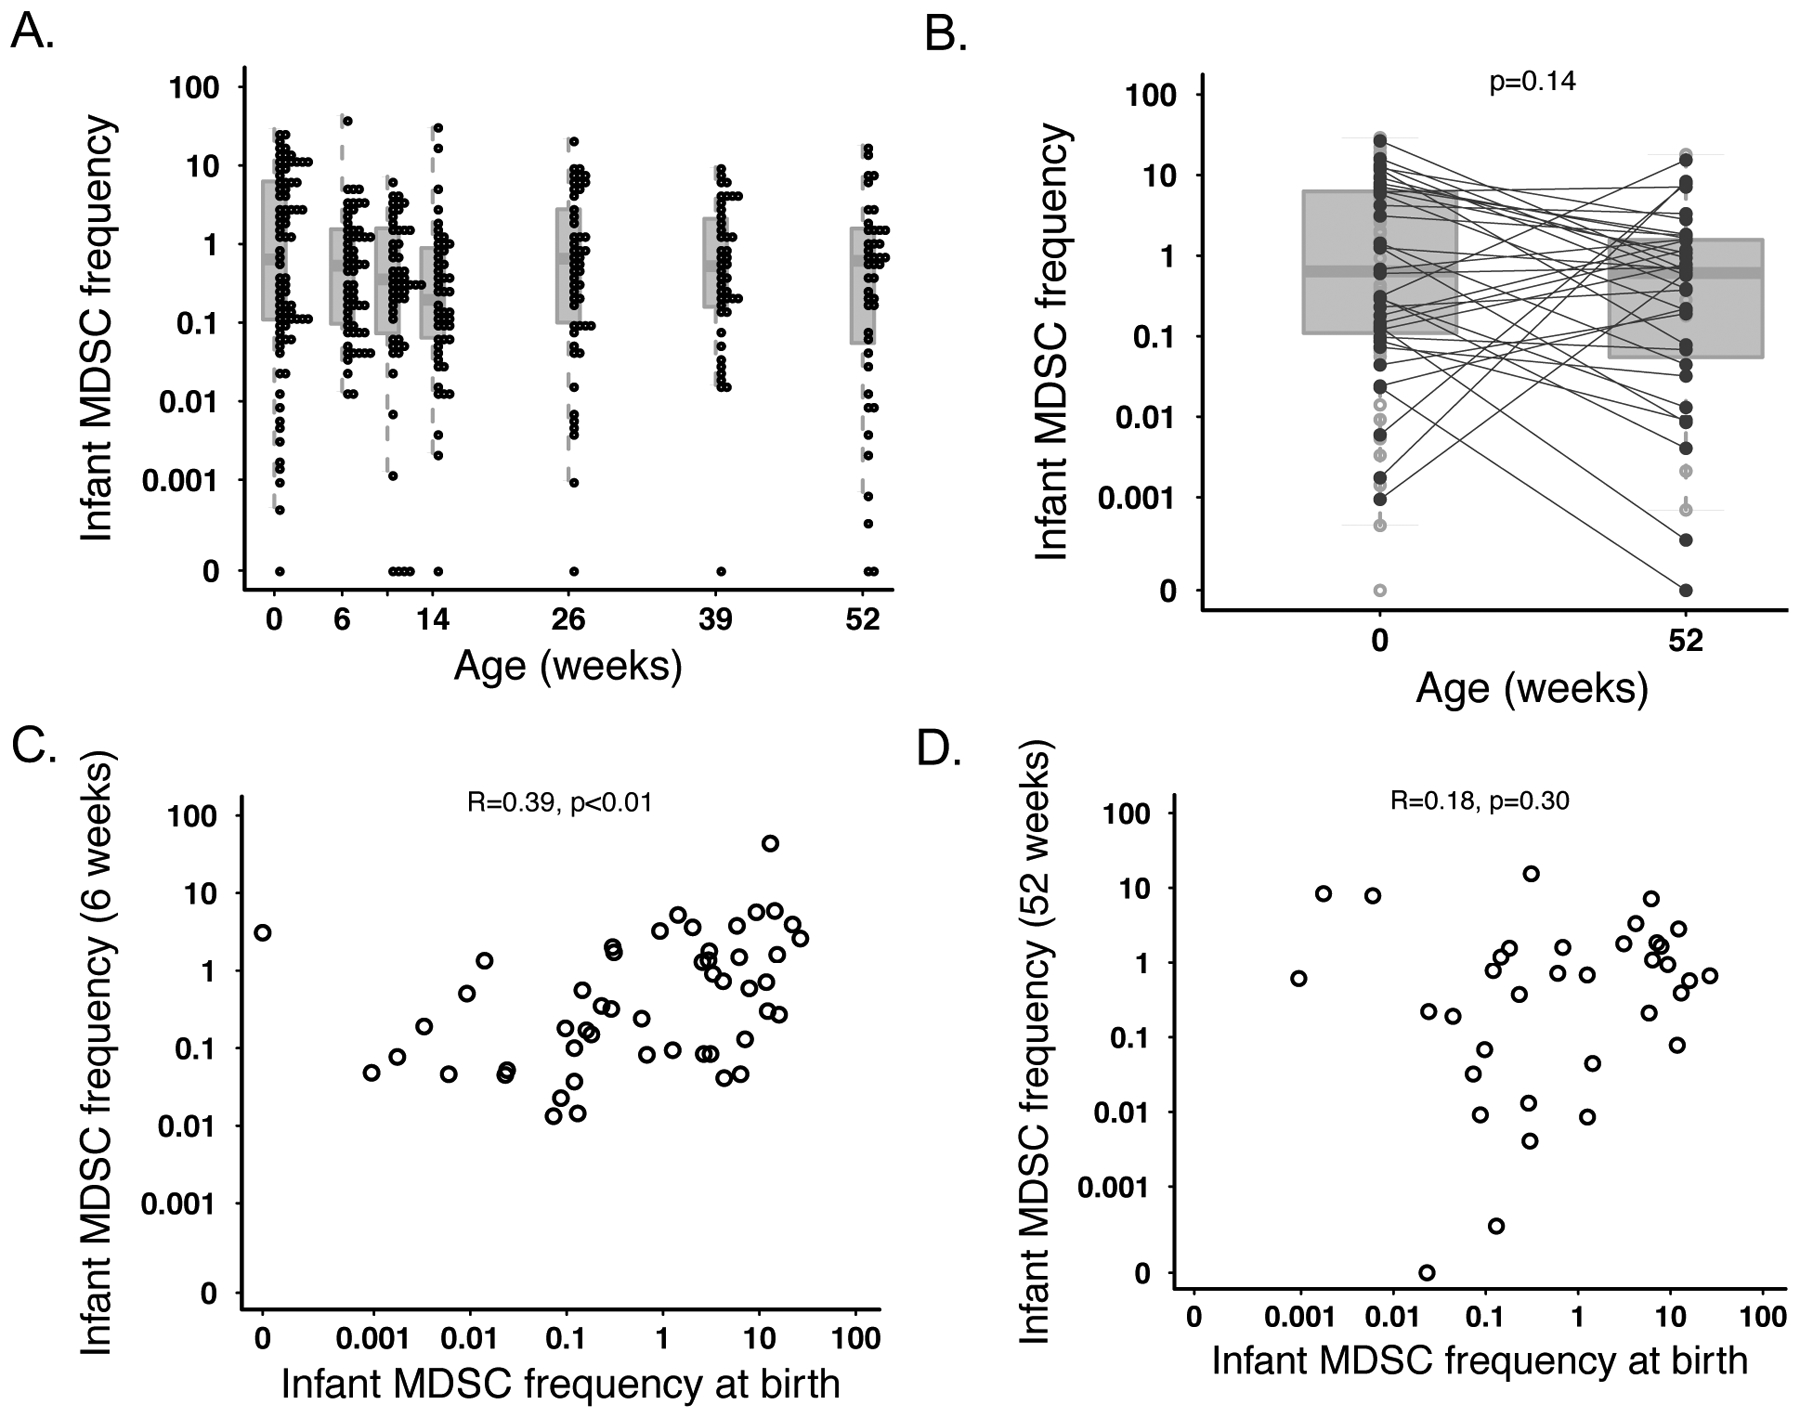
MDSC frequency from birth through 1 year of life. (A) Frequency of live CD14- HLA-DR-CD33+CD11b+CD15+ PMN-MDSC over time in infant samples. Individual infant MDSC frequencies are denoted with an open circle. Each box and line for a given time point represent the IQR and median, respectively, for all infant values. (B) Comparison of median MDSC frequencies at birth (N=80) vs one year (N=43). Lines depict the median for each time point while the boxes represent the IQR. Statistics were performed using a t-test on log-transformed values. Correlative plots depicting the relationship between infant MDSC frequency for an individual infant (C) at birth vs at 6 weeks (N=50) or (D) at birth vs. one year (N=35).
Maternal MDSC Frequency.
We next examined whether an association existed between maternal and infant MDSC frequencies. MDSC frequency between mothers and their infants was strongly positively correlated at birth (r=0.81; p<0.0001; Figure 2A). Although the strength of the correlation decreased, maternal birth MDSC frequency remained correlated with infant MDSC frequency through 6 weeks of age (r=0.3; p=0.035). This association disappeared at all later time points (maternal MDSC at birth vs infant MDSC at 1 year r=0.22; p=0.17; figure 2C). However, the frequency of MDSC in mother-infant pairs was again significantly correlated at 1 year postpartum/1 year of age r=0.74; p<0.001; figure 2D). We found the frequency of maternal MDSC to be significantly higher immediately postpartum (median 1.6% of live cells) compared to 1 year postpartum (median 0.8%; p=0.039; Figure 3A). There was no correlation in the frequency of MDSC in mothers between 0 and 1 year postpartum (r=0.15; p=0.35; Figure 3B).
Figure 2.
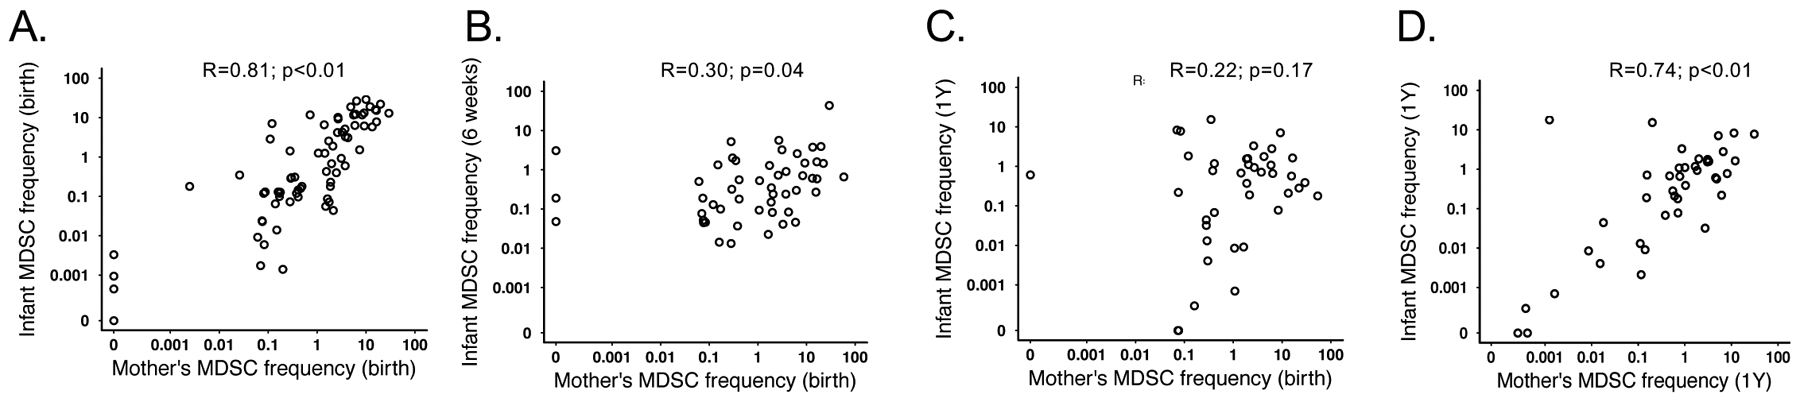
Maternal and infant MDSC frequency are positively correlated. Correlative plots depicting the relationship between MDSC frequencies at (A) birth for both infants and their mothers; N=73 (B) 6 weeks for infants and birth for the mothers; N=51 (C) at one year for the infants and birth for the mothers; N=40 or (D) one year for both infants and their mothers; N=40.
Figure 3.
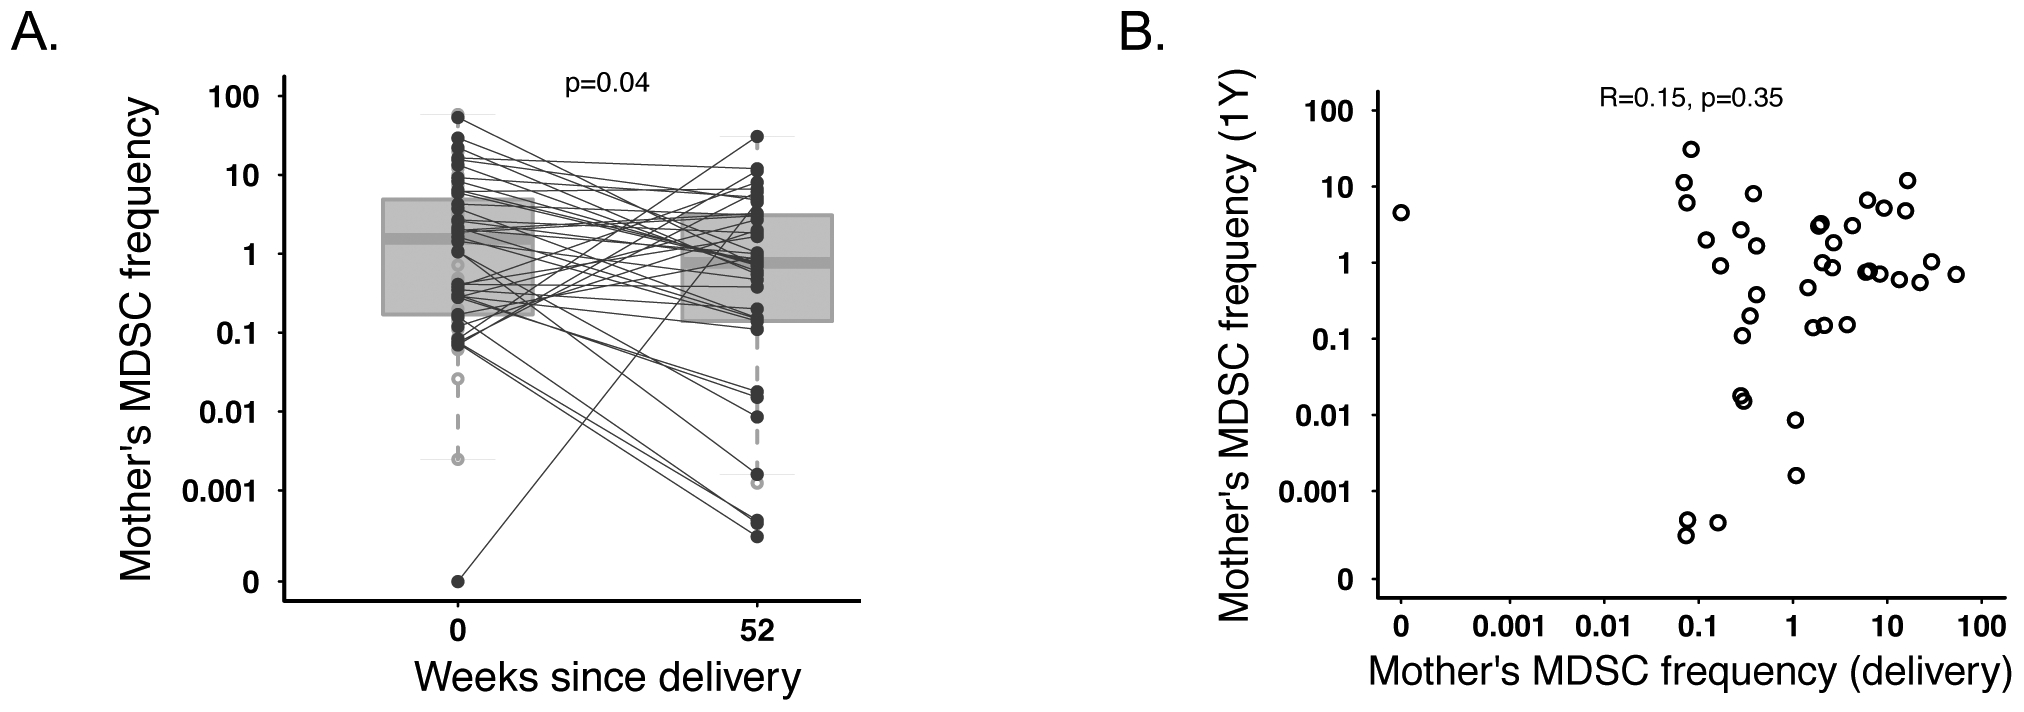
Maternal MDSC significantly decrease between birth and one year. (A) Frequency of PMN-MDSC in mothers at the time of birth or one year after birth (N=40). Statistics were performed using a paired ttest on log-transformed MDSC frequencies. (B) Correlative plot depicting the relationship between maternal MDSC frequency one year after birth vs at the time of birth (N=40).
The Association of MDSC with T cell Proliferative Responses to Vaccine Antigens.
We next wanted to determine the relationship between MDSC frequency and cellular response to vaccination. For this, we measured T cell proliferative responses to PPD, HBSAg, and TT in PBMC from infants at 6, 10, and 14 weeks as well as 6, 9, and 12 months of age. We found that for all antigens, many infants’ peak proliferative response occurred at one of the earliest measured time points after first vaccination (6 weeks for BCG or 14 weeks for HepB and 10 weeks for TT). This was followed by a gradual decline in the responses until one year of life, when the number of proliferative responses rose again and peaked (Supplemental figure 4A). The cohort median peak response (highest response for each infant at any time point) was 8.8% (5.6–17.7%), 5.6% (4.0–11.0%), or 7.5% (4.3–17.6) CFSE-lo (proliferating) of total CD4+ T cells in response to PPD, HBSAg, or TT, respectively. While we observed overall a low frequency of proliferating cells in response to vaccine antigen stimulation, cells were generally much more responsive to Dynabead positive control stimulation (medians: 79.5% across all infants measured at week 10, 61.3% at week 14, 68.3% at week 26, 69.7% at week 39, 72.6% at one year). Additionally, viability in our assay remained high (>90%) across all infants at all time points (data not shown).
Our primary analysis included correlating MDSC frequency at the time of first vaccination (birth for BCG vaccination and 6 weeks, the first vaccine in a series of boosters, for all others) against each individual infant’s peak CD4+ T cell proliferative response to PPD, HBSAg, or TT. We did not observe a relationship between MDSC frequency and the magnitude of peak CD4+ T cell proliferative response to HBSAg (R=0.16; p=0.27; Table 2) or BCG (R=−0.13, p=0.38); however, we observed a positive correlation between infant MDSC frequency and subsequent peak CD4+ T cell proliferative response to stimulation with TT (R=0.31; p=0.028; Table 2). However, this correlation was weak and predominantly driven by three outliers.
Table 2.
Correlative analysis of infant MDSC frequency at time of first vaccination vs. subsequent peak CD4+ T cell proliferative responses to vaccine antigens. Ex-vivo CD4+ T ceN proliferation was measured via CFSE incorporation and flow cytometry following PBMC stimulation with vaccine antigen at weeks 10, 14, 265, 39, and 52. Each infant’s peak response was correlated with the frequency of MDSC at time of first vaccination with each respective antigen (6 weeks for Hepatitis B, DTaP, and birth for BCG; * p<0.05; Pearson’s Correlation).
| CFSE Analysis: Infant peak percentage of proliferating CD4+ T cells vs. MDSC frequency at time of first vaccination | ||||
|---|---|---|---|---|
| Pearson R | P-value | N | Sig | |
| HB SAg | 0.16 | 0.270 | 52 | |
| TT | 0.31 | 0.028 | 49 | * |
| BCG | −0.13 | 0.382 | 46 | |
We next compared the median MDSC frequency in responders and non-responders at the time of vaccination for each vaccine antigen. To take into account all possible time points, we retrospectively classified infants into “non-responder” if ≤2.5% (3 times the median absolute deviation of the negative control wells) of CD4+ T cells were CFSE-lo or “responder” if ever 2.5% of CD4+ T cells were CFSE-lo (Figures 4A–C). We found that MDSC frequency was similar between infants who did not or did respond via T cell proliferation following stimulation with HepB (0.6% vs. 0.3%; p=0.6; Figure 4D), TT (0.5% vs. 0.4%; p=0.8; Figure 4E), or PPD (median 0.4% vs. 1.6% of live cells, respectively; p=0.29; Figure 4F).
Figure 4.
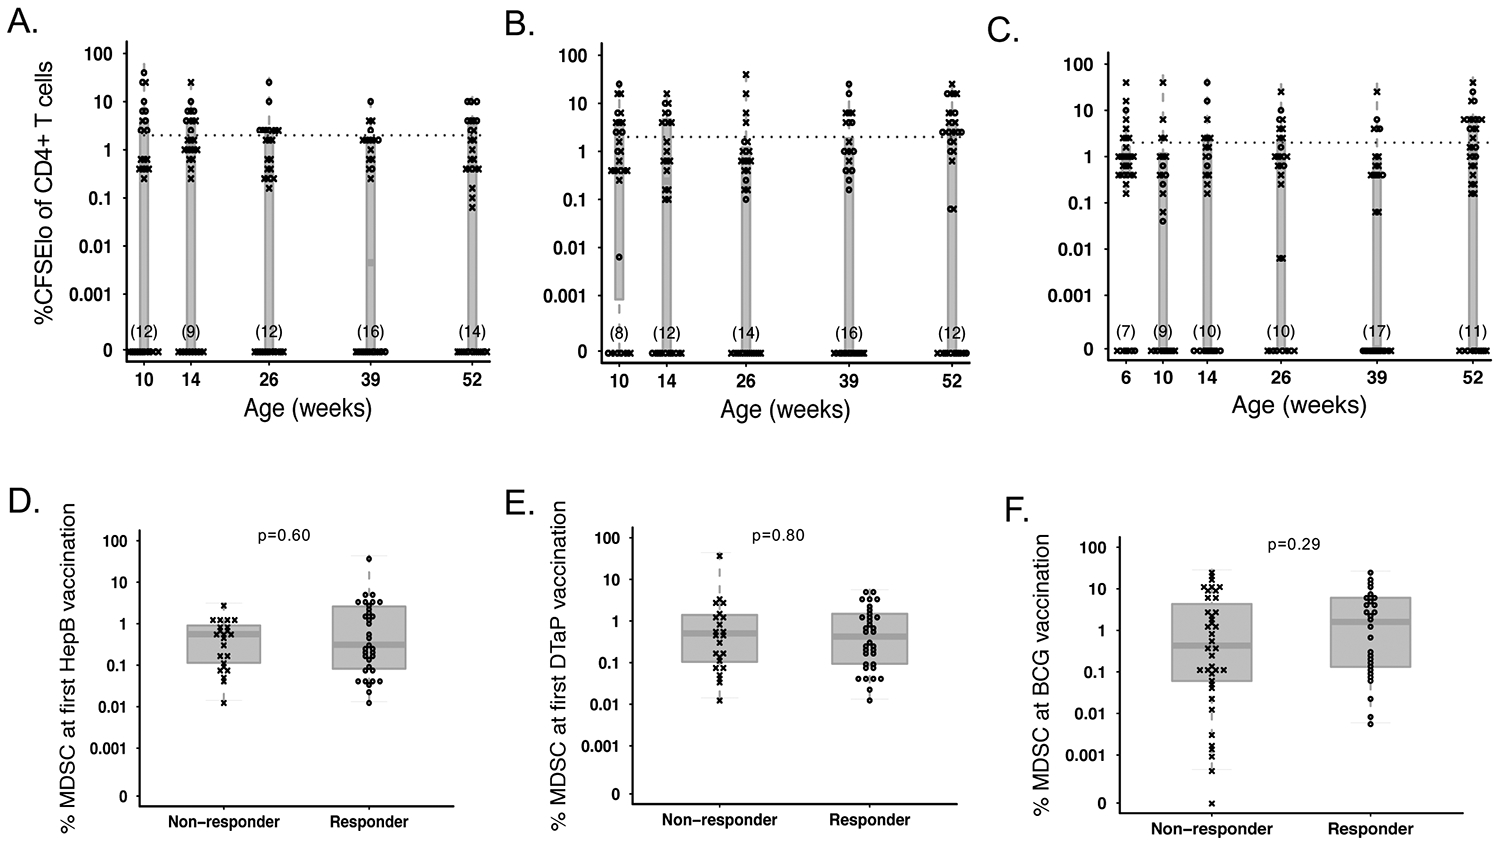
MDSC frequency at the time of vaccination does not affect subsequent T cell proliferative response to vaccine antigens. Percentage of proliferating (CFSElo) CD4+ T cells in infants retrospectively classified as “responders” (o) and ”non-responders” (x) following antigenic stimulation with (A) Hepatitis B surface antigen (B) Tetanus toxoid, or (C) PPD throughout the course of the study. The cutoff for responder status is indicated with a hashed line. PMN-MDSC frequency in infants classified as responders or non-responders to simulation with (D) Hepatitis B surface antigen (N=23 non-responders vs. N=34 responders), (E) Tetanus toxoid (N=23 non-responders vs. N=34 responders) or (F) PPD (N=39 non-responders vs. N=28 responders) at the time of first vaccination with BCG, Hepatitis B, or DTaP, respectively. Statistics were performed using a Wilcoxon two-sample test on MDSC frequencies.
The Association of MDSC with IFN-γ Release in Responses to Vaccine Antigens.
We additionally measured IFN-γ release from PBMC as a readout of cellular response to vaccine antigens. We saw a similar trend with all antigens tested; many infants produced their peak proliferative response at the time point directly after first vaccination (6 weeks for BCG or 10 weeks for HepB, TT, and pertussis antigens). This was followed by a trough in the number of peak responses until 39 weeks (9 months) of life, where we saw the largest number of peak responses (Supplemental figure 4B). The cohort median peak response was 2640 (1676–8196), 70 (26.7–255), 80 (20–220), or 140 (40–420) IFNg+ cells (spot forming cells) in 1–2×10⁵ PBMC for BCG, HepB, TT, and pertussis, respectively.
We did not observe any correlation between MDSC frequency at the time of vaccination and the magnitude of infant peak IFN-γ response upon subsequent restimulation with any of the vaccine antigens tested; Supplemental Table 2). For all antigens other than BCG, we binarized infants into two categories: those who never responded to a given antigen, demonstrating <10 spot forming units (SFU) per million PBMC, and those who did, defined as ≥10 SFU/million PBMC to vaccine antigen (5A-C). Because there were very few “non-responders” for BCG, infants were instead dichotomized into “high” and “low” responders by binarizing around the median response (Figure 5D). In accordance with our hypothesis, infants with a higher MDSC frequency at the time of vaccine priming were less likely to ever respond to pertussis antigen compared to those with a lower MDSC frequency (median 1.2% versus 0.2% of live cells; p=0.02; Figure 5E). Similarly, infants who never responded to HBSAg or TT tended to have a higher frequency of MDSC at time of first vaccination compared to those who did (median 0.7% vs. 0.3%, p=0.08 for HBSAg, Figure 5F; and 0.9% vs. 0.3% for TT, p=0.07, Figure 5G). While infants with low IFN-γ production following BCG stimulation displayed a higher percentage of MDSC at vaccination compared to those who had a higher IFN-γ response (2.6% vs 0.6%, respectively), this was not statistically significant (p=0.36, Figure 5H).
Figure 5.
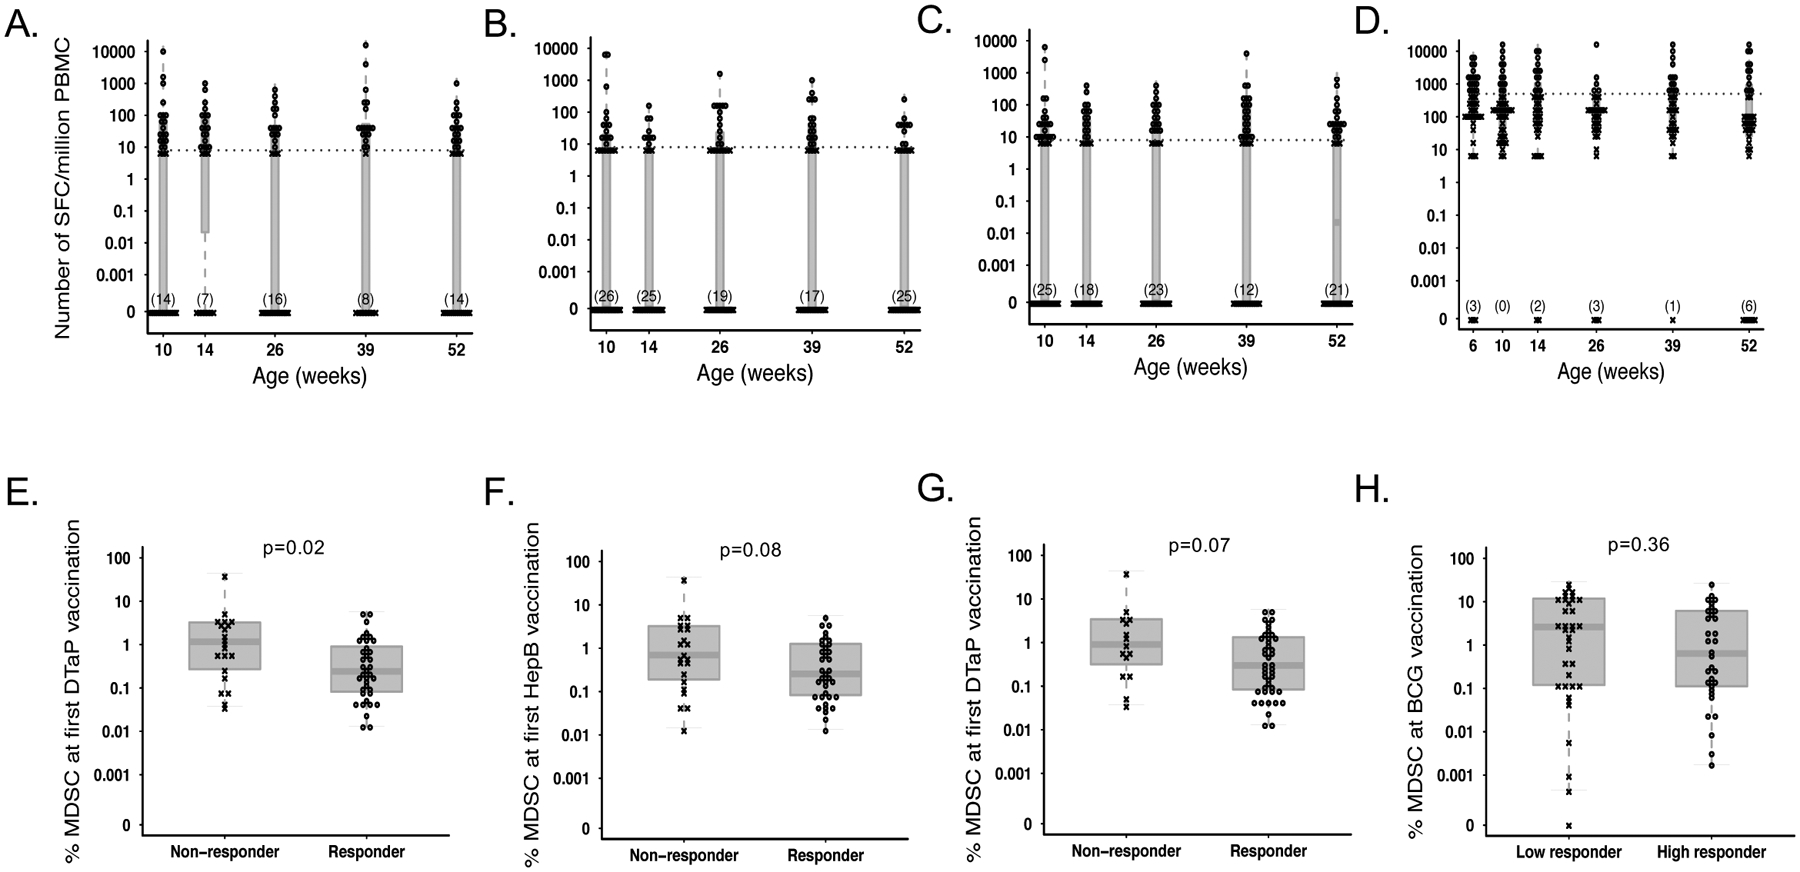
MDSC frequency at the time of vaccination affects subsequent IFNg production from PBMC. Number of IFNg producing, spot forming cells (SFC) per million PBMC from infants retrospectively classified as “responders” (o) and ”non-responders” (x) following antigenic stimulation with (A) Bordetella pertussis, (B) Hepatitis B surface antigen (C) Tetanus toxoid, or (D) BCG throughout the course of the study. The cutoff for responder status is indicated with a hashed line. MDSC frequency in infants classified as responders or non-responders to stimulation with (E) Bordetella pertussis (N=21 non-responders vs. N=37 responders), (F) Hepatitis B surface antigen (N=22 non-responders vs. N=36 responders), (G) tetanus toxoid (N=15 nonresponders vs. N=43 responders), or (H) BCG (N=36 low responders vs. N=32 responders), at the time of first vaccination with BCG, Hepatitis B, or DTaP, respectively. Statistics were performed using a Wilcoxon two-sample test on MDSC frequencies.
The Association of MDSC with Vaccine-specific Antibody Titers Following Vaccination.
In addition to measuring cellular responses, we assessed the association between MDSC frequency at the time of vaccine prime and vaccine-specific antibody responses. For this, we measured anti-pertussis, anti-HBSAg, anti-TT, and anti-Hib antibody concentrations in infant plasma samples from 14 weeks and 6 months via enzyme-linked immunosorbent assay (ELISA). We saw that the peak Ab titer in plasma was dependent on the antigen: while we detected a larger number of infants producing their “peak” anti-Hib and anti-TT antibody responses at 14 weeks compared to 6 months, peak anti-HBSAg antibody responses were only detected at 6 months; none were detected at week 14. Finally, the number of infants producing their peak anti-BP pertussis antibody concentration at 14 weeks was only slightly lower than those producing their peak response at 6 months. The overall cohort median peak responses (including the greatest response elicited at any time point for each infant) were 157 IU/mL (146.5–224.8), 62 IU/mL (36.8–107.9), 3.3 IU/mL (3.0–3.6), or 9.5 IU/mL (7.3–15.0) for anti-BP, anti-HBSAg, anti-TT, and anti-BP antibodies, respectively.
We did not observe a significant correlation between MDSC frequency at the time of first vaccination with the magnitude of the subsequent peak plasma antibody titer for BP (R=0.26; p=0.16; Table 3), and for TT (R=−0.11; p=0.57), or Hib (R=0.02; p=0.93). However, we observed a significant, but weak, positive relationship between MDSC frequency and subsequent peak HBSAg titers (R=0.5; p=0.005), indicating that higher levels of MDSC at the time of vaccination are associated with a higher titer of anti-hepatitis B antibodies in later in life (Table 3).
Table 3.
Correlative analysis of MDSC frequency at the time of first vaccination vs. infant infant peak plasma antibody titers throughout the first year of life. Antibody tiers were measured via antigen-specific ELISA at weeks 14 and 26; each infant’s peak value was correlated with the frequency of MDSC at time of first vaccination with each respective antigen (6 weeks for all; * p<0.05; **p<0.01; Pearson’s Correlation).
| ELISA Analysis: Infant peak plasma antibody titer vs. MDSC frequency at time of first vaccination | ||||
|---|---|---|---|---|
| Pearson R | P-value | N | ||
| BP | 0.26 | 0.164 | 30 | |
| HB SAg | 0.5 | 0.005 | 30 | ** |
| TT | −0.11 | 0.567 | 30 | |
| Hib | 0.02 | 0.934 | 30 | |
We then classified infants into either “low” or “high” responders for each vaccine by binarizing around the median cohort serum antibody titer (Figure 6A–D). We observed MDSC frequency at the time of initial vaccination (6 weeks) to be similar between high and low responders to all vaccinations tested, including: DTaP (pertussis-specific antibodies, median 0.17% in low-responders vs. 0.56% in high-responders, p=0.23, Figure 6E), Hepatitis B (median 0.18% in low-responders vs. 1.16% in high-responders, p=0.14, Figure 6F), DTaP (tetanus-toxoid specific antibodies: median 0.52% vs. 0.15% in low-responders and high-responders, respectively; p=0.18; Figure 6G), and Hib (median 0.24% in low-responders vs. 0.19% in high-responders, p=0.9, Figure 6H).
Figure 6.
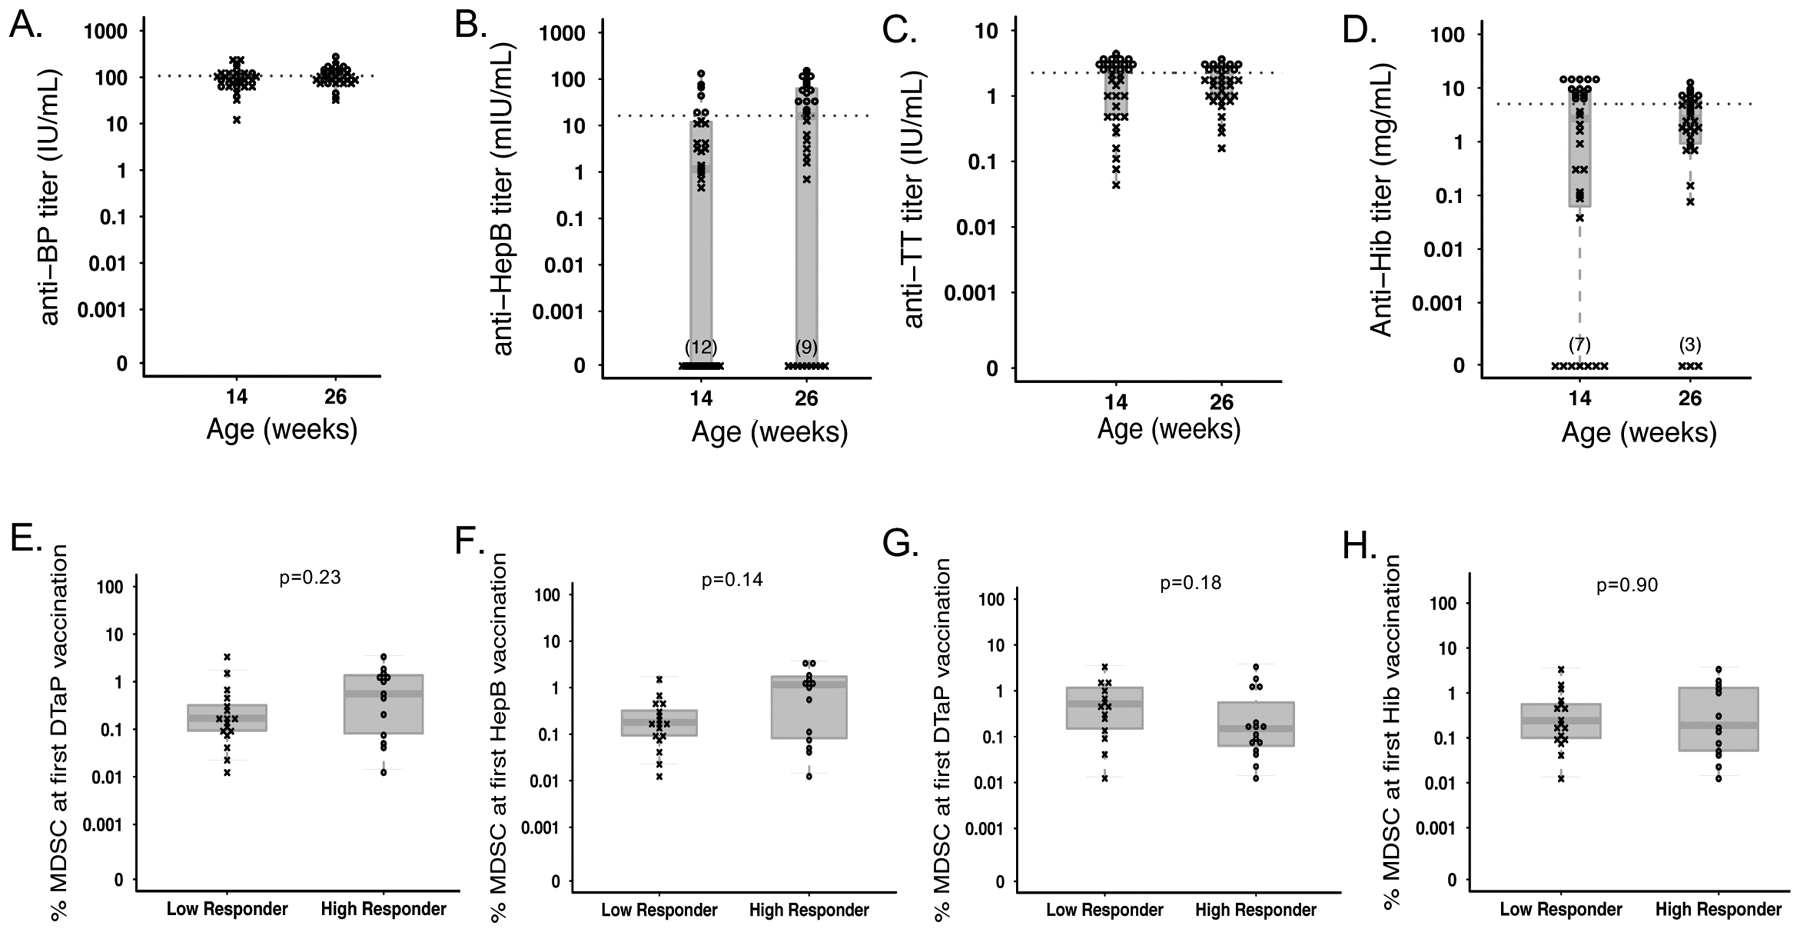
MDSC frequency at the time of vaccination does not affect subsequent humoral response to vaccine antigens. Infant plasma antibody titers of anti- (A) Bordetella pertussis, (B) Hepatitis B, (C) Tetanus toxoid, and (D) Hib antibodies measured by ELISA at 14 and 26 weeks following vaccination with DTaP, Hepatitis B, or Hib. Infants were retrospectively classified as “responders” (o) or ”non-responders” (x), and the cutoff for responder status is indicated with a hashed line. Comparison of MDSC frequency at the time of first vaccination in infants classified as responders or non-responders based on antibody titer of (E) anti-Bordetella pertussis, (F) anti- Hepatitis B (N=17 low responders vs. N=13 high responders for each), (G) anti-tetanus toxoid (N=14 low responders vs. N=16 high responders), or (H) anti-Hib antibodies (N=17 low responders vs. N=13 high responders). Statistics were performed using a Wilcoxon two-sample test on MDSC frequencies.
DISCUSSION
Infectious diseases are a major cause of childhood mortality, and neonates in resource poor areas are at a disproportionately high risk for infections8,9. An immunosuppressive fetal-maternal environment has evolved likely to prevent pathologic inflammation stemming from allogeneic incompatibilities between a fetus and its mother. Indeed, MDSC have been shown to be important during pregnancy, as low frequencies of MDSCs are associated with miscarriage10–13. This immunoregulation likely influences post-natal immune responses, including the response to routine childhood vaccinations (reviewed in [14]). Here we set out to better understand the role of MDSC, an immunosuppressive cell type expanded during gestation and the neonatal period, in influencing neonatal immune responses to childhood vaccinations.
We and others have previously reported through cross-sectional studies that PMN-MDSC are present at a high frequency in cord blood and gradually decrease with age until 6–24 months, where they comprise roughly 1% of live cells4,15. Here we observed a similar, consistent trend in our longitudinal study of South African infants, where PMN-MDSC frequency steadily decreased by about 3-fold from birth to 14 weeks. At 26 weeks, however, we observed a rebound of MDSC frequency, to comparable levels observed at the birth time point. MDSC then remained elevated until at least one year after birth. To our knowledge, this is the only study that has assessed longitudinal MDSC frequency in a cohort of African mother-infant pairs, as previous studies have been carried out primarily in Western cohorts in cross-sectional studies4,16. While the rebound in MDSC frequency was unexpected, it likely coincides with the introduction of foreign antigens through complementary feeds that begin to occur around 6 months of age.
We observed an increase in the frequency of maternal MDSC at the time of birth compared to one year later, when the frequency reached similar levels to what has been observed in adults (0.8% of live cells). This is consistent with a previous cross-sectional study, in which PMN-MDSC were found to be expanded in the peripheral blood of healthy pregnant women compared to non-pregnant controls17. When comparing MDSC frequency within the mother-infant pairs, we observed a strong, positive correlation between maternal and neonate MDSC frequencies at birth. Neonate MDSC levels remained correlated with the maternal birth MDSC frequency through 6 weeks of age, which suggests an ongoing maternal influence on infant MDSC presence. Interestingly infant and maternal MDSC frequencies were still positively correlated one year after birth, supporting the possibility of genetic and/or environmental influence on MDSC frequency. As several immune mediators can be transferred to infants through breast feeding, breast milk might be one driver of this observed association. Indeed, the composition of breast milk varies between individuals, (reviewed in [18]) and influences infant inflammation and immune regulation19. For example, the long-chain fatty acid, prostaglandin E2 (PGE2) found in breast milk can induce MDSC differentiation from bone marrow stem cells20. Finally, common exposure to infectious agents may also lead to an increased and similar MDSC frequency in mother and infant pairs. For example, bacterial, viral, parasitic, and fungal infections have been shown to be associated with increased MDSC frequency (reviewed in [21]).
Because in-vitro suppression of cellular proliferation and IFN-γ production is a major functional characteristic of MDSC22, we expected to see higher MDSC frequency associate with decreased functional responses to common childhood vaccinations. Our data do not provide evidence for a correlation between MDSC frequency at the time of first vaccination and the magnitude of IFN-γ response following subsequent re-stimulation with vaccine antigens. However, we did observe consistently higher MDSC frequencies at the time of initial vaccination in infants who never mounted any IFN-γ response to antigenic re-stimulation with Bordetella pertussis, and a trend showing the same direction of effect in response to Tetanus toxoid and Hepatitis B compared to infants who did respond. Together, these data suggest that MDSC may play a role in informing the probability of a later cellular cytokine memory response to these vaccines, but not necessarily the magnitude of that response. We found no statistically significant difference in the frequency of MDSC in BCG-vaccinated infants who produced IFN-γ after BCG stimulation. Possible explanations for the differential effect of MDSC frequency on BCG-induced responses compared to other vaccines include: 1) BCG is a live vaccine composed of a mixture of antigens; therefore variation in antigen uptake and/or processing by antigen presenting cells may have obscured our ability to observe differences in MDSC-mediated suppression of IFN-γ or 2) it is given at birth when MDSC frequencies are high compared to 6 weeks of age when MDSC levels begin to fall (Figure 1A).
Our findings contrast findings from a previous study showing that MDSC suppressed BCG-specific T cell proliferation after BCG immunization in mice23. Several differences between this study and our present study exist that may explain the different findings, including: (1) species-specific differences (mice vs. human) necessitating a different phenotypic characterization of MDSC and (2) MDSC analyzed in the Martino study in were of monocytic origin, while we focused on PMN-MDSC. Similarly, studies in non-human primates have explored the impact of MDSC populations on vaccine responses to simian immunodeficiency virus (SIV) vaccine candidates. These studies collectively demonstrate that MDSC frequencies may increase following vaccination, and that M-MDSC activity associates with decreased CD8+ T cell responses and worse vaccination outcomes24,25. In contrast, despite a transient vaccine-induced increase in MDSC frequency localized to the site of vaccination, MDSC do not suppress vaccine-specific adaptive responses to influenza vaccination26. Thus, vaccine composition, administration route, and capacity for inducing MDSC together with pre-existing MDSC frequencies all likely to each play a role in the response to vaccination. Importantly, despite low frequencies of M-MDSCs in blood, these studies and others suggest that the suppressive capacity of M-MDSC may be more potent than that of PMN-MDSC27. Thus, future studies of MDSC in humans should aim to fully characterize both PMN-MDSC and M-MDSC.
Aside from a weakly positive correlation between MDSC frequency and the peak CD4+ T cell proliferative response to TT that is likely driven by the presence of 3 outliers with no proliferative response and an extraordinarily low MDSC frequency, we found no evidence that MDSC frequency at the time of vaccination affects the subsequent magnitude or probability of a vaccine antigen-driven CD4+ T cell proliferation response ex-vivo. It is unclear why MDSC would exhibit an effect on ex-vivo cytokine production and not T cell proliferation. It is possible that the addition of costimulatory agents, CD28/CD49d masked the suppressive effect of MDSC in the HepB and TT conditions, as co-stimulatory agents were necessary to induce proliferative responses above baseline for these antigens. However, we think this is unlikely because we did observe a difference in IFN-γ production under the same stimulation conditions. Despite the costimulation, CD4 T cell proliferation in general was low in response to the antigens used, which may in part be due to the low frequency of antigen-specific cells; this may have masked any MDSC-associated difference in proliferation. Furthermore, while the CFSE assay focused on CD4+ T cells, our ELISPOT assay detected bulk cellular IFN-γ response. Therefore, it is possible that MDSC had a greater influence on non-CD4+ T cell responses. Because our flow cytometry gating strategy for assessing CD4+ T cells did not employ CD8, double negative (DN) T cells were likely present but unaccounted for in our analyses. Albeit a small proportion of infant cells (≤1% of T cells28), DN T cells demonstrate a strong regulatory capacity29,30. Similarly, we did not include markers to identify regulatory T cells, which have been shown to be expanded and possess potent regulatory capacity in infants (reviewed in31). Thus, one limitation of our analysis includes our inability to discriminate whether natural variation found in frequencies of these regulatory cells contributed to differential cellular responsiveness to vaccine antigens, ultimately obscuring our ability to specifically assess PMN-MDSC-associated effects. Additionally, PMN-MDSC viability is known to be negatively affected by cryopreservation32 and may also decrease with time ex-vivo. Therefore, every attempt was made to process these cells as quickly as possible following blood draw. While we observed very high cell viability overall in our study (>97.7% viability of single cells), we cannot rule out completely that small differences in overall cell viability or the possibility of alterations in PMN-MDSC activity due to differential delays to processing may have impacted our results.
We found a weak but significant positive correlation between infant MDSC frequency and the subsequent peak plasma HBSAg antibody titer, suggesting that a higher percentage of MDSC at the time of vaccination may correlate with more HBSAg antibodies later in infancy. This observation contrasted our hypothesis that higher MDSC frequency would be observed in infants who did not mount a robust response to vaccination. As the Hepatitis B vaccination was introduced in South Africa vaccination in 1995, the majority of the mothers in this study were unimmunized. Although we did not test maternal Hepatitis B status, approximately one-third of South Africans of child-bearing age are immune due to natural infection, and up to 12% are chronically infected33,34. Because chronic Hepatitis B infection is associated with an expansion of MDSC35, it is likely that past or present maternal infection with Hepatitis B leads to an increase in maternal MDSC frequency in addition to the development of Hepatitis B antibodies. Because maternal pathogen-specific antibodies inhibit the maturation and response of infant B lymphocyte responses36, passive antibody transfer of hepatitis B IgG from mother to infant may inhibit infant antibody responses, thereby obscuring any further inhibitory effects of MDSC. Finally, while we did not observe MDSC frequency to be associated with an impaired antibody response to the vaccine antigens in our study (Table 3 and Figure 6), several other studies have demonstrated that PMN-MDSC can inhibit or activate B cell responses via a variety of mechanisms and that this is largely dictated by the cytokine microenvironment37,38. Therefore, PMN-MDSC could have differentially modulate vaccine responses depending on the type of vaccine and/or adjuvant used, maintaining their relevance in the context of vaccine development and testing. Indeed, the type of adjuvant has been shown to have differential effects of MDSC activity during therapeutic cancer vaccination (reviewed in [39]).
Another important point to consider is that our study was conducted in South Africa where all infants receive the BCG vaccine at birth. A recent study has demonstrated that BCG vaccination expands hematopoietic stem cells (HSC) and “immunologically trains” HSC to generate trained monocytes/macrophages40. Whether BCG vaccination and subsequently trained HSC alter vaccine responses or the function of PNM-MDSC has yet to be described. However, it remains possible that PMN-MDSC may have a different effect on vaccine responses in a country where infants are not vaccinated with BCG at birth.
In summary, we describe for the first time a longitudinal assessment of PMN-MDSC in a cohort of South African infants and their mothers. We demonstrated that MDSC may influence the cellular cytokine response, particularly IFN-γ release, in response to vaccination. These findings may be particularly relevant in the context of vaccine development, and suggest the potential for infant MDSC to inhibit responses following vaccination with vaccines that induce strong IFN-γ responses, such as live-attenuated vaccines. Our study does not support an association between PMN-MDSC and vaccine antigen-induced CD4+ T cell proliferative responses nor humoral responses to several vaccine antigens. These findings should be confirmed in other cohorts, and tested for causation and/or consequence using animal models, in which extraneous variables that may affect MDSC frequency, such as BCG vaccination, environmental exposures, and diet can be rigorously controlled.
Supplementary Material
ACKNOWLEDGEMENTS
This work was funded by the NIH National Institute of Allergy and Infectious Diseases (R01AI100018 to HH) and the UW CFAR (P30 AI027757) supported by NIAID, NCI, NIMH, NIDA, NICHD, NHLBI, NIA. HBJ was funded in part by K08HD069201. EBK was funded in part by the National Health Scholars Programme of the Medical Research Council of South Africa (SA-MRC). We would like to thank all study participants and clinic staff. We further acknowledge Western Cape Department of Health and the City of Cape Town for facilitating access to the clinic.
Footnotes
The authors declare that no conflict of interest exists.
REFERENCES
- 1.IGME (UN Inter-Agency Group for Child Mortality Estimation). Levels and Trends in Child Mortality Report 2018. Available from: https://childmortality.org/reports. Accessed January 24, 2020.
- 2.Gabrilovich DI, Nagaraj S. Myeloid-derived suppressor cells as regulators of the immune system. Nat Rev Immunol. 2009;9:162–174. [DOI] [PMC free article] [PubMed] [Google Scholar]
- 3.Gervassi A, Lejarcegui N, Dross S, et al. Myeloid derived suppressor cells are present at high frequency in neonates and suppress in vitro T cell responses. PloS one. 2014;9:e107816. [DOI] [PMC free article] [PubMed] [Google Scholar]
- 4.Rieber N, Gille C, Köstlin N, et al. Neutrophilic myeloid-derived suppressor cells in cord blood modulate innate and adaptive immune responses: MDSCs in cord blood. Clinical & Experimental Immunology. 2013;174:45–52. [DOI] [PMC free article] [PubMed] [Google Scholar]
- 5.Kotsakis A, Harasymczuk M, Schilling B, et al. Myeloid-derived suppressor cell measurements in fresh and cryopreserved blood samples. Journal of Immunological Methods. 2012;381:14–22. [DOI] [PMC free article] [PubMed] [Google Scholar]
- 6.Rathmell JC, Farkash EA, Gao W, et al. IL-7 enhances the survival and maintains the size of naive T cells. J Immunol. 2001;167:6869–6876. [DOI] [PubMed] [Google Scholar]
- 7.Jaleco S, Kinet S, Hassan J, et al. IL-7 and CD4+ T-cell proliferation. Blood. 2002;100:4676–4677; author reply 4677–4678. [DOI] [PubMed] [Google Scholar]
- 8.Bhutta ZA, Black RE. Global maternal, newborn, and child health--so near and yet so far. N Engl J Med. 2013;369:2226–2235. [DOI] [PubMed] [Google Scholar]
- 9.Sepúlveda J, Murray C. The state of global health in 2014. Science. 2014;345:1275–1278. [DOI] [PubMed] [Google Scholar]
- 10.Verma P, Verma R, Nair RR, et al. Altered crosstalk of estradiol and progesterone with Myeloid-derived suppressor cells and Th1/Th2 cytokines in early miscarriage is associated with early breakdown of maternal-fetal tolerance. Am J Reprod Immunol. 2019;81:e13081. [DOI] [PubMed] [Google Scholar]
- 11.Ostrand-Rosenberg S, Sinha P, Figley C, et al. Frontline Science: Myeloid-derived suppressor cells (MDSCs) facilitate maternal-fetal tolerance in mice. J Leukoc Biol. 2017;101:1091–1101. [DOI] [PMC free article] [PubMed] [Google Scholar]
- 12.Köstlin-Gille N, Dietz S, Schwarz J, et al. HIF-1α-Deficiency in Myeloid Cells Leads to a Disturbed Accumulation of Myeloid Derived Suppressor Cells (MDSC) During Pregnancy and to an Increased Abortion Rate in Mice. Front Immunol. 2019;10:161. [DOI] [PMC free article] [PubMed] [Google Scholar]
- 13.Ren J, Zeng W, Tian F, et al. Myeloid-derived suppressor cells depletion may cause pregnancy loss via upregulating the cytotoxicity of decidual natural killer cells. Am J Reprod Immunol. 2019;81:e13099. [DOI] [PubMed] [Google Scholar]
- 14.Gantt S, Gervassi A, Jaspan H, et al. The role of myeloid-derived suppressor cells in immune ontogeny. Front Immunol. 2014;5:387. [DOI] [PMC free article] [PubMed] [Google Scholar]
- 15.Köstlin N, Vogelmann M, Spring B, et al. Granulocytic myeloid-derived suppressor cells from human cord blood modulate T-helper cell response towards an anti-inflammatory phenotype. Immunology. 2017;152:89–101. [DOI] [PMC free article] [PubMed] [Google Scholar]
- 16.Schwarz J, Scheckenbach V, Kugel H, et al. Granulocytic myeloid-derived suppressor cells (GR-MDSC) accumulate in cord blood of preterm infants and remain elevated during the neonatal period. Clin Exp Immunol. 2018;191:328–337. [DOI] [PMC free article] [PubMed] [Google Scholar]
- 17.Köstlin N, Kugel H, Spring B, et al. Granulocytic myeloid derived suppressor cells expand in human pregnancy and modulate T-cell responses. Eur J Immunol. 2014;44:2582–2591. [DOI] [PubMed] [Google Scholar]
- 18.Järvinen KM, Martin H, Oyoshi MK. Immunomodulatory effects of breast milk on food allergy. Ann Allergy Asthma Immunol. 2019;123:133–143. [DOI] [PMC free article] [PubMed] [Google Scholar]
- 19.Laitinen K, Hoppu U, Hämäläinen M, et al. Breast milk fatty acids may link innate and adaptive immune regulation: analysis of soluble CD14, prostaglandin E2, and fatty acids. Pediatr Res. 2006;59:723–727. [DOI] [PubMed] [Google Scholar]
- 20.Sinha P, Clements VK, Fulton AM, et al. Prostaglandin E2 promotes tumor progression by inducing myeloid-derived suppressor cells. Cancer Res. 2007;67:4507–4513. [DOI] [PubMed] [Google Scholar]
- 21.Medina E, Hartl D. Myeloid-Derived Suppressor Cells in Infection: A General Overview. J Innate Immun. 2018;10:407–413. [DOI] [PMC free article] [PubMed] [Google Scholar]
- 22.Bronte V, Brandau S, Chen S-H, et al. Recommendations for myeloid-derived suppressor cell nomenclature and characterization standards. Nat Commun. 2016;7:12150. [DOI] [PMC free article] [PubMed] [Google Scholar]
- 23.Martino A, Badell E, Abadie V, et al. Mycobacterium bovis bacillus Calmette-Guérin vaccination mobilizes innate myeloid-derived suppressor cells restraining in vivo T cell priming via IL-1R-dependent nitric oxide production. J Immunol. 2010;184:2038–2047. [DOI] [PubMed] [Google Scholar]
- 24.Vaccari M, Fourati S, Brown DR, et al. Myeloid Cell Crosstalk Regulates the Efficacy of the DNA/ALVAC/gp120 HIV Vaccine Candidate. Front Immunol. 2019;10:1072. [DOI] [PMC free article] [PubMed] [Google Scholar]
- 25.Sui Y, Hogg A, Wang Y, et al. Vaccine-induced myeloid cell population dampens protective immunity to SIV. J Clin Invest. 2014;124:2538–2549. [DOI] [PMC free article] [PubMed] [Google Scholar]
- 26.Lin A, Liang F, Thompson EA, et al. Rhesus Macaque Myeloid-Derived Suppressor Cells Demonstrate T Cell Inhibitory Functions and Are Transiently Increased after Vaccination. The Journal of Immunology. 2018;200:286–294. [DOI] [PubMed] [Google Scholar]
- 27.Youn J-I, Gabrilovich DI. The biology of myeloid-derived suppressor cells: the blessing and the curse of morphological and functional heterogeneity. Eur J Immunol. 2010;40:2969–2975. [DOI] [PMC free article] [PubMed] [Google Scholar]
- 28.Schatorjé EJH, Gemen EFA, Driessen GJA, et al. Paediatric Reference Values for the Peripheral T cell Compartment: T Lymphocyte Subsets in Children. Scandinavian Journal of Immunology. 2012;75:436–444. [DOI] [PubMed] [Google Scholar]
- 29.Strober S, Dejbachsh-Jones S, Van Vlasselaer P, et al. Cloned natural suppressor cell lines express the CD3+CD4-CD8- surface phenotype and the alpha, beta heterodimer of the T cell antigen receptor. J Immunol. 1989;143:1118–1122. [PubMed] [Google Scholar]
- 30.Fischer K, Voelkl S, Heymann J, et al. Isolation and characterization of human antigen-specific TCRαβ+ CD4-CD8- double-negative regulatory T cells. Blood. 2005;105:2828–2835. [DOI] [PubMed] [Google Scholar]
- 31.Ndure J, Flanagan KL. Targeting regulatory T cells to improve vaccine immunogenicity in early life. Front Microbiol. 2014;5:477. [DOI] [PMC free article] [PubMed] [Google Scholar]
- 32.Dagur PK, McCoy JP. Collection, Storage, and Preparation of Human Blood Cells. Curr Protoc Cytom. 2015;73:5.1.1–5.1.16. [DOI] [PMC free article] [PubMed] [Google Scholar]
- 33.Vardas E, Mathai M, Blaauw D, et al. Preimmunization epidemiology of hepatitis B virus infection in South African children. J Med Virol. 1999;58:111–115. [PubMed] [Google Scholar]
- 34.Samsunder N, Ngcapu S, Lewis L, et al. Seroprevalence of hepatitis B virus: Findings from a population-based household survey in KwaZulu-Natal, South Africa. International Journal of Infectious Diseases. 2019;85:150–157. [DOI] [PMC free article] [PubMed] [Google Scholar]
- 35.Lv Y, Cui M, Lv Z, et al. Expression and significance of peripheral myeloid-derived suppressor cells in chronic hepatitis B patients. Clinics and Research in Hepatology and Gastroenterology. 2018;42:462–469. [DOI] [PubMed] [Google Scholar]
- 36.Voysey M, Kelly DF, Fanshawe TR, et al. The Influence of Maternally Derived Antibody and Infant Age at Vaccination on Infant Vaccine Responses : An Individual Participant Meta-analysis. JAMA Pediatr. 2017;171:637–646. [DOI] [PMC free article] [PubMed] [Google Scholar]
- 37.Özkan B, Lim H, Park S-G. Immunomodulatory Function of Myeloid-Derived Suppressor Cells during B Cell-Mediated Immune Responses. Int J Mol Sci;19. Epub ahead of print May 15, 2018. DOI: 10.3390/ijms19051468. [DOI] [PMC free article] [PubMed] [Google Scholar]
- 38.Dong G, Yang Y, Li X, et al. Granulocytic myeloid-derived suppressor cells contribute to IFN-I signaling activation of B cells and disease progression through the lncRNA NEAT1-BAFF axis in systemic lupus erythematosus. Biochimica et Biophysica Acta (BBA) - Molecular Basis of Disease. 2020;1866:165554. [DOI] [PubMed] [Google Scholar]
- 39.Fernández A, Oliver L, Alvarez R, et al. Adjuvants and myeloid-derived suppressor cells: enemies or allies in therapeutic cancer vaccination. Hum Vaccin Immunother. 2014;10:3251–3260. [DOI] [PMC free article] [PubMed] [Google Scholar]
- 40.Kaufmann E, Sanz J, Dunn JL, et al. BCG Educates Hematopoietic Stem Cells to Generate Protective Innate Immunity against Tuberculosis. Cell. 2018;172:176–190.e19. [DOI] [PubMed] [Google Scholar]
Associated Data
This section collects any data citations, data availability statements, or supplementary materials included in this article.