

Abstract
Chilean papaya is grown in Central Chile and is considered to be an important source of fiber, sugars, and antioxidants. The effect of different vacuum drying temperatures (40, 50, 60, 70, and 80 °C) on the composition of papaya pulp was evaluated. The inhibitory effect of papaya extracts on α-glucosidase activity, as a regulator of blood sugar, was also evaluated. Drying reduced water activity of the pulp to less than 0.6, thereby, assuring the product stability, while maintaining simple sugars, vitamin C, and total flavonoids. Total phenolic content and antioxidant capacity by DPPH assay increased with respect to the fresh pulp by 1.5 and 2.6 times, respectively. The inhibitory effect of papaya extracts on α-glucosidase was evaluated by determining the IC50 for each sample and the acarbose equivalents. The results indicate the suitability of the dried extract of Chilean papaya as a regulator of glucose metabolism in Type II diabetes patients.
Keywords: α-Glucosidase activity, Accelerated solvent extraction, antioxidant activity, Caricaceae
Introduction
Chilean papaya (also known as “Mountain Papaya”), belonging to the genus Vasconcellea, is commonly produced in South America, especially in Colombia, north of Ecuador, and Central Chile. It presents a strong flavor with its characteristic aroma, along with a firm yellow pulp and a high content of papain enzyme (Gaete-Eastman et al. 2009). These papayas are commonly used to produce preserved fruit, juice, jam, or sweets. Nowadays, the intake of fruits has increased since a clear relationship between its consumption and better health has been pointed out by several authors (Gayosso-García Sancho et al. 2011; Abrol et al. 2014; Spínola et al. 2015).
Its generally known that fruits are important sources of dietary fiber and antioxidant compounds; this is also true for papaya, in which several bioactive compounds have been previously identify, such as polyphenols, carotenoids, vitamin C, among others compounds with clear antioxidant activity (Gayosso-García Sancho et al. 2011; Abrol et al. 2014; Nieto-Calveche et al. 2016). Currently, diabetes is the main concern of morbidity and mortality hence investigations focus on the study of the beneficial traits on including fruits and vegetables on the diet for the prevention of chronic diseases. Among the bioactive components in fruits that are of interest, phenolic compounds are on the target, they even possess the capacity to inhibit alpha-glycosidase to slow down the carbohydrate digestion and absorption and hence, reducing the postprandial blood glucose level (Alongi et al. 2018; Arouma et al. 2014).
Unlike tropical papaya (Carica papaya), Chilean papaya (Vasconcellea pubescens) is usually grown in colder climates (Briones-Labarca et al. 2015) and its composition is not as well-known. As is generally known for fruits, many environmental and botanical factors have an impact on their biochemical composition and a complete characterization of the fresh fruit is necessary to evaluate the impact of processing.
Papaya pulp is of great nutritional significance but is highly perishable hence needs immediate processing to earn commercial benefits. Like in most fruits, its elevated water content needs to be addressed to increase its shelf life. Among them, drying is the best way with a fastened conversion rate, low water activity, and microbial proliferation inhibition (Abrol et al. 2014). Along with increased conservation, drying can also reduce transportation and storage costs (Abrol et al. 2014; Tello-Ireland et al. 2011). Vacuum drying is a dehydration technique suitable for heat sensitive matrix, such as fruits (da Silva Junior et al. 2018; Chandra et al. 2020). There are several examples of vacuum drying of fruits that can be found, such as guava (Tan et al. 2020), mango (Singh-Sogi et al. 2015), among others. Vacuum drying presents a high drying rate, at low temperatures and the absence of oxygen that can increase the preservation of bioactive compounds in the resulting dried pulp (Kayacan et al. 2018). Even if vacuum drying is beneficial in terms of shelf life and logistics, it could be detrimental to nutritional quality since many bioactive compounds present in the fresh pulp could be affected during the process.
The present study aimed to investigate the effects of vacuum drying on Chilean papaya pulp. Physicochemical parameters and antioxidant capacity and antidiabetic activity were evaluated. We hypothesize that drying conditions will affect quality parameters of papaya pulp, but the knowledge of this behavior will provide a better understanding to develop potential functional ingredients with added value.
Materials and methods
Raw material and pulp obtaining
Chilean papayas were purchased from a local market, from Elqui Valley, Region of Coquimbo, Chile. Fruits were selected based on the commercial maturity stage by observation of yellow color (80–90%) and washed in running tap water. They were cut into longitudinal sections to remove seeds and mucilage. Later, fruit pieces with peel of 9.0 × 1.5 cm and 0.4 cm thickness were homogenized in an electric blender (Philips, HR1720, Amsterdam, Netherlands) for 2 min. The obtained pulp was packed in flexible low-density polyethylene bags and stored frozen at − 20 °C until use.
Drying experiments and drying kinetics
Frozen papaya pulp refrigerated for 12 h, then 40 g were vacuum dried in a thin layer (13.5 × 9.5 cm aluminium trays) using a vacuum oven (Memmert, model VO 400, Schwabach, Germany) equipped with a vacuum pump (Buchi, model V-100, Flawil, Switzerland), maintained at 15 kPa. The drying processes were conducted at 40, 50, 60, 70, and 80 °C. To ensure that fluctuation of the surrounding conditions do not affect measurements, the aluminum tray with the sample is suspended with a gasket in the form of a ring into the drying chamber, and this hangs on a digital balance (Ohaus SP402; precision ± 0.01 g), interconnected by an interface system (Ohaus RS232) which recorded and stored the data at programmed time intervals (every 30 min). Drying experiments were replicated at least three times for each condition. Finally, each batch was grounded using a basic analytical mill (IKA A-11, USA) and papaya pulp powder samples were stored in plastic bags at 5 °C until further analysis.
Mathematical modeling of drying kinetics
The moisture ratio (MR) is the amount of moisture remaining in the papaya samples compared to the initial moisture content, and it was calculated using Eq. (1):
| 1 |
where Mt is the moisture content at any time; Me is the equilibrium moisture content; and M0 is the initial moisture content of the papaya samples. Moisture content is expressed in g water/g dry matter (D.M.). Owing to longer drying times during vacuum drying of papaya pulp, Me is fairly smaller than M0 and Mt, therefore Eq. (1) was simplified as expressed in Eq. (2) (Vega-Gálvez et al. 2019)
| 2 |
In addition, the obtained drying data (time versus MR) were modeled by seven thin-layer drying models where their equations and parameters are tabulated in Table 1.
Table 1.
Parameters of the mathematical models applied to drying curves of Vasconcellea pubescens
| Model | Parameters | Drying temperatures (°C) | ||||
|---|---|---|---|---|---|---|
| 40 | 50 | 60 | 70 | 80 | ||
| Midill–Kucuk | Equation | MR = a exp(−ktn) + bt | ||||
| a | 0.985 ± 0.008 | 0.9740 ± 0.007 | 0.9686 ± 0.009 | 0.9834 ± 0.002 | 0.974 ± 0.005 | |
| k | 2.33 × 10⁻⁴ ± 0.00 | 2.666 × 10⁻⁴ ± 0.00 | 2.33 × 10⁻⁴ ± 5.77 × 10⁻⁵ | 5.4 × 10⁻⁴ ± 0.00 | 8 × 10⁻⁴ ± 0.00 | |
| b | −1.51 × 10⁻⁴ ± 8.48 × 10⁻⁵ | −6.855 × 10⁻⁵ ± 0.085 | −2.76 × 10⁻⁵ ± 1.24 × 10⁻⁵ | −2.9 × 10⁻⁴ ± 2.11 × 10⁻⁴ | −8 × 10⁻⁵ ± 1.04 × 10⁻⁴ | |
| n | 1.331 ± 0.1491 | 1.499 ± 0.092 | 1.672 ± 0.027 | 1.454 ± 0.1258 | 1.579 ± 0.1633 | |
| RMSE | 0.0104 | 0.0189 | 0.0188 | 0.1507 | 0.0146 | |
| χ2 | 0.0001 | 0.0003 | 0.0003 | 0.0257 | 0.0002 | |
| adj R2 | 0.9990 | 0.9976 | 0.9979 | 0.9984 | 0.9982 | |
| Logarithmic | Equation | MR = a exp(−kt) + c | ||||
| a | 1.803 ± 0.3446 | 1.336 ± 0.075 | 1.235 ± 0.042 | 1.239 ± 0.055 | 1.256 ± 0.028 | |
| k | 9.33 × 10⁻⁴ ± 0.00 | 2.9 × 10⁻³ ± 0.00 | 5.53 × 10⁻³ ± 0.00 | 6.86 × 10⁻³ ± 0.00 | 7.2 × 10⁻³ ± 0.00 | |
| c | − 0.783 ± 0.356 | − 0.295 ± 0.085 | − 0.165 ± 0.040 | − 0.176 ± 0.052 | − 0.205 ± 0.045 | |
| RMSE | 0.0166 | 0.0308 | 0.0452 | 0.0422 | 0.0500 | |
| χ2 | 0.0002 | 0.0010 | 0.0020 | 0.0020 | 0.0289 | |
| adj R2 | 0.9973 | 0.9924 | 0.9859 | 0.9911 | 0.9900 | |
| Wang Sing | Equation | MR = 1 + at + bt2 | ||||
| b | 4.33 × 10⁻⁷ ± 2.30 × 10⁻⁷ | 2.333 × 10⁻⁶ ± 5.77 × 10⁻⁷ | 6 × 10⁻⁶ ± 1 × 10⁻⁶ | 8 × 10⁻⁶ ± 1.73 × 10⁻⁶ | 1.66 × 10⁻⁵ ± 5.77 × 10⁻⁶ | |
| a | -1.43 × 10⁻³ ± 0.00 | -3.2 × 10⁻³ ± 0.00 | -5.07 × 10⁻³ ± 0.00 | -6.06 × 10⁻³ ± 0.00 | -7.76 × 10⁻³ ± 0.00 | |
| RMSE | 0.0150 | 0.0407 | 0.0427 | 0.0588 | 0.0728 | |
| χ2 | 0.0002 | 0.0018 | 0.0017 | 0.0039 | 0.0061 | |
| adj R2 | 0.9975 | 0.9953 | 0.9918 | 0.9938 | 0.9927 | |
| Weibull | Equation | MR = exp [− (t/β)α] | ||||
| β | 451.65 ± 55.5266 | 208.80 ± 10.07 | 136.51 ± 10.7189 | 110.63 ± 12.73 | 89.19 ± 9.681 | |
| α | 1.296 ± 0.028 | 1.3782 ± 0.013 | 1.4596 ± 0.076 | 1.361 ± 0.046 | 1.442 ± 0.035 | |
| RMSE | 0.0586 | 0.0421 | 0.0350 | 0.0418 | 0.0418 | |
| χ2 | 0.0037 | 0.0019 | 0.0013 | 0.0019 | 0.0019 | |
| adj R2 | 0.9801 | 0.9804 | 0.9881 | 0.9810 | 0.9860 | |
| Newton | Equation | MR = exp(− kt) | ||||
| k | 3.2 × 10⁻³ ± 7.6 × 10⁻⁴ | 7.4 × 10⁻³ ± 4 × 10⁻⁴ | 1.18 × 10⁻² ± 4 × 10⁻⁴ | 1.71 × 10⁻² ± 9.86 × 10⁻³ | 1.2 × 10⁻² ± 8.7 × 10⁻³ | |
| RMSE | 0.0649 | 0.0491 | 0.0545 | 0.0496 | 0.0496 | |
| χ2 | 0.0046 | 0.0025 | 0.0008 | 0.0027 | 0.0027 | |
| adj R2 | 0.8353 | 0.9172 | 0.9266 | 0.8304 | 0.9290 | |
| Exponential two-terms | Equation | MR = a exp(− kt) + (1 − a) exp(− kat) | ||||
| a | 1.959 ± 0.019 | 1.948 ± 0.015 | 1.996 ± 0.029 | 1.978 ± 0.033 | 1.9843 ± 0.062 | |
| k | 3.23 × 10⁻³ ± 0.00 | 6.8 × 10⁻³ ± 0.00 | 8.26 × 10⁻³ ± 0.00 | 1.38 × 10⁻² ± 0.00 | 1.7 × 10⁻² ± 0.00 | |
| RMSE | 0.0418 | 0.0341 | 0.0309 | 0.0310 | 0.0310 | |
| χ2 | 0.0019 | 0.0012 | 0.0010 | 0.0010 | 0.0010 | |
| adj R2 | 0.9883 | 0.9908 | 0.9924 | 0.9914 | 0.9915 | |
| Modified page | Equation | MR = exp[− (kt)n] | ||||
| k | 2.2 × 10⁻³ ± 0.00 | 4.8–3 ± 0.00 | 7.4–3 ± 0.00 | 9.11 × 10⁻³ ± 0.00 | 1.13 × 10⁻² ± 0.00 | |
| n | 1.298 ± 0.028 | 1.3782 ± 0.013 | 1.459 ± 0.076 | 1.335 ± 0.023 | 1.4420 ± 0.035 | |
| RMSE | 0.0586 | 0.0421 | 0.0411 | 0.0418 | 0.0418 | |
| χ2 | 0.0037 | 0.0019 | 0.0018 | 0.0019 | 0.0019 | |
| adj R2 | 0.9801 | 0.9804 | 0.9881 | 0.9810 | 0.9860 | |
Proximate composition and sugars
The official methods of the Association of Official Analytical Chemists (AOAC 2006) were used to determine moisture, fat, ash, crude protein, and crude fiber contents of papaya samples. The water activity was determined at 25 °C using a dew point aw meter (AquaLab 4 TE, Pullman WA, USA).
The determination of individual sugars (glucose, fructose, and sucrose) was performed according to the method described by Djendoubi-Mrad et al. (2012). The supernatant was filtered through a 0.45 µm pore size membrane filter before injection. A HPLC system (Flexar LC model; Perkin Elmer, Shelton, Washington, USA) equipped with a Flexar binary LC pump system, a refractive index detector, a Flexar LC autosampler and column oven were used. Sugars were analyzed on a Phenomenex Luna NH2 100A, 5 µm (25 cm × 4.6 mm) column and kept at 25 °C. The used analytical conditions were as follows: a mobile phase was acetonitrile:water (82.5:17.5), a flow 1 mL/min and an isocratic elution. All measurements were performed in triplicate.
Accelerated solvent extraction (ASE) procedure
A Dionex™ ASE™ 150 (Thermo Scientific, Sunnyvale, CA, USA) system was used for the extraction of bioactive compounds from fresh and dried papaya pulp samples. A stainless-steel Dionex cell of 100 mL was filled with a mixture of diatomaceous earth (dispersing agent) and fresh (10 g) or dried (5 g) sample (2:1 w/w), with a cellulose filter (Thermo Scientific) placed at the bottom of the cell. For the extraction cycle, the extraction solvent (Aqueous ethanol 70:30 v/v) under pressure (at 10,342 kPa) filled the cell and then, the heating phase was conducted until setting temperature was reached (120 °C). This step was followed by a static extraction period for 10 min at the set temperature. Later, the same extraction solvent (40% of the cell volume) was used to rinse the cell and a flow of nitrogen (10,342 kPa) to purge the solvent was applied. The extracts obtained were concentrated to dryness in a rotary evaporator at 37 °C (Büchi RE12, Flawil, Switzerland) and then reconstituted to a volume of 5 mL with methanol–formic acid (99:1) for the TPC, TFC determinations, and the DPPH assay; a buffer phosphate pH = 7.0, for the ORAC assay, was used.
Total phenolic content (TPC) determination by the Fast Blue BB (FBBB) reagent
The TPC was determined using the Fast Blue BB (4-benzoylamino-2,5-dimethoxybenzenediazonium chloride hemi-(zinc chloride), FBBB reagent according to Medina (2011) with slight modifications. Concisely, papaya extracts (1.0 mL) were mixed with 0.1 mL of the FBBB reagent (0.1%). After mixing for 1 min, 0.1 mL of a 5% NaOH was added and the solution was incubated for 90 min at room temperature. The absorbance was read at 420 nm using a spectrophotometer (Spectronic Instruments, Spectronic 20 Genesys, NY, USA) with a gallic acid calibration curve with concentrations between 10 and 400 μg/mL. The TPC was expressed as mg gallic acid equivalents (GAE) per g D.M.
Total flavonoid content (TFC) determination
The total flavonoid content (TFC) was measured by a colorimetric assay (Dini et al. 2010), using 0.5 mL of papaya extract mixed with 2 mL of deionized H2O and 0.15 mL of a 5% NaNO2. This mix was incubated for 5 min at room temperature, after that0.15 mL of 10% aqueous AlCl3 was added to the reaction and allowed to stand for 6 min at room temperature. Finally, 1 M NaOH (1 mL) was added and the reaction was immediately diluted with 1.2 mL of deionized H2O by mixing thoroughly. The absorbance was measured at 415 nm. Quercitin was used as the standard for the calibration curve. TFC was expressed as mg quercitin equivalents (QE) per g D.M.
Vitamin C measurement
One gram of fresh fruit or 0.25 g dried fruit was dissolved in 15 mL of 5% metaphosphoric acid solution and gently agitated for 20 min at room temperature, then centrifuged at 4193 × g for 15 min at 10 °C and microfiltered before injection. A HPLC system (Santa Clara, Agilent 1200 series, CA, USA) equipped with a diode array detector (DAD) was used. Vitamin C was analyzed on a Zorbax Eclipse XDB-C18, 4.6 × 150 mm, 5 μm reversed-phase column, with temperature set at 20 °C and the detection wavelength to 254 nm. The analytical conditions used were: mobile phase 5 mM cetyltrimethylammonium bromide (ion-pairing reagent) and 50 mM potassium dihydrogen phosphate (buffer at pH 3.9) filtered by a 0.22 μm filter, flow 0.7 mL/min and an isocratic elution. A calibration curve was prepared using 5% metaphosphoric acid. Vitamin C was determined after 120 min of dehydroascorbic acid (DHA) reduction with DTT (1,4-dithiothreitol) phosphine hydrochloride. All measurements were performed in triplicate.
Antioxidant capacity measurements
2,2-Diphenyl-1-picryl-hydrazyl (DPPH) assay
The DPPH assay was conducted according to Grajeda-Iglesias et al. (2016) with some modifications. In a polystyrene 96-well microplate, 20 μL of papaya extract were added to 180 μL of DPPH solution (120 μM in methanol–formic acid, 99:1 v/v) and incubated for 210 min at room temperature in a Victor3 Multilabel Plate Reader (Perkin–Elmer, Turku, Finland). The absorbance was read at 517 nm. Trolox was used as the standard for the calibration curve (range 1–500 μM Trolox). The results were expressed as μmol Trolox equivalents (TE) per g D.M.
Oxygen radical absorption capacity (ORAC) assay
The peroxyl radical scavenging activity was determined following Zhang et al. (2010). A 100 mM fluorescein (3,6-dihydroxyfluoran) solution in phosphate buffer (75 mM, pH 7.0) was prepared on the day of the experiment and kept at 4 °C until use. Measurements were performed in microtiter plates by adding a mixture of 200 μL of 100 nM fluorescein and 40 μL of the diluted stock solution (extracts) in each well, phosphate buffer pH 7.0 was used as blank. Reaction begins by adding 35 μL of the initiator radical 2.2′-azobis (2-amidinopropane) dihydrochloride (AAPH) and measuring the fluorescein decay (λex = 485 nm and λem = 535 nm) incubating the microtiter plate at 37 °C with shaking for 20 min. The results were expressed as μmol Trolox equivalents (TE) per g D.M.
α-Glucosidase activity assay
The α-glucosidase activity assay was determined in a Multilabel Plate Reader (Perkin–Elmer, VICTOR X3, Hamburg, Germany) as previously described by Vega-Gálvez et al. (2019). The activity (%) against α-glucosidase was plotted against sample concentration, which was tested in the range of 0–2.0 g/mL. An exponential model was used to fit data so that IC50 was calculated as the concentration of papaya extract required to produce a 50% inhibition against α-glucosidase. The same evaluation was done to acarbose solutions, with increasing concentration in the range of 0.02–1.0 mg/mL, as a standard indicator for rating the efficacy of papaya samples in inhibiting α-glucosidase. The acarbose equivalent was calculated as IC50acarbose/IC50sample (Alongi et al. 2018).
Statistical analysis
ANOVA was performed using the program Statgraphics Centurion XVI (Statistical Graphics Corp., Herdon, USA) at p < 0.05. Least significant difference (LSD) test was used in 95% confidence interval. Regression analysis of the nonlinear least squares in the empirical models was done using SigmaPlot 11.0 (Systat Software Inc. USA) obtaining R2 and the constants of all models. Goodness of fit was calculated according to root mean square error (RMSE) and Chi-square (χ2).
Results and discussion
Analysis of vacuum drying kinetics of papaya pulp
Figure 1 shows the changes in moisture ratio (MR) of papaya pulp as affected by different temperatures during vacuum drying. To reach a MR of less than 0.011, the drying times for the dried samples at 40, 50, 60, 70, and 80 °C were 17.5 h, 10.2 h, 7.7 h, 6.0 h, and 5.0 h, respectively (Fig. 1). Similar results were also found by Vega-Gálvez et al. (2019), who reported that the drying time of vacuum-dried papaya slices (at 70 °C and 15 kPa) was 8 h. da Silva Junior et al. (2018) reported that to obtain papayas with a moisture content of 16% (wet basis) is necessary about 5 h at 60 °C and 20–30 kPa. Chandra et al. (2020) informed a 7.6% moisture content after 380 min (at 60 °C). Variation in drying time might be due to differences in final moisture content that, in the present study, reached 6% (wet basis) at 60 ºC and 15 kPa. On the other hand, our results showed higher drying time compared to the traditional convective drying process. Lemus-Mondaca et al. (2009) studied the drying process of papaya slices using convective drying at 40, 50, 60, 70, and 80 °C, indicated that the drying time varied from 4.2 to 11.0 h. This may be explained by the fact that when loads with high moisture content are being dried in a vacuum oven, there is a possibility during prolonged operation that the pump output decreases by condensation forming in the pump heads.
Fig. 1.
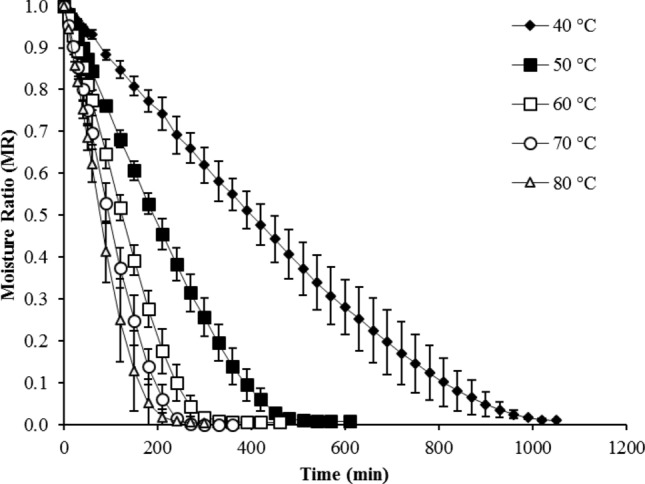
Experimental vacuum drying curves of Vasconcellea pubescens at different drying temperatures. Values are averages (n = 3), error bars are standard deviation
Analyzing the drying curves, MR values of papaya pulp decreased with increasing drying times and this decrease occurred exponentially (Fig. 1). It has been reported in several works on papaya drying that the MR value decreases exponentially with increased drying times (Lemus-Mondaca et al. 2009; da Silva Junior et al. 2018; Vega-Gálvez et al. 2019).
Modeling drying kinetics
Table 1 presents the obtained constants, RMSE, χ2 and adjusted R2 values by applying the seven different models to the experimental drying data of vacuum-dried papaya pulp at 40, 50, 60, 70, and 80 °C. Although all drying models used in the current work exhibited a good fit, the Midilli–Kucuk model (MR = a exp(− ktn) + bt) exhibited the best fit for the obtained drying data (MR against drying time), since this model presented the highest R2 and the lowest χ2 and RMSE values (Table 1). Therefore, this model is suited to estimate the evolution of the moisture content of papaya pulp under the studied vacuum conditions. It has been reported that the Midilli–Kucuk model is the most suitable model for thin-layer drying processes in various food products (Kucuk et al. 2014). For example, the Midilli–Kucuk model presented a successful prediction for the drying of mangoes in a convectional dryer at 40, 50 and 60 °C (Marcel et al. 2014). Moreover, in agreement with our findings, the studies aforementioned also reported an increase of K parameter of the model (Table 1), which may be related to the decrease in the external resistance to water transfer due to the temperature rise (Ocoró-Zamora and Ayala-Aponte, 2013).
Kucuk et al. (2014) reported the Page model as the second-best to predict drying data after the Midilli–Kucuk model to predict the drying data of various products. Hawlader et al. (2006) used only Page model to predict the empirical results of papaya, whereas Lemus-Mondaca et al. (2009) used five models: Newton, Henderson–Pabis, Wang–Singh, Logarithmic, Page and, Modified Page, being the last two that presenting the best fit.
Proximate composition and sugars identification of fresh and dried papaya pulp.
Fresh Chilean papaya pulp composition is presented in Table 2. As a highly perishable fruit, the main component was water (> 90% of the pulp); moreover, a water activity value of over 0.98 also indicates that a high deterioration rate is expected. Chilean papaya composition (express as g per 100 g of fresh weight) presented low fat, ash, and crude protein but a higher content of crude fiber (0.2, 0.56, 0.70, and 1.86 g/100 g FW, respectively). These values are in agreement with previous results for papaya (Tripathi et al. 2011; Nwofia et al. 2012). Not many references were found for the characterization of fresh pulp of Chilean papaya. Instead, most published articles refer to tropical papaya, and results presented are highly variable. Uribe et al. (2015) and Vega-Gálvez et al. (2019) informed similar composition for V. pubescens, except for lower values of crude fiber (1.1 and 0.85 g/100 g FW, respectively). Zura et al. (2013) also reported similar results in V. pubescens for ash, but lower values for fat, crude protein, and crude fiber. These differences could be associated with different maturity stages or different environmental conditions before harvest, which usually affects fruit composition.
Table 2.
Proximate composition and sugars quantification of fresh and dried papaya pulp at different temperatures
| Parameters | Drying temperatures (°C) | |||||
|---|---|---|---|---|---|---|
| Fresh | 40 | 50 | 60 | 70 | 80 | |
| Proximate (g/100 g D.M.) | ||||||
| 1Moisture | 92.72 ± 0.09a | 9.63 ± 0.06b | 7.32 ± 0.05c | 6.11 ± 0.03d | 5.21 ± 0.28e | 4.38 ± 0.06f |
| Fat | 2.74 ± 0.23a | 1.03 ± 0.04 cd | 1.23 ± 0.11c | 1.19 ± 0.08 cd | 1.00 ± 0.06d | 1.70 ± 0.13b |
| Ash | 7.76 ± 0.22d | 8.03 ± 0.10d | 8.55 ± 0.32bc | 9.16 ± 0.28a | 9.01 ± 0.32ab | 8.15 ± 0.28 cd |
| Crude protein | 9.56 ± 0.17d | 16.51 ± 0.39a | 15.11 ± 1.30b | 13.81 ± 0.75c | 13.41 ± 0.33c | 13.10 ± 0.09c |
| Crude fiber | 25.56 ± 2.37a | 12.25 ± 0.64b | 10.92 ± 0.42bc | 11.25 ± 0.42bc | 8.86 ± 0.49d | 10.23 ± 0.42 cd |
| 2Water activity | 0.989 ± 0.000a | 0.424 ± 0.002b | 0.346 ± 0.008c | 0.290 ± 0.006e | 0.283 ± 0.012e | 0.322 ± 0.006d |
| Sugars (mg/g D.M.) | ||||||
| Fructose | 14.14 ± 0.98c | 53.74 ± 2.79b | 62.42 ± 5.78a | 66.70 ± 1.08a | 51.61 ± 1.78b | 54.12 ± 1.07b |
| Glucose | 40.00 ± 3.09e | 131.00 ± 7.39c | 160.71 ± 5.69b | 169.80 ± 2.71a | 117.97 ± 4.49d | 122.05 ± 2.82d |
Values are expressed as means ± standard deviation of triplicates. Values with different letters in the same row are significantly different (p < 0.05). 1Expressed as g/100 g; 2Dimensionless
Both, equilibrium moisture content and water activity were strongly affected by temperature during the drying process. Moisture content was lower for higher temperatures, being the lowest value found for 80 °C dried samples (with 54% reduction compared to sample at 40 °C), while water activity was lower for samples at 60 and 70 °C, with a 45% reduction compared to samples at 40 °C. Nonetheless, this decrease in water activity (< 0.6) represents an increment in the stability and durability of the pulp compared to the fresh pulp (Vega-Gálvez et al. 2019).
The fat and crude fiber contents were lower in dried samples respect to fresh pulp, while ash and crude protein content were higher. The fat content in samples dried at 80 °C presented a 62% retention respect to the fresh one, being the highest value among dried samples. Crude fiber content, on the other hand, was higher for lower temperature samples, presenting an average of 50% retention for 40, 50, and 60 °C, respect to the fresh pulp. Most reductions in these parameters during drying can be explained by leaking or volatilization (Vega-Gálvez et al. 2019). In contrast, the ash content was increased in dried samples, especially at 60 °C which showed an increase of 17% respect to fresh pulp, perhaps by a concentration factor (Abrol et al. 2014). A more significant increment was found for crude protein content at lower temperature dried samples, with an increment of 72% for samples dried at 40, 50, and 60 °C compared to fresh papaya pulp, which indicates that Nitrogen-compounds are not affected during drying (Vega-Gálvez et al. 2019).
The loss of moisture and the concentration effect resulted in an increase in sugar content of dried pulp for all temperatures evaluated, both fructose and glucose contents increased more than three times compared to the fresh pulp, but maintained the same Glucose/Fructose ratio than the fresh pulp. This could be due to the transformation of complex sugars into simple sugars in addition to the concentration effect (Abrol et al. 2014). It could also be associated with the degradation of more complex carbohydrates during drying, such as starch, pectins, or other polysaccharides, which would result in the increase of simple sugars (Wang et al. 2019).
Antioxidant capacity and bioactive compound content of fresh and dried papaya pulp
A new methodology was employed to extract bioactive compounds in fresh and dried papaya pulp samples: the accelerated solvent extraction (ASE). Traditionally extraction of bioactive compounds is performed by the conventional solid/liquid extraction at atmospheric pressures or with combined methodologies such as hydrostatic pressure or ultrasound (Uribe et al. 2015). ASE methodology is presented as an alternative which increase the solubility of bioactive compounds, by increasing solvent diffusion and mass transfer by reducing viscosity and surface tension (Hossain et al. 2011). In the present study, the bioactive compound quantification and antioxidant capacity by DPPH and ORAC were determined in the ASE extracts for fresh and dried samples. The results are shown in Table 3.
Table 3.
Total phenolic content (TPC), total flavonoid content (TFC), vitamin C content and antioxidant capacity (DPPH and ORAC) of the fresh papaya pulp and pulp subjected to vacuum drying at different temperatures
| Parameters | Drying temperatures (°C) | |||||
|---|---|---|---|---|---|---|
| Fresh | 40 | 50 | 60 | 70 | 80 | |
| Bioactive compounds | ||||||
| 1TPC, (mg GAE/g D.M.) | 16.50 ± 0.91d | 27.50 ± 1.10b | 26.54 ± 1.90bc | 24.08 ± 0.46c | 28.94 ± 1.86b | 43.12 ± 3.71a |
| 2TFC, (mg QE/g D.M.) | 3.19 ± 0.11b | 2.82 ± 0.15d | 2.95 ± 0.13 cd | 3.18 ± 0.13b | 3.16 ± 0.07bc | 3.68 ± 0.16a |
| Vitamin C (mg/g D.M.) | 6.05 ± 0.05b | 5.29 ± 0.31c | 6.69 ± 0.21a | 6.12 ± 0.42b | 5.04 ± 0.07c | 4.42 ± 0.04d |
| 3Antioxidant activity (µmol TE/g D.M.) | ||||||
| DPPH (30 min) | 7.58 ± 0.72d | 20.05 ± 0.10a | 19.95 ± 2.32a | 17.58 ± 0.98bc | 15.68 ± 0.40bc | 15.04 ± 1.47c |
| DPPH (60 min) | 5.88 ± 0.10d | 23.14 ± 0.39a | 21.99 ± 1.27a | 20.18 ± 0.88bc | 18.53 ± 0.72bc | 18.08 ± 1.73c |
| DPPH (90 min) | 12.91 ± 1.30e | 25.72 ± 0.90a | 23.51 ± 0.33bc | 22.27 ± 0.60bc | 20.73 ± 1.12 cd | 20.42 ± 1.65d |
| DPPH (120 min) | 17.13 ± 0.41d | 28.42 ± 1.83ab | 27.00 ± 0.81ab | 25.75 ± 1.26bc | 24.62 ± 1.69bc | 25.18 ± 0.90c |
| ORAC | 72.88 ± 7.40a | 4.07 ± 0.17c | 9.50 ± 0.87bc | 7.78 ± 0.70bc | 12.23 ± 0.89b | 9.98 ± 0.61b |
1Gallic acid equivalents (GAE); 2 Quercetin equivalents (QE); 3 Trolox equivalents (TE). Values are expressed as means ± standard deviation of replicated three times. Values with different letters in the same row are significantly different (p < 0.05)
The Total Phenolic Content (TPC) was similar to results presented by Uribe et al. (2015) in fresh pulp but slightly higher than those of Vega-Gálvez et al. (2019) and Chandra et al. (2020). An increment of the total phenolic content was observed for all dried samples, regardless of the temperature evaluated. An increase of 63% was found for lower temperatures (40 and 50 °C) compared to fresh papaya pulp. This increase may be because a higher temperature causes a greater diffusion of the compounds present in the skin into the pulp due to the cellular damage in the skin (Martín-Gómez et al. 2020). Total flavonoid content was 3.19 µmol TE/g DM, and it was in agreement with Vega-Gálvez et al. (2019) for V. pubescens. Drying process produced only a slight reduction of flavonoid content for lower temperatures (40 and 50 °C), while an increment of 15% was found for samples dried at 80 °C compared to the fresh pulp. Several mechanisms that affect the concentration of phenolic compounds can occur during the drying process, such as denaturalization of proteins of disassociation from complex carbohydrates and the release of bound phenolic compounds, leading to the release of phenolic derivatives and thermal degradation (Martín-Gómez et al. 2020).
Results for Vitamin C content are varied, and it could be explained by the high variability of this parameter due to botanical or physiological factors that could influence on it, as the maturity of variety (Tripathi et al. 2011). Like most fruits, papaya is a good source of vitamin C. Fresh pulp of papaya presented 6.05 mg/g DM and it was in agreement with Abrol et al. (2014) and Nwofia et al. (2012) for papaya, but this value was rather lower or it was slightly low than the value informed for Vega-Gálvez et al. (2019). Vitamin C decreased after vacuum drying at 40, 70, and 80 °C (a reduction of 27% at 80 °C), but it did not occur at 50 or 60 °C. Vitamin C is a very heat-sensitive compound and is often referenced as an indicator of good processing practices; however, the thermal damage suffered by a product during drying is also directly proportional to the processing time (da Silva Junior et al. 2018). Therefore, when the papaya is dried at 40 °C required more time of processing, as a result obtained a greater degradation of this nutrient. However, the slight increase of vitamin C at 50 y 60 °C represent a good technological characteristic, since most drying processes are known for degrading vitamin C (Abrol et al. 2014; Vega-Gálvez et al. 2019).
The determination of antioxidant capacity by DPPH was performed as a kinetic assay, where measurements at continuous intervals were done to evaluate how much time is needed to consume the radical (Table 3). It was observed that the longer contact time between the reagents, the higher values of antioxidant capacity were obtained, but it was more noticeable in fresh pulp samples. A 120 min reaction produced an antioxidant capacity of the fresh pulp of 2.2 times higher than with only 30 min reaction These differences were less significant among dried samples, where increasing contact time did not have the same impact (between 35 and 53% of increment). The results, at 120 min, are in agreement with those reported by Uribe et al. (2015) for fresh pulp.
Observing the dried samples, it was found a significant increase of antioxidant activity when compared to the fresh pulp, but only with the DPPH assay, while an important decrease was observed in dried samples by ORAC assay. Similar values were found by DPPH assay in all dried samples for each temperature studied, being the best option at 40 °C (an increment of 65% for 120 min of reaction when compared to the fresh pulp). Abrol et al. (2014) also informed an increase in antioxidant activity of dried samples, compared to fresh samples on papaya (increases of 59 and 73% for fresh and dried samples, respectively). Nevertheless, different results were found for antioxidant capacity by ORAC assay, when a significant reduction was found for all dried samples and the best options were at higher temperatures, with a mean value of 9.87 µmol TE/g DM for samples dried at 50, 60, 70 and 80 °C. Vega-Gálvez et al. (2019) reported similar value for V. pubescens fresh pulp, but an increase in dried samples (55.20 to 107 μmol TE/g D.M) was obtained.
α-Glucosidase activity on fresh and dried papaya pulp
The enzyme α-glucosidase is associated with digestion and breakdown of carbohydrates, so its inhibition would be beneficial for the regulation of Type II diabetes, by delaying glucose absorption and preventing postprandial blood glucose level elevation (Gironés-Vilaplana et al. 2014). Here, fresh and dried papaya pulp was evaluated as a potential inhibitor of α-glucosidase. As shown in Fig. 2, all papaya extracts affected the α-glucosidase activity in a concentration-dependent manner. Nevertheless, our results showed a higher effect on the enzyme activity of the dried papaya extracts than the fresh ones. In fact, it is necessary until four times more fresh papaya extract (2.0 g/mL) than dried papaya ones (0.5 g/mL) to completely suppress the enzyme activity, which would demonstrate the higher efficacy of the extracts of dried papaya versus fresh ones as inhibitors of α-glucosidase. This trend was consistent with the study of Vega-Gálvez et al. (2019) in Chilean papaya dehydrated by different methods. Additionally, the half-maximal inhibitory concentration (IC50) of papaya extracts was compared to IC50 of acarbose (as a positive control), and results are presented in Table 4. Results revealed that acarbose was more effective in inhibiting α-glucosidase than papaya extracts with IC50 value of 0.05 mg/mL. Consistently with Fig. 2, the fresh extract had the lowest inhibitory effect with IC50 value of 111 mg/mL, whereas no significant differences in the α-glucosidase inhibitory activity among dried papaya extracts were found (IC50 values ranged from 1.92 to 8.41 mg/mL). Our IC50 values were within the ranges reported in the literature for Carica papaya (Oboh et al. 2013; Gironés-Vilaplana et al. 2014). On the other hand, Table 4 also shows the acarbose equivalents for each enzyme inhibitor. Here, it can be seen, for example, that dried papaya at 80 °C was 38-fold less effective than acarbose in inhibiting the α-glucosidase. However, considering that the maximum suggested daily intake of the acarbose drug is 300 mg/d (Alongi et al. 2018), 11,538 mg/d of dried papaya extract at 80 °C would provide an acarbose like effect. This dose should be increased to 50,847 mg/d, if papaya extract (dried at 50 °C) is ingested, being the latter 168-fold less effective than acarbose in inhibiting the α-glucosidase. The greatest effectiveness of the papaya (dried 80 °C) extract versus the other extracts could be attributed to the significant increase of TPC and TFC in the sample (Table 3). The contribution of some individual bioactive compounds present in papaya has been reported to play an important role against α-glucosidase inhibition (Oboh et al. 2013; Arouma et al. 2014; Gironés-Vilaplana et al. 2014; Vega-Gálvez et al. 2019). Nonetheless, in vivo studies involving papaya as a major component of the intake are required to support those statements.
Fig. 2.
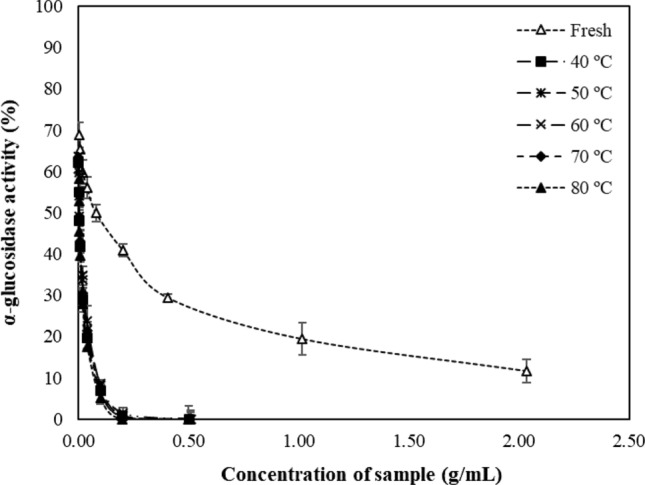
α-glucosidase activity of fresh papaya pulp and subjected to vacuum drying at different temperatures. Values are averages (n = 3), error bars are standard deviation
Table 4.
IC 50 (half-maximal inhibitory concentration) values and acarbose equivalents of fresh pulp and pulp subjected to vacuum drying at different temperatures
| Inhibitor | IC50 (mg/mL) | Acarbose equivalents (IC50 acarbose/IC50 inhibitor) |
|---|---|---|
| Fresh | 111.2 ± 21.4a | 0.0004 |
| 40 °C | 5.45 ± 1.71b | 0.0092 |
| 50 °C | 8.41 ± 0.15b | 0.0059 |
| 60 °C | 4.01 ± 1.01b | 0.0125 |
| 70 °C | 4.39 ± 0.89b | 0.0114 |
| 80 °C | 1.92 ± 0.02b | 0.0260 |
| Acarbose | 0.05 ± 0.000c | 1.000 |
Values are expressed as means ± standard deviation of replicated three times. Values with different letters in the same column are significantly different (p < 0.05)
Conclusion
Chilean papaya pulp was affected by the different temperatures used during vacuum drying since significant changes were observed in the proximate composition of all dried samples. Water activity (aw) values in all samples were low enough to guarantee the stability of the product. An increase in the content crude proteins and ash was found, while there was a slight reduction in ash content and crude fiber respect to fresh samples. On the other hand, the content of simple sugars increased compared to thr fresh pulp, although the glucose/fructose ratio was maintained. An increase in the antioxidant capacity of the dried pulp was observed, regardless of the temperature used (approximately 50% increase) by DPPH assay, also consistent with the increase in the total phenols content. The content of total flavonoids and vitamin C was maintained in the dried samples if compared to the fresh pulp. Regarding α-glucosidase activity, papaya extracts revealed an inhibitory effect that would allow them to be used as an alternative for the control of type II diabetes, even if more in-vivo studies were needed. Beside, IC50 and acarbose equivalents were found for each sample.
Acknowledgments
The authors gratefully acknowledge the Project FONDECYT 1170601 for providing financial support for the publication of this research.
Author contributions
Antonio Vega-Gálvez: Validation of methodology and data analysis/Funding acquisition/Supervision/Direction. Jacqueline Poblete: Methodology/Data collection and processing/writing/editing. Rodrigo Rojas-Carmona: Methodology/Data collection and processing. Elsa Uribe: Investigation/Methodology/Validation/Supervision. Alexis Pastén: Conceptualization/Data analysis validation/Writing, review and editing. María Gabriela Goñi: Conceptualization/Supervision/Formal Data Analysis and Validation/Visualization/Writting, review and editing.
Funding
The authors gratefully acknowledge the financial support of the Project FONDECYT N° 1170601 of the Comision Nacional de Investigacion Cientıfica y Tecnologica, (CONICYT, Chile).
Compliance with ethical standards
Conflict of interest
The authors declare that there are no conflicts of interest.
Ethics approval
No ethical concerns are applied to the present study.
Consent to participate
By the present statement, as corresponding author, I here declare that all participant authors agree to the present manuscript in its present form and to its content, and to be published in the Journal of Food Science and Technology.
Footnotes
Publisher's Note
Springer Nature remains neutral with regard to jurisdictional claims in published maps and institutional affiliations.
References
- Abrol GS, Vaidya D, Sharma A, Sharma S. Effect of solar drying on physico-chemical and antioxidant properties of mango, banana and papaya. Natl Acad Sci Lett. 2014;37:51–57. doi: 10.1007/s40009-013-0196-1. [DOI] [Google Scholar]
- Alongi M, Verardo G, Gorassini A, Anese M. Effect of pasteurization on in vitro α-glucosidase inhibitory activity of apple juice. LWT Food Sci Technol. 2018;98:366–371. doi: 10.1016/j.lwt.2018.08.065. [DOI] [Google Scholar]
- Arouma OI, Somanah J, Bourdon E, Rondeau P, Bahirun T. Diabetes as a risk factor to cancer: functional role of fermented papaya preparation as phytonutraceutical adjunct in the treatment of diabetes and cancer. Mutat Res. 2014;768:60–68. doi: 10.1016/j.mrfmmm.2014.04.007. [DOI] [PubMed] [Google Scholar]
- Briones-Labarca V, Plaza-Morales M, Giovagnoli-Vicuña C, Jamett F. High hydrostatic pressure and ultrasound extractions of antioxidant compounds, sulforaphane and fatty acids from Chilean papaya (Vasconcellea pubescens) seeds: effects of extraction conditions and methods. LWT Food Sci Technol. 2015;60:525–534. doi: 10.1016/j.lwt.2014.07.057.p. [DOI] [Google Scholar]
- Chandra A, Kumar S, Tarafdar A, Nema PK. Ultrasonic and osmotic pretreatments followed by convective and vacuum drying of papaya slices. J Sci Food Agric. 2020 doi: 10.1002/jsfa.10847. [DOI] [PubMed] [Google Scholar]
- da Silva EV, Jr, Lins de Melo L, Batista de Medeiros RA, Pimienra-Barros ZM, Moreira-Azoubel P. Influence of ultrasound and vacuum assisted drying on papaya quality parameters. LWT Food Sci Technol. 2018;97:317–322. doi: 10.1016/j.lwt.2018.07.017. [DOI] [Google Scholar]
- Dini I, Tenore GC, Dini A. Antioxidant compound contents and antioxidant activity before and after cooking in sweet and bitter Chenopodium quinoa seeds. LWT Food Sci Technol. 2010;43:447–451. doi: 10.1016/j.lwt.2009.09.010. [DOI] [Google Scholar]
- Djendoubi-Mrad N, Bonazzi C, Boudhrioua N, Kechaou N, Courtois F. Influence of sugar composition on water sorption isotherms and on glass transition in apricots. J Food Eng. 2012;111:403–411. doi: 10.1016/j.jfoodeng.2012.02.001. [DOI] [Google Scholar]
- Gaete-Eastman C, Figueroa CR, Balbontín C, Moya M, Atkinson RG, Herrera R, Moya-León MA. Expression of an ethylene-related expansin gene during softening of mountain papaya fruit (Vasconcellea pubescens) Postharvest Biol Technol. 2009;53:58–65. doi: 10.1016/j.postharvbio.2009.03.007. [DOI] [Google Scholar]
- Gayosso-García Sancho LE, Yahia EM, González-Aguilar GA. Identification and quantification of phenols, carotenoids, and vitamin C from papaya (Carica papaya L., cv. Maradol) fruit determined by HPLC-DAD-MS/Ms-ESI. Food Res Int. 2011;44:1284–1291. doi: 10.1016/j.foodres.2010.12.001. [DOI] [Google Scholar]
- Gironés-Vilaplana A, Baenas N, Villaño D, Speisky H, García-Viguera C, Moreno DA. Evaluation of Latin-American fruits rich in phytochemicals with biological effects. J Funct Foods. 2014;7:599–608. doi: 10.1016/j.jff.2013.12.025. [DOI] [Google Scholar]
- Grajeda-Iglesias C, Salas E, Barouh N, Baréa B, Panya A, Figueroa-Espinoza MC. Antioxidant activity of protocatechuates evaluated by DPPH, ORAC, and CAT methods. Food Chem. 2016;194:749–757. doi: 10.1016/j.foodchem.2015.07.119. [DOI] [PubMed] [Google Scholar]
- Hawlader MNA, Perera CO, Tian M, Yeo KL. Drying of Guava and Papaya: impact of different drying methods. Drying Technol. 2006;24:77–87. doi: 10.1080/07373930500538725. [DOI] [Google Scholar]
- Hossain MB, Barry-Ryan C, Martin-Diana AB, Brunton NP. Optimisation of accelerated solvent extraction of antioxidant compounds from rosemary (Rosmarinus officinalis L.), marjoram (Origanum majorana L.) and oregano (Origanum vulgare L.) using response surface methodology. Food Chem. 2011;126:339–346. doi: 10.1016/j.foodchem.2010.10.076. [DOI] [Google Scholar]
- Kayacan S, Sagdic O, Doymaz I. Effects of hot-air and vacuum drying on drying kinetics, bioactive compounds and color of bee pollen. J Food Meas Charact. 2018;12:1274–1283. doi: 10.1007/s11694-018-9741-4. [DOI] [Google Scholar]
- Kucuk H, Midilli A, Kilic A, Dincer I. A review on thin-layer drying-curve equations. Drying Technol. 2014;32:757–773. doi: 10.1080/07373937.2013.873047. [DOI] [Google Scholar]
- Lemus-Mondaca R, Vega-Gálvez A, Zambra CE, Moraga NO. Modeling 3D conjugate heat and mass transfer for turbulent air drying of Chilean papaya in a direct contact dryer. Heat Mass Transf. 2009;53:11–24. doi: 10.1007/s00231-016-1799-0. [DOI] [Google Scholar]
- Marcel E, Balbine M, Alexis K. Mathematical modelling of thin layer mangoes (Mangifera indica L.) drying process. Int J Curr Eng Technol. 2014;4(5):3672–3676. [Google Scholar]
- Martín-Gómez J, Varo MA, Mérida J, Serratosa MP. Influence of drying processes on anthocyanin profiles, total phenolic compounds and antioxidant activities of blueberry (Vaccinium corymbosum) LWT Food Sci Technol. 2020;120:108931. doi: 10.1016/j.lwt.2019.108931. [DOI] [Google Scholar]
- Medina MB. Determination of the total phenolics in juices and superfruits by a novel chemical method. J Funct Foods. 2011;3:79–87. doi: 10.1016/j.jff.2011.02.007. [DOI] [Google Scholar]
- Nieto-Calveche J, Cueto M, Farroni A, Escalada-Pla M, Gerschenson LN. Antioxidant characterization of new dietary fiber concentrates from papaya pulp and peel (Carica papaya L.) J Funct Foods. 2016;27:319–328. doi: 10.1016/j.jff.2016.09.012. [DOI] [Google Scholar]
- Nwofia GE, Ojimelukwe P, Eji C. Chemical composition of leaves, fruit pulp and seeds in some Carica papaya (L.) morphotypes. Int J Aromatic Plants. 2012;2:200–206. [Google Scholar]
- Oboh G, Olabivi A, Akinyemi AJ, Ademiluyi AO. Inhibition of key enzymes linked to type 2 diabetes and sodium nitroprusside-induced lipid peroxidation in rat pancreas by water-extractable phytochemicals from unripe pawpaw fruit (Carica papaya) J Basic Clin Physiol Pharmacol. 2013;25:1–14. doi: 10.1515/jbcpp-2013-0002. [DOI] [PubMed] [Google Scholar]
- Ocoró-Zamora MU, Ayala-Aponte AA. Influence of thickness on the drying of papaya puree (Carica papaya L.) through refractance windows™ technology. Dyna. 2013;80:147–154. [Google Scholar]
- Singh-Sogi D, Siddiq M, Dolan KD. Total phenolics, carotenoids and antioxidant properties of Tommy Atkin mango cubes as affected by drying techniques. LWT Food Sci Technol. 2015;62:564–568. doi: 10.1016/j.lwt.2014.04.015. [DOI] [Google Scholar]
- Spínola V, Pinto J, Castilho P. Identification and quantification of phenolic compounds of selected fruits from Madeira Island by HPLC-DAD–ESI-MSn and screening for their antioxidant activity. Food Chem. 2015;173:14–30. doi: 10.1016/j.foodchem.2014.09.163. [DOI] [PubMed] [Google Scholar]
- Tan S, Wang Z, Xian Y, Deng T, Zhao X, Shi S, Zheng Q, Gao X, Li W. The effects of drying methods on chemical profiles and antioxidant activities of two cultivars of Psidium guajava fruits. LWT Food Sci Technol. 2020;118:1–7. doi: 10.1016/j.lwt.2019.108723. [DOI] [Google Scholar]
- Tello-Ireland C, Lemus-Mondaca R, Vega-Gálvez A, López J, Di Scala K. Influence of hot-air temperature on drying kinetics, functional properties, colour, phycobiliproteins, antioxidant capacity, texture and agar yield of alga Gracilaria chilensis. LWT Food Sci Technol. 2011;44:2112–2118. doi: 10.1016/j.lwt.2011.06.008. [DOI] [Google Scholar]
- Tripathi S, Suzuki JY, Carr JB, McQuate GT, Ferreira SA, Manshardt RM, Pitz KY, Wall MM, Gonsalves D. Nutritional composition of Rainbow papaya, the first commercialized transgenic fruit crop. J Food Compos Anal. 2011;24:140–147. doi: 10.1016/j.jfca.2010.07.003. [DOI] [Google Scholar]
- Uribe E, Delgadillo A, Giovagnoli-Vicuña C, Quispe-Fuentes I, Zura-Bravo L. Extraction techniques for bioactive compounds and antioxidant capacity determination of Chilean Papaya (Vasconcellea pubescens) fruit. J Chem. 2015;2015:1–8. doi: 10.1155/2015/347532. [DOI] [Google Scholar]
- Vega-Gálvez A, Poblete J, Quispe-Fuentes I, Uribe E, Bilbao-Sainz C, Pastén A. Chemical and bioactive characterization of papaya (Vasconcellea pubescens) under different drying technologies: evaluation of antioxidant and antidiabetic potential. J Food Meas Charact. 2019;13:1980–1990. doi: 10.1007/s11694-019-00117-4. [DOI] [Google Scholar]
- Wang Q, Li S, Han X, Ni Y, Zhao D, Hao J. Quality evaluation and drying kinetics of shitake mushrooms dried by hot air, infrared and intermittent microwave—assisted drying methods. LWT Food Sci Technol. 2019;107:236–242. doi: 10.1016/j.lwt.2019.03.020. [DOI] [Google Scholar]
- Zhang L, Li J, Hogan S, Chung H, Welbaum GE, Zhou K. Inhibitory effect of raspberries on starch digestive enzyme and their antioxidant properties and phenolic composition. Food Chem. 2010;119(2):592–599. doi: 10.1016/j.foodchem.2009.06.063. [DOI] [Google Scholar]
- Zura L, Uribe E, Lemus-Mondaca R, Saavedra-Torrico J, Vega-Gálvez A, Di Scala K. Rehydration capacity of Chilean Papaya (Vasconcellea pubescens): effect of process temperature on kinetic parameters and functional properties. Food Bioprocess Technol. 2013;6:844–850. doi: 10.1007/s11947-011-0677-5. [DOI] [Google Scholar]