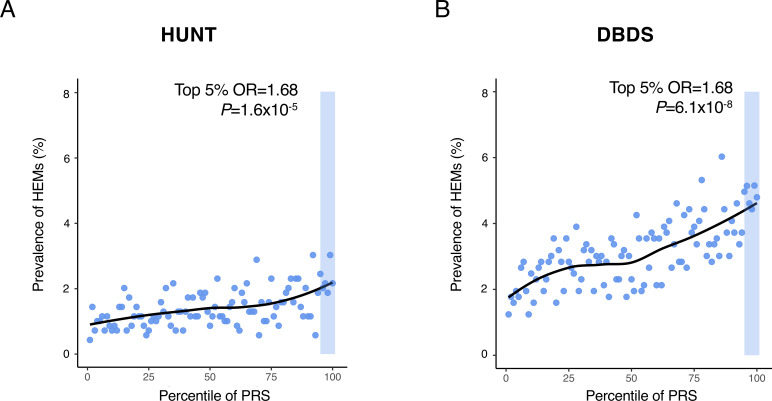
Figure 4.
Risk haemorrhoidal disease (HEM) prevalence across polygenic risk score (PRS) percentile distributions. PRS was derived from the results of the association meta-analysis (see online methods). HEM prevalence (%, Y-axis) is reported on a scatter plot in relation to PRS percentile distribution (X-axis) in the Norwegian Trøndelag Health Study (HUNT) (A) and the Danish Blood Donor Study (DBDS) (B) population cohorts. The top 5% of the distribution is highlighted with a shaded area in both cohorts, and the results of testing HEM prevalence in this group versus the rest of the population are also reported (p value and OR from logistic regression; online methods).

