Abstract
Radiopharmaceuticals that target the translocator protein 18 kDa (TSPO) have been investigated with positron emission tomography (PET) to study neuroinflammation, neurodegeneration and cancer. We have developed the novel, achiral, 2-phenylimidazo[1,2-a]pyridine, PBR316 that targets the translocator protein 18 kDa (TSPO) that addresses some of the limitations inherent in current TSPO ligands; namely specificity in binding, blood brain barrier permeability, metabolism and insensitivity to TSPO binding in subjects as a result of rs6971 polymorphism. PBR316 has high nanomolar affinity (4.7–6.0 nM) for the TSPO, >5000 nM for the central benzodiazepine receptor (CBR) and low sensitivity to rs6971 polymorphism with a low affinity binders (LABs) to high affinity binders (HABs) ratio of 1.5. [18F]PBR316 was prepared in 20 ± 5% radiochemical yield, >99% radiochemical purity and a molar activity of 160–400 GBq μmol−1. Biodistribution in rats showed high uptake of [18F]PBR316 in organs known to express TSPO such as heart (3.9%) and adrenal glands (7.5% ID per g) at 1 h. [18F]PBR316 entered the brain and accumulated in TSPO-expressing regions with an olfactory bulb to brain ratio of 3 at 15 min and 7 at 4 h. Radioactivity was blocked by PK11195 and Ro 5-4864 but not Flumazenil. Metabolite analysis showed that radioactivity in adrenal glands and the brain was predominantly due to the intact radiotracer. PET–CT studies in mouse-bearing prostate tumour xenografts indicated biodistribution similar to rats with radioactivity in the tumour increasing with time. [18F]PBR316 shows in vitro binding that is insensitive to human polymorphism and has specific and selective in vivo binding to the TSPO. [18F]PBR316 is suitable for further biological and clinical studies.
PBR316 has high brain uptake, biodistribution consistent with TSPO expression and is insensitive to rs6971 polymorphism with a LAB:HAB ratio of 1.5. It can be prepared in >99% radiochemical purity, 160–400 GBq μmol−1 and >98.5% stability after 4 h.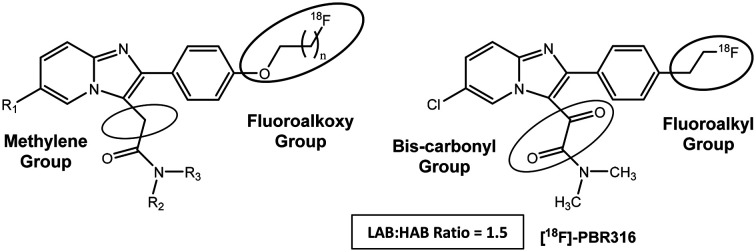
Introduction
A variety of positron emission tomography (PET) radiopharmaceuticals have been developed to image the translocator protein (TSPO) in the neurosciences and cancer.1–6 Since [11C]PK11195, there have been numerous second and third generation PET radiopharmaceuticals developed to target the TSPO which include a diverse range of chemical structures seen with [11C]DAA1106,7 [18F]FEDAA1106,8 [11C]PBR28,9 [18F]PBR06,10 [11C]SSR180575,11 [18F]PBR111,12 [18F]DPA714 13 and [18F]GE-180.14 However, none of these PET radiopharmaceuticals, including [11C]PK11195, are regarded as the optimal radioligand for the TSPO due to varying degrees of non-specific binding, poor in vivo pharmacokinetics or low blood–brain-barrier (BBB) permeability.15
Many of these ligands also have unfavourable in vivo metabolism, including the loss of the radiolabel or the formation of radiometabolites which enter the brain and compete with the parent radiopharmaceutical, resulting in non-specific uptake that then complicates imaging interpretation and analysis. These limitations are further confounded by observations that [11C]PBR28 and other more recently developed TSPO radiopharmaceuticals show variable uptake in different subjects on PET imaging studies.16,17 This uptake was later attributed to differences in binding affinity to the TSPO as a result of polymorphism in the rs6971 gene which encodes the TSPO.18–20 The polymorphism results from a substitution of alanine for threonine at position 147 (A147T).21,22 Therefore, three distinct human subject-subgroups classified as high-affinity binders (HAB), low-affinity binders (LAB) and mixed-affinity binders (MAB) were identified by Owen et al.16 Although [11C]PK11195 has low brain uptake, a component of non-specific binding and poor signal to noise ratio,15 it has a LAB to HAB ratio of approximately 1.18 Hence, PET radiopharmaceuticals with binding that is insensitive to human single nucleotide polymorphism of rs6971, would be ideal as it would avoid the need for genotyping and exclusion of LAB subjects in PET imaging studies. To date, three PK11195 analogues, the quinazoline [11C]-ER176 (HAB:LAB 1.3),23 the quinoline [18F]-LW223 (LAB:HAB 1.0)24 and the pyridinyl isoquinoline (R)-[18F]-NEBIFQUINIDE (HAB:LAB 0.93)25 have all shown insensitivity to rs6971 genetic polymorphism. Insensitivity to rs6971 polymorphism was also demonstrated by other TSPO chemical structures including the benzoxazole derivative [18F]-FEBMP (LAB:HAB 0.9)26 and the tricyclic indole derivative (R,S)-[18F]-GE387 (LAB:HAB 1.2–1.3).27 Many of these molecules are currently under investigation.
We previously reported two imidazopyridine-based TSPO PET radiopharmaceuticals, PBR111 and PBR102 (Fig. 1) that bind selectively to the TSPO and displayed good pharmacokinetics, but had poor metabolism due to defluorination of the fluoropropoxy group of PBR111 and oxidative cleavage of the fluoroethoxy group in PBR102, resulting in bone (PBR111) and brain uptake (PBR102).12,28,29 Importantly, the imidazopyridine structure inherent in [18F]PBR111 gave a HAB to LAB ratio of 4.0; which is one of the lowest ratios, for second generation TSPO ligands reported in the literature.20
Fig. 1. Chemical structure of imidazopyridine-based TSPO ligands – [18F]PBR111 and [18F]PBR102.
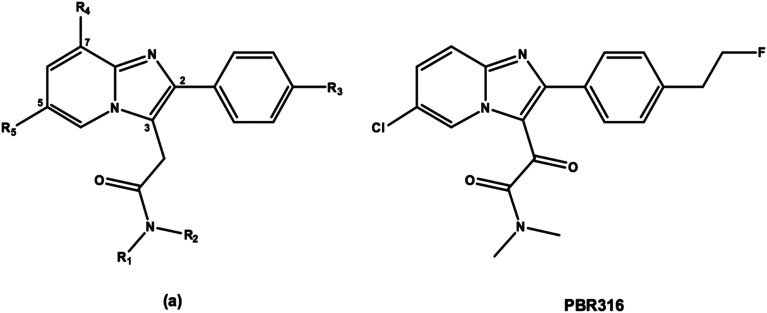
Hence, our objective was to develop a fluorine-18 labelled radiopharmaceutical based on the imidazopyridine structure with a LAB to HAB ratio close to 1 that remained selective for the TSPO when compared to the central benzodiazepine receptor (CBR) and had pharmacokinetic and metabolic properties to enable accurate quantification and image analysis. We made modifications to the 2-phenyl-imidazopyridine structure (a) (Fig. 2) by replacing the methylene group of the 3-acetamide side chain with a second carbonyl group and replaced the N,N′-diethyl group (R1 and R2) with an N,N′-dimethyl analogue. The fluoroalkoxy substituent (R3) present on the 2-phenyl ring of [18F]PBR111 and [18F]PBR102 (Fig. 1) was also replaced with a fluoroethyl group in an attempt to modify the metabolism of the radiolabelled fragment. We report the synthesis of the 2-phenylimidazo[1,2-a]pyridine, 2-(6-chloro-2-(4-(2-fluoroethyl)phenyl)imidazo[1,2-a]pyridin-3-yl)-N,N-dimethyl-2-oxo-acetamide (PBR316), its radiolabelling with fluorine-18 and preclinical biological evaluation.
Fig. 2. General structure of a 2-phenyl imidazopyridine (a) and the oxoacetamide derivative PBR316.
Results and discussion
Chemistry
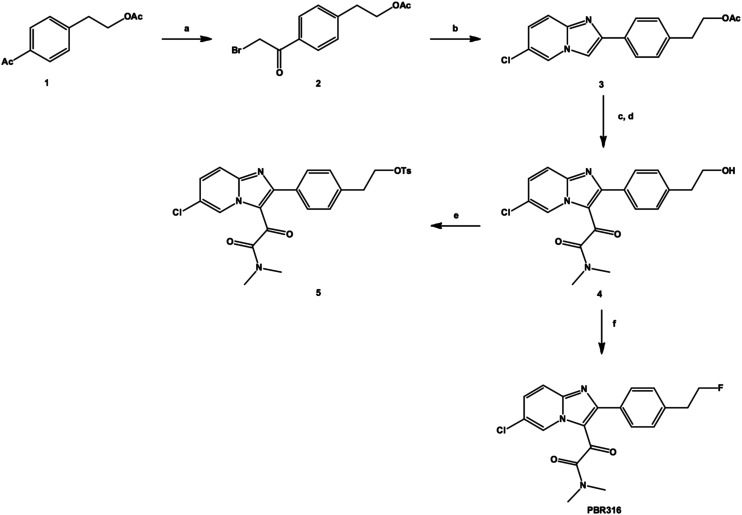
PBR316 and the corresponding tosyl radiolabelling precursor 5 were synthesised according to Scheme 1. Treatment of a solution of 4-acetylphenethyl acetate 1 in ethyl acetate containing a catalytic amount of aluminium chloride with one equivalent of bromine in ethyl acetate at room temperature, gave the corresponding α-bromoacetate derivative 2 in approximately 81% yield as well as the dibromimated analogue in 11% yield. Condensation of the bromoacetate 2 mixture with 2-amino-5-chloropyridine in ethanol gave the corresponding 2-phenyl-6-chloroimidazo[1,2-a]pyridine derivative 3 in 66% yield. The reaction of the imidazopyridine acetate 3 with oxalyl chloride, followed by the addition of dimethylamine, gave the intermediate acetate of the N,N′-dimethyl oxoacetamide derivative, which after hydrolysis with potassium carbonate gave the corresponding alcohol 4. Recrystallisation from methanol:water gave the desired oxoacetamide 4 in 53% yield. Reaction of the oxoacetamide alcohol 4 with perfluoro-1-butanesulfonylfluoride and triethylamine trifluoride gave the fluorinated standard PBR316. Similarly, the tosyl derivative 5, the radiolabelling precursor, was initially prepared by reacting the alcohol 4 with tosyl chloride in the presence of N,N,N′,N′-tetramethylhexanediamine (TMHDA) in acetonitrile in 39% yield. Alternatively, reaction of tosyl chloride and potassium carbonate using the dry, mix and grind method30 gave the tosyl derivative 5 in 53% yield.
Scheme 1. Synthesis of PBR316 and its tosyl precursor 5. a) Br2, AlCl3, ethyl acetate. b) 2-Amino-5-chloropyridine, NaHCO3, EtOH. c) COCl2, DIPEA, CH2Cl2, NH(Me3)2, pyridine. d) K2CO3, MeOH. e) TsCl, TMHDA, or TsCl, K2CO3, dry grind method. f) PFBSF, NEt3·3HF, DIPEA, CH3CN.
Radiochemistry
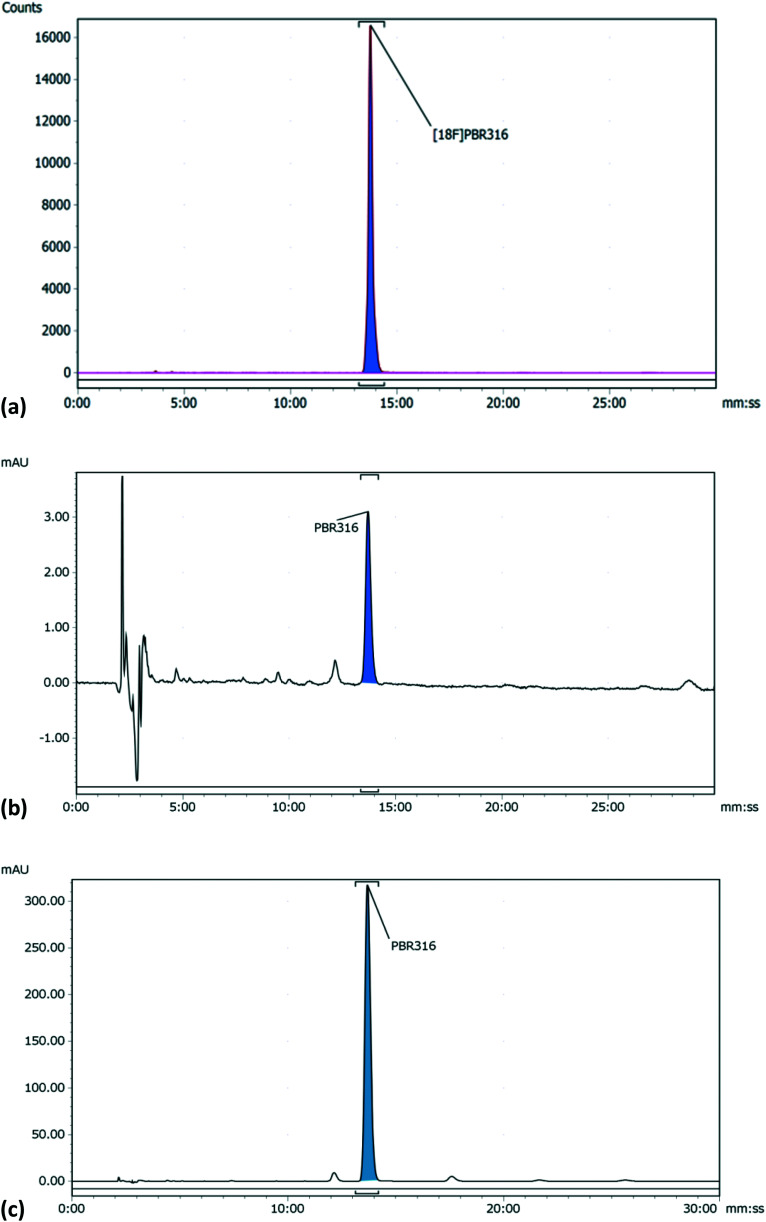
The radiolabelling of PBR316 using the corresponding tosyl precursor 5 was readily achieved by nucleophilic substitution in a single step with [18F]fluoride in the presence of K2CO3 and Kryptofix®2.2.2 in acetonitrile at 100 °C for 5 min (Scheme 2). This synthesis was automated for routine production using the GE TracerLab FXFN synthesis module. The overall radiosynthesis, including [18F]fluorination, HPLC purification, solid phase extraction and radiotracer formulation was completed in 50 min. [18F]PBR316, in activities of 10–20 GBq, were produced in a radiochemical yield of 20 ± 5%, (n = 9) non-decay corrected. The radiochemical purity (>99%) and molar activity up to 400 GBq μmol−1 (Fig. 3) are suitable for biological evaluation and potential clinical translation.
Scheme 2. Radiosynthesis of [18F]PBR316. a) [18F]fluoride, K2CO3, K222, CH3CN.
Fig. 3. HPLC analysis of formulated [18F]PBR316 and PBR316 standard (a) radio-HPLC chromatogram of [18F]PBR316 (b) HPLC UV-chromatogram of [18F]PBR316 (c) HPLC chromatogram of PBR316 standard.
The replacement of the [18F]fluoroalkoxy groups with a [18F]fluoroethyl in PBR316 did not show any adverse stability effects. The [18F]PBR316 radiochemical purity remained >98.5% after 4 h without the use of stabiliser, hence its suitability for biological evaluation.
In vitro evaluation
Data for in vitro evaluation is shown in Table 1. These Ki values represent a 1000 times difference in affinity between the TSPO and the CBR, indicating that PBR316 binds to the TSPO with high affinity and selectivity. Hence, the replacement of the methylene group with a second carbonyl, the N,N′-diethyl with an N,N′-dimethyl group on the 3-acetamide side chain and the fluoropropoxy or fluoroethoxy substituents on the 4′-position of the 2-phenyl ring of PBR111 and PBR102 with a fluoroethyl substituent, retained the high, nanomolar binding affinity and selectivity for the TSPO over the CBR. Interestingly, PBR316 showed a 10-fold higher binding selectivity between the TSPO and CBR when compared to other imidazopyridine ligands such as PBR111 and PBR102. Furthermore, these modifications gave a lipophilicity (log P7.5) value of approximately 2.2 which is in the range of 2–3, required for brain uptake.
Lipophilicity and in vitro binding results of PBR316 to the TSPO, CBR and LABs and HABs.
| K i (TSPO)a nM | K i (CBR)a nM | K i (LABs)a nM | K i (HABs)a nM | LABs:HABs | Log P7.5a | |
|---|---|---|---|---|---|---|
| PBR316 | 6.0 ± 1.4 ([3H]PK11195) | >5000 ([3H]flumazenil) | 35.1 ± 5.0 | 23.1 ± 2.7 | 1.5 | 2.16 ± 0.07 |
| 4.7 ± 1.2 ([3H]Ro 5-4864) |
n = 3 and p < 0.05.
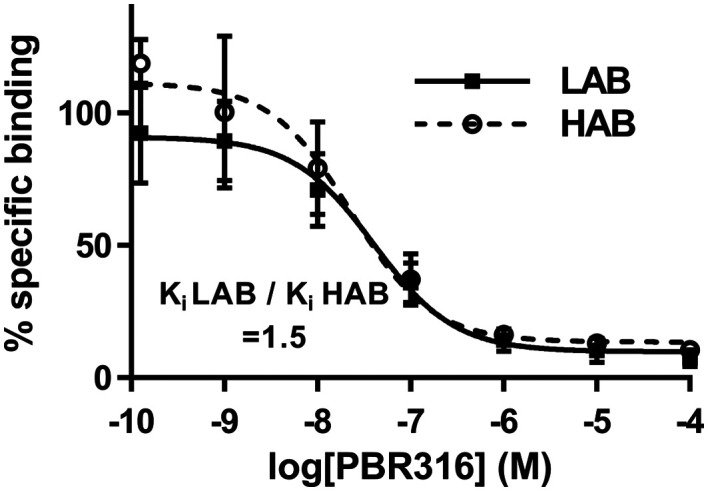
Importantly, it was observed that these modifications had a major effect on binding to TSPO polymorphs. Competition assays (Fig. 4) with PBR316 performed on human platelets gave a Ki LAB to HAB ratio of 1.5 (Table 1) compared to a HAB to LAB ratio of 4.0 for PBR111, thus providing the first example of a bis-carbonyl imidazopyridine with high, mixed affinity binding.
Fig. 4. Competition assays with [3H]PK11195 in the presence of increasing concentrations of PBR316 using human platelets previously characterised as HABs or LABs. Each data point represents mean ± SD, n = 3.
In vivo evaluation of [18F]PBR316 in rats
In vivo biodistribution studies in rats
The time-course biodistribution of [18F]PBR316 in rats from 15 min to 4 h is summarised in Table 2. The distribution of [18F]PBR316 follows that of the TSPO reported in the literature with high uptake in endocrine tissue, kidneys and the heart and low uptake in the brain.31–33 The uptake of activity in the adrenal glands increased over the time of measurement from 5.4 to 7.8% ID per g. An increase in activity was also found in the femoral bone marrow and ranged from 0.74 to 1.5% ID per g, whilst that of the femoral cortical bone increased from 0.49 to 1.2% ID per g and the skull frontal cortical bone from 0.29 to 0.57% ID per g over the same period. The femoral bone marrow radioactivity concentration was 1.7 times higher at 15 min and 2.7 times higher at 4 h when compared to the skull reflecting bone marrow uptake. In the peripheral organs, the activity (ID per g) decreased from measurements at 15 min to 4 h as follows: liver (0.6–0.2%), spleen (3.2–1.3%), kidneys (3.1–1.2%), heart (4.4–1.8%), muscle (0.43–0.13%) and lungs (6.5–1.2%).
Distribution of [18F]PBR316 in Sprague Dawley rats. Results are mean ± standard deviation (SD), percent injected dose per gram (% ID per g), n = 4.
| 15 min | 30 min | 1 hour | 2 hours | 4 hours | |
|---|---|---|---|---|---|
| Liver | 0.59 ± 0.09 | 0.49 ± 0.10 | 0.36 ± 0.03 | 0.33 ± 0.09 | 0.21 ± 0.03 |
| Spleen | 3.18 ± 0.47 | 2.98 ± 0.10 | 2.75 ± 0.28 | 2.11 ± 0.25 | 1.30 ± 0.14 |
| Kidney | 3.12 ± 0.04 | 2.61 ± 0.08 | 2.44 ± 0.26 | 1.77 ± 0.04 | 1.24 ± 0.03 |
| Lungs | 6.48 ± 0.79 | 3.43 ± 0.25 | 2.41 ± 0.51 | 1.49 ± 0.41 | 1.24 ± 0.03 |
| Heart | 4.35 ± 0.32 | 3.77 ± 0.46 | 3.86 ± 0.23 | 3.01 ± 0.13 | 1.83 ± 0.28 |
| Adrenals | 5.34 ± 0.89 | 5.21 ± 0.97 | 7.49 ± 0.82 | 6.80 ± 0.60 | 7.81 ± 0.41 |
| Muscle | 0.43 ± 0.03 | 0.40 ± 0.15 | 0.24 ± 0.05 | 0.20 ± 0.03 | 0.13 ± 0.03 |
| Blood | 0.12 ± 0.02 | 0.09 ± 0.01 | 0.08 ± 0.00 | 0.07 ± 0.01 | 0.04 ± 0.01 |
| Plasma | 0.04 ± 0.01 | 0.05 ± 0.00 | 0.05 ± 0.00 | 0.04 ± 0.01 | 0.03 ± 0.00 |
| Braina | 0.14 ± 0.02 | 0.08 ± 0.00 | 0.06 ± 0.01 | 0.05 ± 0.00 | 0.03 ± 0.00 |
| Olfactory bulbs | 0.38 ± 0.03 | 0.26 ± 0.04 | 0.26 ± 0.02 | 0.19 ± 0.07 | 0.19 ± 0.05 |
| Skull | 0.29 ± 0.08 | 0.30 ± 0.01 | 0.31 ± 0.05 | 0.55 ± 0.06 | 0.57 ± 0.13 |
| Bone marrow | 0.74 ± 0.12 | 0.93 ± 0.18 | 1.30 ± 0.16 | 1.48 ± 0.10 | 1.52 ± 0.34 |
| Femur | 0.49 ± 0.03 | 0.56 ± 0.07 | 0.79 ± 0.04 | 1.01 ± 0.17 | 1.19 ± 0.10 |
Brain minus olfactory bulb.
In the brain, a higher concentration of the radioactivity was found in the olfactory bulbs (0.43–0.19% ID per g) compared to the remainder of the brain (0.14–0.03% ID per g) between 15 min and 4 h. The relatively low uptake of [18F]PBR316 reflects the low TSPO receptor expression seen in the normal brain, with the olfactory bulb to brain ratios increasing from 3.1 ± 0.5 at 15 min to 6.9 ± 0.4% ID per g at 4 h. This ratio is higher than that reported for [18F]FE-DAA1106 of 3.58 and [18F]PBR111 (2 to 5)12 and is consistent with the density of TSPO31 and with results obtained with [18F]PBR111 12 and other radiolabelled radiotracers such as the N-benzyl-N-(2-phenoxyaryl)acetamide (DAA) series of radiotracers.34 In addition, metabolite analysis (see below) confirmed that the radioactivity in the cortex and olfactory bulbs was due to intact [18F]PBR316 confirming that [18F]PBR316 crosses the brain–blood barrier and is consistent with its log P7.5 value of 2.16. Very low concentrations of [18F]PBR316 were found in plasma throughout the time of measurement (≈0.04% ID per g).
Pharmacological competition studies
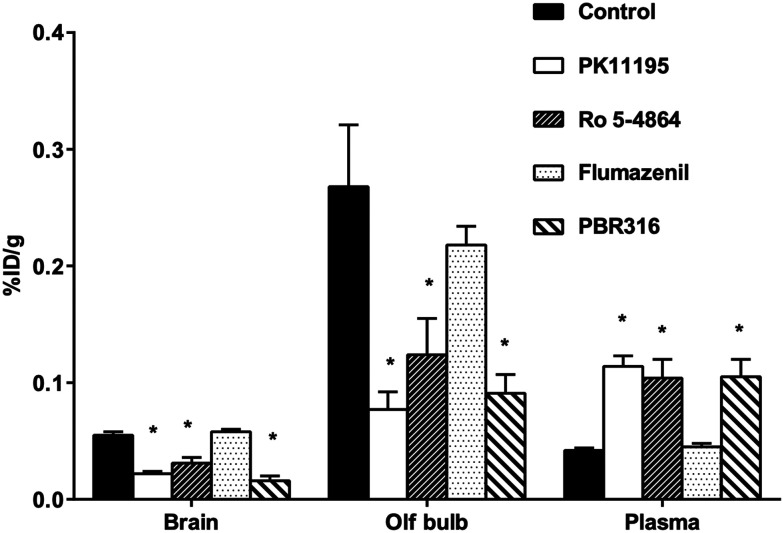
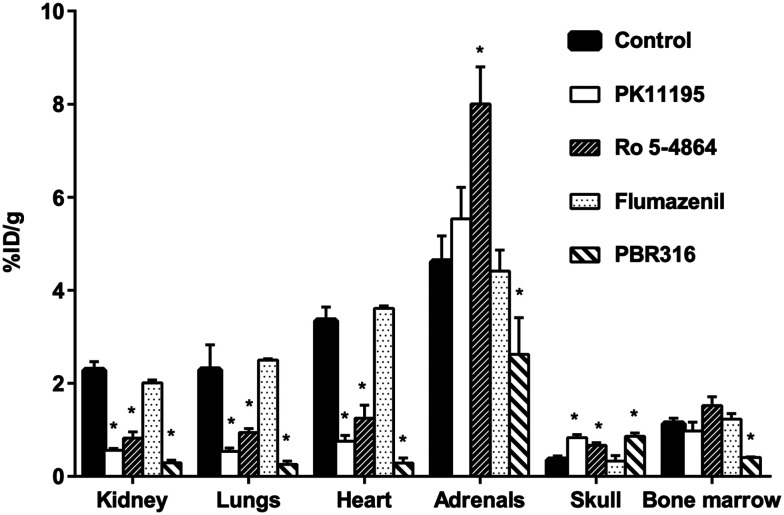
The results from the pharmacological drug competition experiments to test the ability of TSPO and CBR drugs to inhibit [18F]PBR316 uptake in the brain and in peripheral organs are shown in Fig. 5 and 6. PK11195 was most potent in inhibiting the uptake of [18F]PBR316: in the heart (78%), lungs (77%), kidney (75%), olfactory bulbs (69%) and the brain (60%) (p < 0.01), compared to the control animals. A non-significant increase (p > 0.05) was observed in the adrenal glands. PK11195 also showed a significantly increased uptake of activity in plasma (172%) and skull (137%) (p < 0.01) compared to controls. Similarly Ro 5-4864 significantly reduced the uptake of activity as follows: kidney (64%), heart (63%), lungs (59%), olfactory bulbs (58%) and the remainder of the brain (45%) (p < 0.01). A significant increase (p < 0.01) in uptake of activity was observed in the adrenal glands (73%), skull (90%) and plasma (146%). With flumazenil, non-significant differences of uptake in peripheral organs and CNS were observed. The saturating effect of PBR316 was observed with a significant decreases (p < 0.01) of [18F]PBR316 uptake: in the heart (92%), lungs (89%), kidneys (87%), brain (72%), bone marrow (64%), olfactory bulbs (63%) and adrenals (43%). A significant increase (149 and 144%, p < 0.01) of activity uptake was observed in the plasma and skull.
Fig. 5. Effect of competing drugs (1 mg kg−1; PK11195, PBR316, Ro 5-4864, and flumazenil) on [18F]PBR316 uptake in CNS of rat at 1 h p.i. Results are mean ± SD, unit is % injected dose per g tissue, n = 4 controls and n = 3–4 treated animals (*p < 0.01).
Fig. 6. Effect of competing drugs (1 mg kg−1; PK11195, PBR316, Ro 5-4864, and flumazenil) on [18F]PBR316 uptake in peripheral organs and skull of rat at 1 h p.i. results are mean ± SD, unit is % injected dose per g tissue, n = 4 controls and n = 3–4 treated animals. (*p < 0.01).
The uptake of activity in the olfactory bulbs, brain and peripheral organs that were blocked by PK11195, Ro 5-4864 and non-radioactive PBR316, suggests specific binding. Uptake in the adrenal glands and bone marrow was not blocked by PK11195 or Ro 5-4864 at 1 mg kg−1. In the adrenal glands, where the highest uptake (% ID per g) of all peripheral organs is observed, there was instead, an increase in uptake when blocked with Ro 5-4864. It is not certain why blocking was not as effective in the adrenal glands as with other TSPO-bearing tissue. It is possible that due to the higher receptor density in this tissue, a dose >1 mg kg−1 may be required to show a greater inhibition of uptake. Gildersleeve et al., reported that a dose of 5 mg kg−1 of PK11195 blocked rat adrenal gland uptake of [123I]PK11195 by 85%.35 We also reported a dose of 10 mg kg−1 was required to block the uptake of [123I]CLINDE in the adrenal glands by 51%.36 In this study, a dose of 1 mg kg−1 of the PBR316 drug could block the uptake in the adrenals and bone marrow.
Metabolite studies
Previous work on the imidazopyridines PBR102 and PBR11112,28,29 the pyrazolopyrimidine DPA71413 and the phenoxyphenyl acetamide DAA11068 incorporating a fluoroalkoxy ([18F]-fluoroethoxy or [18F]-fluoropropoxy) substituents on the 2-(4′-phenyl) position displayed unfavourable in vivo metabolism leading to the formation of [18F]fluoroacetate and [18F]fluoride as a result of metabolism. These findings prompted the replacement of the fluoroalkoxy side chain with a fluoroethyl analogue to improve in vivo stability.
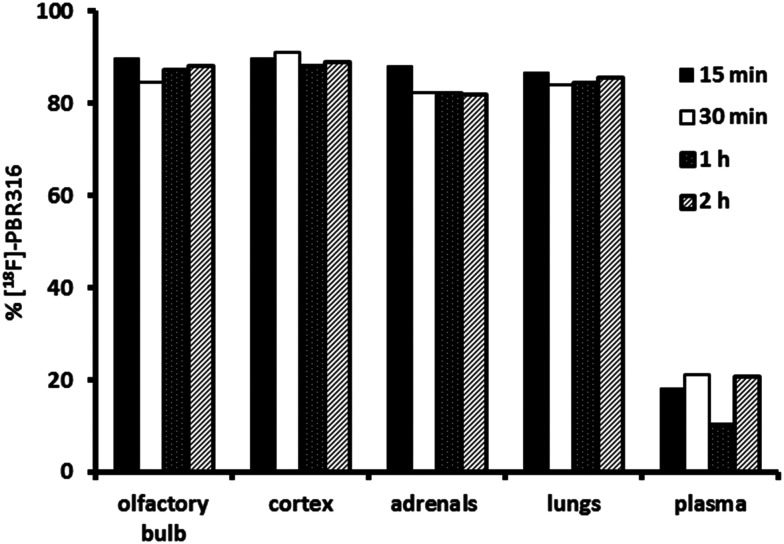
The in vivo stability of the [18F]PBR316 was evaluated in the olfactory bulb, frontal cortex, lungs, adrenal glands and plasma over 2 h, after i.v. injection. Following ultrasonic disruption and centrifugation of tissue, at least 79% of the radioactivity from the olfactory bulbs, adrenal glands, lungs, and frontal cortex samples was recovered in the supernatant from samples collected at 15, 30 min, 1 and 2 h. All analytical methods used, generated results in concordance with each other presenting a similar trend in in vivo stability. The solid phase extraction (SPE) analysis indicated that more than 87% of the recovered radioactivity was intact [18F]PBR316 in the olfactory bulbs, adrenal glands, lungs and frontal cortex samples at 15 min (Fig. 7). There was a 6% decrease in the percentage of unchanged radiotracer in these organs at 2 h post injection. However, in plasma, the % of unchanged [18F]PBR316 was reduced to 20 at 15 min which then remained constant over the period studied. Despite the low percentage of unchanged [18F]PBR316 in plasma at 15 minutes, this was sufficient for uptake in the relevant TSPO-bearing organs. Apart from the adrenals, no further uptake at later time points was observed, only washout of unbound tracer and metabolites.
Fig. 7. Percentage of un-metabolized [18F]PBR316 in tissues and plasma as measured using solid phase extraction.
Determination of [18F]PBR316 in blood components
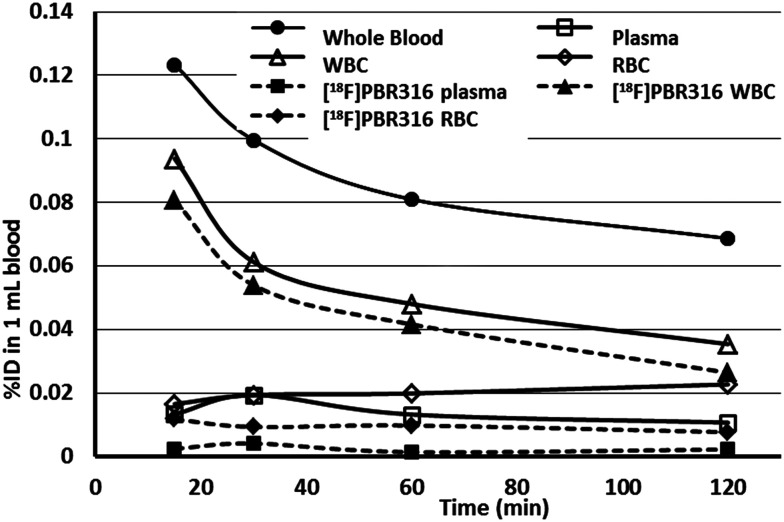
The in vivo stability of [18F]PBR316 in the blood components was studied by SPE over 2 h following i.v. injection (Fig. 8). After ultrasonic disruption of the white blood cells (WBC) and red blood cells (RBC) in the tube, analysis of the extracts using SPE showed the presence of radioactive metabolites. In the WBC fraction, 86% of the radioactivity represented [18F]PBR316 at 15 min, which diminished to 75% at 2 h. However, the WBC fraction may be contaminated with up to 5% of plasma and 5% of RBC due to the method used in the preparation. In RBC, the fraction of unchanged tracer was lower than in the WBC with the percentage of unchanged ligand diminishing from 71% at 15 min to 34% at 2 h post injection.
Fig. 8. Time course distribution of radioactivity in blood and in red and white blood cells as measured directly in haematocrit tubes by phosphorimaging. The percentage of un-metabolized [18F]PBR316 was determined by SPE collecting each fraction of blood components from the haematocrit tubes. Results are presented as the % of injected dose (% ID) in 1 mL of rat blood after injection of 30–40 MBq of radiotracer. Two hours after injection, more than 50% of unchanged [18F]PBR316 is in WBC. Total radioactivity is reported by full lines, unchanged [18F]PBR316 in dotted lines.
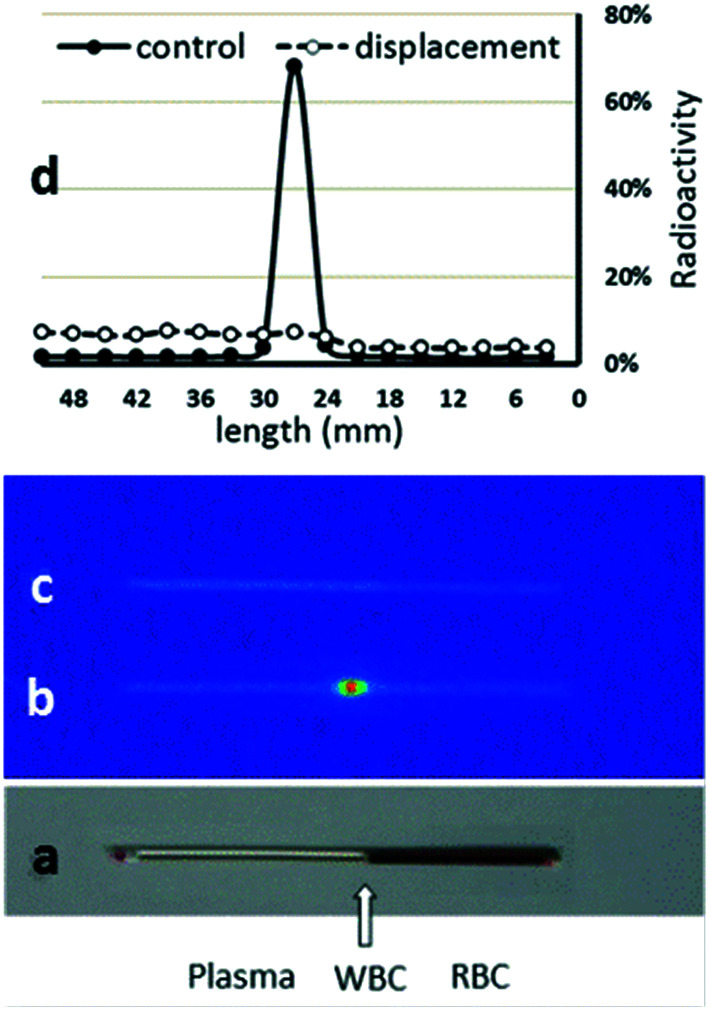
The autoradiographic image of radioactivity distribution in untreated and treated blood and its relative percentage in each of the components of the blood is shown in Fig. 9. The radioactivity in blood mostly accumulates in the WBC zone, and decreased with time, from 76% at 15 min to 52% at 2 h. The radioactivity in plasma was low over the 2 h (11–19%) while it increased in RBC over time (13% at 15 min to 33% at 2 h). Blood treated with PBR316 in vitro showed a displacement of radioactivity in the WBC, where the radioactivity decreased to around 20% of the total radioactivity in all time points studied. The radioactivity increased in RBC by 25% and plasma by 10% in all time points studied.
Fig. 9. Distribution of radioactivity in blood components 15 min after [18F]PBR316 (30–40 MBq) injection in rats as determined using haematocrit and phosphorimaging techniques. Picture of the capillary tube with blood components after centrifugation: (a) image of the capillary tube showing blood components; (b) autoradiographic image of the radioactivity distribution in blood components; (c) autoradiographic image showing the radioactivity distribution in the blood after in vitro displacement with PBR316 (60 nmol); (d) distribution profile of radioactivity in blood components as a function of tube length. Values represent the percentage of radioactivity in 3 mm zone to the total radioactivity in the tube. The major part of the radioactivity (76%) was found in the WBC zone and was displaced by PBR316.
Metabolite and competition studies of the radioactivity in blood components showed that the radioactivity in the WBC fraction was mostly due to [18F]PBR316 specific to TSPO, while in plasma and RBC, it was mostly due to metabolites and was not specific. In WBC, especially, lymphocytes are known to express high levels of the TSPO.37 Our results are in accordance with in vitro data reported from Bmax levels for blood components and in vivo results of radioactivity in blood of human cohorts calculated with [11C]PBR28.38 These results correspond to cell counts, which estimate that >75% of the TSPO signal derived from blood cells should be derived from white blood cells (leukocytes).39 The low uptake of radioactivity in the femoral bone and the skull of rats over 4 h is comparable to [18F]-VC701 40 and indicated negligible defluorination of the radiotracer hence, potentially a greater stability for in vivo PET imaging studies than [18F]PBR111 or [18F]FEPPA.41
Biological evaluation of [18F]PBR316 in an animal model of prostate cancer (PC)
TSPO levels are overexpressed in prostatic intraepithelial neoplasia, and primary and metastatic PC compared to normal prostate tissue and benign prostatic hyperplasia.5 [18F]PBR316 was further evaluated in vitro and in vivo in PC-3M-Luc-C6 tumours to detect and map the TSPO in PC tissue.
In vitro characterisation of prostate tumour cells for the TSPO
Data from saturation studies on PC-3 cells using [125I]CLINDE, gave a Kd = 2.4 ± 0.7 nM and a concentration of binding sites, Bmax = 3.6 ± 0.9 pmol mg−1 protein (n = 6) for the TSPO. TSPO gene expression on PC-3 and PC-3M-Luc-C6 cells relative to the MCF-7 cells, which are TSPO negative, was confirmed using RT-PCR analysis. The TSPO expression on PC-3 and PC-3M-Luc-C6 tumour cells relative to MCF-7 cells were 8.9 ± 3.8 and 7.5 ± 1.4 times higher compared to MCF-7 cell TSPO levels (n = 3).
In vivo characterisation of PC-3M-Luc-C6 tumours
PC-3M-Luc-C6 tumours were palpable 7 days p.i. of cells and weekly bioluminescence imaging of the mice indicated the extent of viable cells within the tumour mass confirming the PC-3 M-Luc-C6 tumour viability at the time of PET imaging at 19–24 days p.i. (Fig. S1 ESI†).
In-vivo PET evaluation of [18F]PBR316 in mice with PC-3M-Luc-C6 tumours
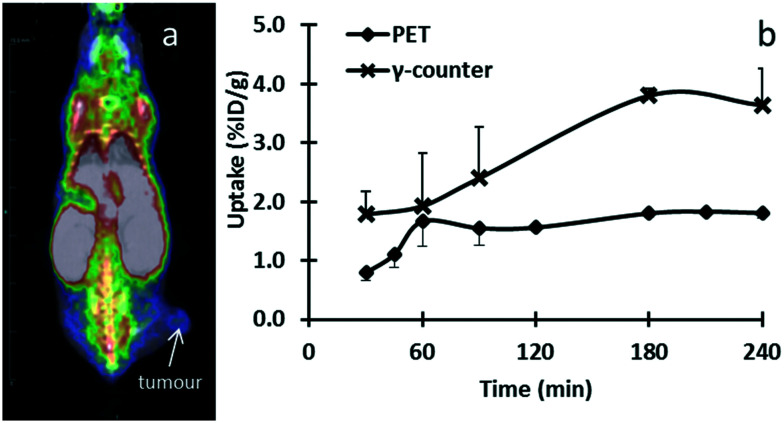
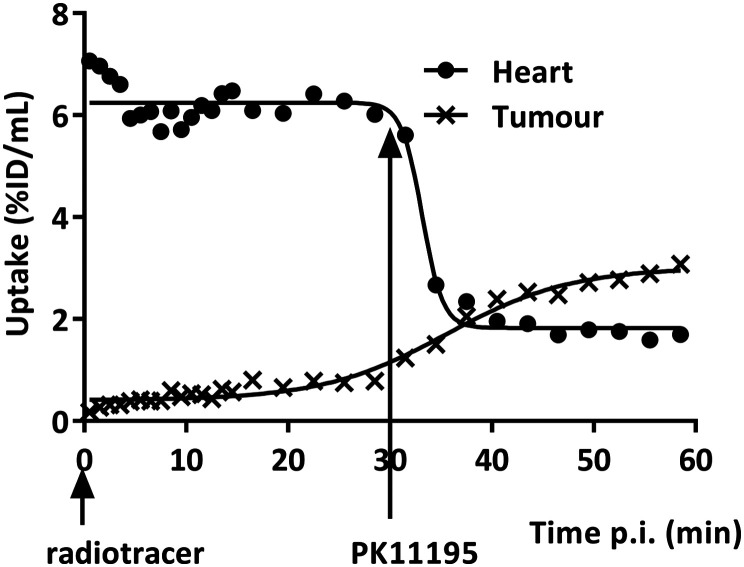
PET imaging results of mice with PC-3M-Luc-C6 tumours indicated [18F]PBR316 uptake in the tumours of 0.79 ± 0.14% ID per mL at 30 min increasing to 1.81 ± 0.09% ID per mL at 240 min. This shows the same increasing trend as the results obtained from ex vivo radioactivity in tumour measured by a γ-counter (Fig. 10). In the PET displacement study, although radioactivity from TSPO-bearing organs such as the heart decreased from 7.2 ± 1.8 at 30 min to 1.9 ± 0.03% ID per mL at 60 min (Fig. 11), no displacement of the radioactivity from the tumours was observed with PK11195, instead an increase of radioactivity was seen. Results from biodistribution and displacement studies measured with PET imaging correlated with results measured ex-vivo with the γ-counter. Data from measurements with the γ-counter are shown in ESI.†
Fig. 10. Representative fused PET–CT data at 30 min post-injection of [18F]PBR316 (10 MBq) in a mouse with a subcutaneous PC-3M-Luc-C6 xenograft (a). Time course of tumour uptake measured in vivo with PET and ex vivo with γ-counter over 240 min (b).
Fig. 11. Time course of radioactivity measured with PET in the heart and tumour of a mouse with a subcutaneous PC-3M-Luc-C6 xenograft after intravenous injection of [18F]PBR316 (3–20 MBq) and displacement with 1 mg kg−1 PK11195 intravenously injected 30 min after the radiotracer.
We showed that PC-3 and PC-3M-Luc-C6 cells express the TSPO gene and that PC-3 cells express the TSPO, warranting further studies in prostate cancer imaging. Our findings support previous research where Black et al., reported that TSPO levels are elevated in many cancer cells including breast, ovary, colon and prostate.42 In the PET imaging study involving PC-3 M-Luc-C6 tumour-bearing mice, we observed uptake and distribution of [18F]PBR316 in TSPO expressing tissue consistent with TSPO localization in the peripheral tissues of rodents. In particular, [18F]PBR316 displayed tumour uptake in the prostate mouse model of 1.67 ± 0.43% ID per g at 1 h post injection that was comparable to the uptake of other TSPO ligands.43
Displacement studies of [18F]PBR316 using PET, also showed displacement of activity in peripheral organs expressing the TSPO, reflecting the ex vivo displacement results, but there was no displacement of activity in the tumour. Instead, there was an increase of radioactivity after the injection of PK11195. These results are similar to the findings in the adrenal glands and bone marrow, and could be related to the amount of PK11195 (1 mg kg−1) administered to displace the radioactivity from the tumour. This suggestion is supported by the work of Winkeler et al., using [18F]DPA714 in an intracranial 9 L glioma tumour in rats, where they required a dose of 5 mg kg−1 of PK11195 to achieve a significant displacement in the tumour whereas at 1 mg kg−1 there was no significant displacement.44 The initial uptake in the tumour was low but continued to rise over the 30 min prior to the administration of the displacement drug. This is consistent with the uptake in the tumour potentially being limited by restricted blood flow or heterogeneity of the TSPO expression in the tumours in vivo45 which would further confound displacement of the radiotracer from the tumour by limiting the amount of displacement drug delivered to the tumour.
Structure and activity
TSPO ligands incorporating a bis-carbonyl moiety on the imidazopyridine or pyrozolopyrimidine structure have not been described previously. However, the presence of this functional group could be found in a series of phenylindoleglyoxylamides, from which a number of ligands have demonstrated high affinity and selectivity for the TSPO over the CBR, but no information on the LAB, HAB or MAB binding profiles were reported.46–51
Previous work involving the incorporation of a methyl group on the methylene of the acetamide chain of imidazopyridines led to a large drop in TSPO affinity, suggesting that the addition of substituents in this position was detrimental to TSPO binding affinity and selectivity, confirming the importance of the methylene group for binding.51,52 Our results however, indicate that the incorporation of a second carbonyl in place of the methylene group was well tolerated.
Structure–activity studies involving modifications to the pyridine and 2′-phenyl rings and the 3-acetamide side chain of the imidazopyridine core have been described in the literature, resulting in a well-defined pharmacophore with structural requirements for high affinity and selective ligands for the TSPO.51–54 Based on these and related studies, a general pharmacophore model, incorporating three lipophilic regions (the substituted pyridine, the 2-phenyl ring and the N,N′-dialkyl substituents of the acetamide side chain) with a hydrogen-bond acceptor (the carbonyl oxygen on the acetamide side chain) was proposed.53 A similar pharmacophore with these three lipophilic regions and a hydrogen bond acceptor associated with the amide carbonyl was also proposed for other classes of TSPO molecules, including the phenylindolylglyoxylamides.47,50 However, information on the role of the second carbonyl in these structure–activity studies or the pharmacophore model with respect to polymorphism has not been previously reported. It is conceivable that the second carbonyl group may also act as an additional hydrogen bond acceptor for interaction with the TSPO polymorphs following the Thr/Ala amino acid substitution in the TSPO protein.
From a structure–activity perspective, it is not certain if the second carbonyl group, the N,N′-dimethyl group, changes to the 2-phenyl alkyl substituents on PBR316, or the combination of all three are responsible for the relatively high affinity binding values found for each of the TSPO polymorphs and the good LAB to HAB ratio. The effect of the 4′-substituents on the 2-phenylimidazo[1,2-a]pyridine or N,N′-dialkyl-2-phenylindolylglyoxylamide systems on the binding to the TSPO polymorphs is largely unknown as the vast number of these 4′-substituted-2-phenyl ligands reported over the last two decades were not evaluated for sensitivity to rs6971 polymorphism. However, this seems less likely, given that this part of the molecule was proposed to lie within the L2 lipophilic pocket of the proposed pharmacophore model.47,51–53
Replacement of the 4′-fluoroalkoxy substituents on the 2-phenyl ring of previously radiolabelled imidazopyridine ligands such as [18F]PBR111 and [18F]PBR102 with a 4′-fluoroethyl group, maintained the high affinity and selectivity of PBR316 for the TSPO and had no impact on biodistribution and metabolic stability whilst maintaining the ability for [18F]-fluorination using conventional aliphatic nucleophilic substitution reactions. The chemical modifications to the imidazopyridine structure maintained the high affinity of [18F]PBR316 for TSPO and it displayed a 1000 times higher selectivity for the TSPO over the CBR. These structural modifications resulted in a LAB:HAB ratio of 1.5. This LAB:HAB ratio is comparable to PK11195 (R = 0.9) and is much lower than that for other TSPO ligands.19 Based on these values, PBR316 has low sensitivity to rs6971 polymorphism in vitro, however, as indicated by Ikawa et al., for [11C]ER176, the in-vitro properties need to be confirmed in vivo.23
To our knowledge, this is the first example of a [18F]-substituted imidazo[1,2-a]pyridine incorporating an oxoacetamide (bis-carbonyl) functional group that has an in vitro and in vivo pharmacological profile consistent with other leading TSPO ligands, that is also insensitive to human rs6971 single nucleotide polymorphism. As such, we suggest that PBR316 is a good structural lead in the development of other bis-carbonyl substituted TSPO imidazopyridine ligands.
Conclusions
We report our findings on a 2-phenylimidazo[1,2-a]pyridine that incorporates an N,N′-dimethyl bis-carbonyl side chain and a fluoroethyl group on the 2-phenyl ring (PBR316). [18F]PBR316 displays high nanomolar affinity (6.0 nM ([3H]PK11195); 4.7 nM ([3H]Ro 5-4864)) for the TSPO and is selective over the CBR (>5000 nM ([3H]Flumazenil)). It has low sensitivity to rs6971 polymorphism with a LAB:HAB ratio of 1.5; a marked improvement in binding to other imidazopyridines and TSPO ligands and is close to that reported for PK11195. [18F]PBR316 uptake is seen in TSPO-expressing tissue and in the olfactory bulbs, indicating that it readily crosses the blood brain barrier. Furthermore, the activity in the brain and other TSPO-expressing tissue was saturable and specific as it was displaceable with PK11195, Ro-5-4864 and non-radioactive PBR316 and the activity extracted from TSPO expressing tissues was >87% unchanged [18F]PBR316. [18F]PBR316 exhibits low bone uptake suggesting a low rate of defluorination. Uptake of [18F]PBR316 was also seen in TSPO expressing PC-3M-Luc-C6 tumours with preclinical PET–CT.
PBR316 can be conveniently prepared in multi-gram quantities and is achiral, thus avoiding the formation of enantiomers requiring complex syntheses, chiral resolution, or potential risks of isomerisation during processing or radiolabelling. [18F]PBR316 can be prepared in >99% radiochemical purity with a high molar activity (400 GBq μmol−1). It is stable (>98.5%) for at least 4 h and can be prepared in 10–20 GBq quantities. We suggest that [18F]PBR316 has promise as a PET TSPO radiotracer for further biological studies and clinical evaluation.
Experimental section
General
All reagents were purchased from Sigma-Aldrich or Merck and were used without further purification. Kryptofix®2.2.2 and potassium carbonate (K2CO3), were obtained from Sigma-Aldrich. Dry acetonitrile (DNA-quality), and solvents used for radiosynthesis and HPLC chromatography were purchased from Merck. Sep-Pak® Light Accell™ QMA, Sep-Pak® Light Alumina N and Sep-Pak® Plus C18 cartridges were purchased from Waters. Cathivex GV 0.22 μm sterile filters were supplied from Millipore.
Aqueous, no carrier added [18F]F− was produced on a GE 16.5 MeV PETtrace cyclotron via the 18O(p,n)18F nuclear reaction on 97% enriched [18O]H2O. The radiosynthesis of [18F]PBR316 was performed on a GE TracerLab FXFN automated synthesis module using an in-house synthesis sequence. [18F]PBR316 was purified by HPLC available on GE TracerLab FXFN module, consisting of a Sykam S-1021 pump, a Knauer K-2001 UV detector (λ = 254 nm) in series with a β+-flow detector, on an Alltima C18 column (250 × 22 mm, 10 μm) at 10 mL min−1 with acetonitrile/water/trifluoroacetic acid (TFA) (60 : 40 : 0.1, v/v/v) as the mobile phase.
Quality control analysis to determine the chemical and radiochemical purity and the specific activity of [18F]PBR316 was performed on a Shimadzu HPLC System that comprised an LC-20 AD gradient pump, a SPD-M20A photodiode array detector (λ = 254 nm), a LabLogic Flow-RAM radiation detector and a Rheodyne manual injector. The HPLC system was controlled using Laura HPLC software (LabLogic Systems). A Phenomenex Luna C18(2) 100 Å column (250 × 4.6 mm, 5 μm) at 1 mL min−1 with acetonitrile/water/TFA (40 : 60 : 0.01, v/v/v) as the mobile phase was used for the analysis. The identity of the labelled compound was confirmed by co-injection of the corresponding PBR316 standard using analytical HPLC conditions.
Determination of PBR316 lipophilicity
The log P value of PBR316 was estimated by comparing HPLC retention times of test compounds with those of standards with known log P values as described previously.55
Radiochemistry
[18F]PBR316 was prepared by 18F-nucleophilic substitution of the corresponding tosyl precursor 5, on the GE TracerLab FXFN synthesis module. Aqueous [18F]fluoride solution (60–80 GBq), prepared by the 18O(p,n)18F reaction was trapped onto a Sep-Pak® Light Accell™ QMA cartridge that had been activated with potassium carbonate (10 mL, 0.10 M). The concentrated [18F]fluoride was then eluted into the reactor with a solution of K2CO3/K222 (2 mg/10 mg) in a solution of CH3CN : H2O (4 : 1, 1 mL). The solvent was evaporated under vacuum and a stream of helium at 70 °C for 7 min and then at 120 °C under vacuum for 2 min. To the dried K222/potassium [18F]fluoride mixture was added the tosyl precursor 5 (3 mg) in dry acetonitrile (2 mL) and the mixture was heated at 100 °C for 5 min. The reactor was then cooled at 30 °C, diluted with HPLC mobile phase (1 mL) and the solution was directly passed through an activated Sep-Pak® Light Alumina N cartridge before injection onto a preparative reversed phase HPLC column (Alltima C18 column (250 × 22 mm, 10 μm); mobile phase CH3CN : H2O : TFA (60 : 40 : 0.1, v/v/v); flow rate 10 mL min−1; λ = 254 nm). The fraction containing [18F]PBR316 was collected between 10.5 and 12.5 min, diluted with water (15 mL) and trapped onto a Sep-Pak® Plus C18 cartridge. The Sep-Pak was then washed with water (10 mL) and the [18F]PBR316 was eluted with ethanol (2 mL) followed by saline (5 mL). Finally, the bulk solution was passed through a 0.22 μm filter and recovered in a sterile vial for further dilution with saline to take the ethanol concentration below 5%. Routinely, [18F]PBR316 was ready for injection in <60 min. Typically, 10–20 GBq of [18F]PBR316 was isolated in 20 ± 5% radiochemical yield non decay-corrected. The chemical and radiochemical purity of [18F]PBR316 was performed on a Phenomenex Luna C18(2) 100 Å column (150 × 4.6 mm, 5 μm) at a flow rate of 1 mL min−1 using CH3CN : H2O : TFA (40 : 60 : 0.01, v/v/v), as the mobile phase at λ = 254 nm. The retention time of [18F]PBR316 was between 12–13 min (Fig. 3a and b) and the identities of the labelled compounds were confirmed by co-injection with authentic PBR316 standard (Fig. 3c). Typically, [18F]PBR316 was synthesised with a radiochemical purity of >99% and >98.5% after 4 h and a molar activity between 160 and 400 GBq μmol−1.
Biological evaluation
All animal experimental procedures were carried out in compliance with Australian laws governing animal experimentation and approved by the ANSTO Animal Care and Ethics Committee (ACEC) and the University of New South Wales Animal Care and Ethics Committee B. Male Sprague-Dawley (SD) rats were obtained from the Australian Resource Centre (Perth, Australia). Male Balb/c nu/nu mice were obtained from the Australian Bio Resource (Sydney, Australia).
In vitro binding
Determination of affinity of PBR316 for the TSPO and the central benzodiazepine receptor (CBR)
The inhibition constants (IC50) of PBR316 for the TSPO and the CBR were determined as described previously.56 The IC50 for TSPO was determined by incubating, in triplicate, aliquots (0.3 mL) of diluted rat kidney membrane preparation (150–200 μg, protein), at 4 °C for 1 h with 7 concentrations of PBR316 (10−10 to 10−6 M) and [3H]PK11195 (PerkinElmer) or [3H]Ro 5–4864 (American Radiolabelled Chemicals) in a final volume of 0.5 mL. Non-specific binding was determined using PK11195 (10 μM) (Sigma-Aldrich). For the CBR the IC50 was determined using diluted rat brain cortex membrane preparation at 25 °C for 45 min with [3H]Flumazenil (PerkinElmer). Non-specific binding was determined using flumazenil (20 μM) (Sigma-Aldrich). In all cases, incubations were terminated by rapid filtration through Whatman GF/B glass fibre using a Brandel cell harvester. Filters were washed rapidly 3 times with 5 mL ice-cold 50 mM Tris/HCl at pH 7.4 and radioactivity measured in a β-scintillation counter (Packard). The IC50 of the compounds for the PBR and CBR were calculated using GraphPad Prism V6. The IC50 values were converted to the inhibition constant, Ki, using the Cheng-Prusoff equation.57
Determination of the affinity of PBR316 in platelets
The sensitivity of PBR316 to TSPO rs6971 polymorphism was determined by measuring its binding affinity to low and high affinity binders as described by Owen et al.19 Competition binding assays using [3H]PK11195 in the presence of PBR316 were performed as above, to assess the binding affinity to each HAB and LAB platelets. At least 3 independent studies were performed in duplicate. All competition data were analysed using the iterative nonlinear regression curve-fitting software supplied with the GraphPad Prism software. Single-site and 2-site competition models were fitted to the data using the least-squares algorithm, and the model was selected using an F-test. The null hypothesis, that the data fitted a single-site model, was rejected if the P value was lower than 0.05. A dissociation constant of (Kd = 29.25 nM) [3H]PK11195 was used to generate the Ki according to the Cheng–Prusoff equation.57
In vivo evaluation of [18F]PBR316 in rats
In vivo biodistribution studies
[18F]PBR316 (1 MBq) was administered to 8–10 week old male SD rats via a tail vein injection in a volume of 0.1 mL. At 15, 30 min, 1, 2 and 4 h post injection (p.i.) of the radioligand, the rats (n = 4) per group were sacrificed by CO2 administration followed by cervical fracture. The liver, spleen, femur, lung, heart, kidney, adrenal glands, muscle, femoral bone marrow, skull, blood, olfactory bulbs and of the brain minus olfactory bulbs (referred to as brain) were removed. Samples of organs and tissues were weighed and the radioactivity was measured using an automated γ-counter (Wizard 1480, Wallac). The percent injected dose (% ID) was calculated by comparison to a diluted standard solution derived from the initial injected solution. Radioactivity concentrations were expressed as a percent of injected dose per gram of wet tissue (% ID per g).
Pharmacological competition studies
The inhibition of [18F]PBR316 uptake was studied by injecting a group of rats intravenously (i.v.), unlabelled PBR316 (1 mg kg−1), 5 min prior to the radioligand (1 MBq). The specificity of the [18F]PBR316 uptake was investigated in competition experiments by injecting i.v. flumazenil, PK11195, or Ro 5-4864 at 1 mg kg−1, to 3 groups of rats, 5 min prior to the radioligand. The rats were sacrificed by CO2 administration followed by cervical fracture 1 h after administration of [18F]PBR316 and the lungs, heart, kidneys, adrenal glands, blood, bone marrow, olfactory bulbs, brain and skull were recovered and measured. The radioactivity concentrations were calculated as described above. Results were analysed by one-way analysis of variance followed by Dunnett's post hoc test for comparing the tissue radioactivity concentrations in the treated animals (n = 3–4) to control animals (n = 4). The criterion for significance was p < 0.05.
Metabolite analysis
The determination of unchanged radiotracer in the plasma, adrenals, frontal cortex and olfactory bulbs, was performed by gradient radio-HPLC, radio-TLC and solid phase extraction (SPE) methods28 at 15 min, 30 min, 1 and 2 h. Male rats were administered with [18F]PBR316 (30–40 MBq in 0.1 mL) via the tail vein and the frontal cortex, olfactory bulbs, adrenal glands, lungs and blood were collected. The blood was centrifuged at 5000 rpm for 5 min to isolate plasma. Plasma and tissue samples were weighed and the radioactivity was measured. Treatment of plasma, tissues and analysis was performed as described previously.12,29,58
Determination of [18F]PBR316 in blood components
The distribution of [18F]PBR316 radioactivity, its displacement and metabolites in the different components of blood: red cells (RBC), white cells + platelets (WBC) and plasma were determined. Blood (1 mL) was collected in heparinised tubes from male rats at 15 min, 30 min, 1 and 2 h post i.v. of [18F]PBR316 (30–40 MBq in 0.1 mL), via the tail vein. Capillary tubes (2) from each blood sample were filled and the remaining blood was treated with PBR316 (60 nmoles) for 10 min and another capillary tube filled. All capillary tubes were centrifuged (Clements GS-150, 5000 rpm, 10 min) to allow separation of blood components. After centrifugation, a tube with untreated blood and a tube with treated blood from each time point were exposed to imaging plates MS 4025 for 40 min. The images were evaluated using a Fujifilm Bio-imaging analyser BAS 2500. After background correction, the amount of [18F]PBR316 was calculated as the ratio of phosphor stimulated luminescence value in the identified component to the sum of all values measured in the capillary tube image.
The remaining tubes with untreated blood were frozen in liquid N2 and cut into 3 parts, plasma, WBC and RBC. The parts containing WBC and RBC were separately powdered and the cells were lysed in a mixture of ACN–water 20 : 80 (200 μL) using an ultrasonic probe. The radioactivity in the WBC and RBC solutions were measured in a γ-counter and then centrifuged (5 min, 5000 rpm). The supernatant fractions from RBC and WBC were subsequently analysed for metabolites using the same procedure as for SPE analysis of the plasma above.
In vitro characterisation of prostate tumour cells for TSPO
Cell culture
Prostate cancer (PC-3) and breast cancer (MCF-7) cells were obtained from the American Type Culture Collection. Luciferase expressing (PC-3M-Luc-C6) cells were acquired from PerkinElmer. All culture reagents were obtained from ThermoFisher Scientific. PC-3 and PC-3M-Luc-C6 cells were cultured in RPMI with 10% fetal bovine serum (FBS). PC-3M-Luc-C6 cells were also maintained in 1 μg mL−1 of puromycin. MCF-7 cells were cultured in DMEM with 10% FBS. All cell lines were maintained under standard conditions, 37 °C and 5% CO2 humidified incubator.
Saturation studies
For the determination of the equilibrium dissociation constant (Kd) and maximum number of specific binding sites (Bmax) of the PC-3 cells, the TSPO specific ligand [125I]CLINDE (3.7 GBq μmol−1) was prepared as described.30 PC-3 cells were scraped from culture flasks with 5 mL ice cold phosphate buffered solution (PBS), homogenised and centrifuged at 500 g for 15 min at 4 °C. The pellets were recovered into 50 mL ice cold PBS, homogenised and stored at −80 °C until use. Protein content in the cell suspensions was measured according to the Lowry method. Binding assays were performed as described previously.56 Briefly, the assays were run in triplicate with concentrations of [125I]CLINDE ranging from 0.1 to 20 nM in 0.5 mL with a final protein concentration of 200–300 μg mL−1 of cells suspension. Incubations were performed as described above. The radioactivity remaining on the filters was measured in a well γ-counter and corrected for decay. The Kd and Bmax were calculated from the specific binding data i.e. the difference between the total binding minus the non-specific binding, using an iterative non-linear least squares curve fitting program (GraphPad Prism).
Real time-polymerase chain reaction (RT-PCR) for TSPO gene expression
PC-3, PC-3M-Luc-C6 and MCF-7 cells were cultured in 75 cm2 flasks until 80–90% confluent. RNA was extracted using the RNAeasy Mini kit (Qiagen). The RNA quality and quantity were determined by optical density with the Nanodrop 1000 (ThermoFisher Scientific). RNA (1 μg) was used for cDNA generation using the Quantitect reverse transcription kit (Qiagen). RT2 qPCR primer assays were purchased from Qiagen for the human GAPDH (NM_001256799) and TSPO (NM_000714) and Platinum® Sybr® Green qPCR Supermix-UDG (ThermoFisher Scientific) was used following the manufacturer's protocol to perform RT-PCR with the Biorad CFX96 real time-detection system and 40 cycles, melt curve analysis was performed. Relative expression normalized to GAPDH and expressed as fold change compared with MCF-7 cells TSPO levels.
In vivo evaluation of [18F]PBR316 in mice with PC-3M-Luc-C6 tumours
In vivo prostate tumour model
Male Balb/c nu/nu mice (6–8 weeks) were injected subcutaneously in the right flank with 3 × 10⁶ PC-3M-Luc-C6 cells in 100 μL of PBS. The tumour size was monitored with calipers and allowed to develop to the size of no more than 300 mm3 before the PET–CT study.
Bioluminescence imaging
The PC-3M-Luc-C6 cell line expresses the luciferase protein that enables tracking of tumour growth in vivo. PC-3M-Luc-C6 tumour-bearing mice were imaged with the IVIS SpectrumCT (PerkinElmer) imaging system. Mice were injected intraperitoneally with 150 mg kg−1 of d-luciferin (Goldbio), anaesthetized with 2% isoflurane and bioluminescence imaging was performed after 10–12 min. Animals were imaged once weekly p.i. of the cells.
PET–CT studies
Imaging biodistribution and displacement studies were performed using an Inveon small animal PET–CT imaging system (Siemens-Healthcare). Prior to the PET–CT scan, mice were anaesthetized using isoflurane (induction 3–4%, maintenance 1–3%, in medical oxygen), carefully positioned at the centre of the field-of-view of the PET–CT scanner. Respiration was monitored with a pneumatic pillow sensor (BioVet, m2m Imaging Corp) for the entire scanning period. The body temperature was maintained with a heat mat. Mice were secured with surgical tape to minimise movement and Lacri-lube was placed onto the animals' eyes to prevent drying during anaesthesia. A CT scan acquisition of 12 minutes was done on each animal for anatomical information before each PET acquisition. All PET data were reconstructed with an OSEM2D algorithm (4 iterations) after Fourier rebinning with the Inveon Research Workplace. Scatter and attenuation correction were also applied. Dynamic list mode PET data were histogrammed into frames, 30 (15 × 60 sec, 15 × 300 sec), 24 (15 × 60 sec, 9 × 300 sec), or 10 (10 × 60 sec) before reconstruction. PET and CT volumes were automatically co-registered for each of the studies. Regions of interest were manually drawn and the resultant counts converted into activity concentration (kBq mL−1) using calibration factors.
For biodistribution studies 15 mice were used, 19–24 days post tumour cells injection. In one study, mice (n = 3) were anaesthetised and a catheter inserted into the tail vein. [18F]PBR316 (3–20 MBq) was then administered through the catheter and PET imaging acquisition was started simultaneously with the injection of tracer. The mice were scanned for 90 min. In a second study, four groups of 3 mice were injected through the tail vein with radiotracer, anaesthetised at 30, 60, 180 or 240 min p.i and then scanned for 10 min. To study the displacement of [18F]PBR316, mice (n = 3), 19 days post tumour cells injection were used. The mice were anaesthetised, a catheter inserted into their tail vein and then positioned in the PET–CT scanner. [18F]PBR316 was injected through the catheter and scanning started simultaneously with the injection. After scanning for 30 min, the mice were administered with 100 μL of a solution of PK11195 (1 mg kg−1 in 5% DMSO/saline) for displacement of radioactivity followed by another 30 min of scanning. At the end of the PET imaging studies, the mice were sacrificed and one kidney, heart, blood, muscle and tumour were rapidly removed, and the radioactivity measured in a γ-counter to confirm the biodistribution and displacement of [18F]PBR316, observed by PET imaging. The displacement values were compared with the values of the biodistribution at 30 min (control). Data from the γ-counter was analysed as above for the rat studies.
Funding
This project was funded by the Department of Molecular Imaging, Royal Prince Alfred Hospital, ANSTO, Biological Resources Laboratory (UNSW) and the Prostate Cancer Foundation of Australia, Grant NCG 5012.
Conflicts of interest
The authors declare no conflict of interest.
Supplementary Material
Acknowledgments
The authors thank N. Howell, G. Rahardjo, D. Jiang, K. Belbin, E. Davis, I. Kurlapski and G. Dhand for technical assistance. The authors acknowledge the facilities, and the scientific and technical assistance of the UNSW node of the National Imaging Facility.
Electronic supplementary information (ESI) available. See DOI: 10.1039/d1md00035g
References
- Selvaraj V. Tu L. N. J. Endocrinol. 2016;231:R1–R30. doi: 10.1530/JOE-16-0241. [DOI] [PubMed] [Google Scholar]
- Papadopoulos V. Baraldi M. Guilarte T. R. Knudsen T. B. Lacapere J. J. Lindemann P. Norenberg M. D. Nutt D. Weizman A. Zhang M. R. Gavish M. Trends Pharmacol. Sci. 2006;27:402–409. doi: 10.1016/j.tips.2006.06.005. [DOI] [PubMed] [Google Scholar]
- Lee Y. Park Y. Nam H. Lee J. W. Yu S. W. BMB Rep. 2020;53:20–27. doi: 10.5483/BMBRep.2020.53.1.273. [DOI] [PMC free article] [PubMed] [Google Scholar]
- Boche D. Gerhard A. Rodriguez-Vieitez E. Faculty M. Eur. J. Nucl. Med. Mol. Imaging. 2019;46:2831–2847. doi: 10.1007/s00259-019-04462-w. [DOI] [PMC free article] [PubMed] [Google Scholar]
- Han Z. Slack R. S. Li W. Papadopoulos V. J. Recept. Signal Transduction. 2003;23:225–238. doi: 10.1081/rrs-120025210. [DOI] [PubMed] [Google Scholar]
- Bhoola N. H., Mbita Z., Hull R. and Dlamini Z., in International journal of molecular sciences, edn, 2018, vol. 19 [DOI] [PMC free article] [PubMed] [Google Scholar]
- Chauveau F. Boutin H. Van Camp N. Dolle F. Tavitian B. Eur. J. Nucl. Med. Mol. Imaging. 2008;35:2304–2319. doi: 10.1007/s00259-008-0908-9. [DOI] [PubMed] [Google Scholar]
- Zhang M. R. Maeda J. Furutsuka K. Yoshida Y. Ogawa M. Suhara T. Suzuki K. Bioorg. Med. Chem. Lett. 2003;13:201–204. doi: 10.1016/s0960-894x(02)00886-7. [DOI] [PubMed] [Google Scholar]
- Brown A. K. Fujita M. Fujimura Y. Liow J. S. Stabin M. Ryu Y. H. Imaizumi M. Hong J. Pike V. W. Innis R. B. J. Nucl. Med. 2007;48:2072–2079. doi: 10.2967/jnumed.107.044842. [DOI] [PubMed] [Google Scholar]
- Buck J. R. McKinley E. T. Hight M. R. Fu A. Tang D. Smith R. A. Tantawy M. N. Peterson T. E. Colvin D. Ansari M. S. Baldwin R. M. Zhao P. Guleryuz S. Manning H. C. J. Nucl. Med. 2011;52:107–114. doi: 10.2967/jnumed.110.081703. [DOI] [PMC free article] [PubMed] [Google Scholar]
- Chauveau F. Boutin H. Van Camp N. Thominiaux C. Hantraye P. Rivron L. Marguet F. Castel M. N. Rooney T. Benavides J. Dolle F. Tavitian B. Eur. J. Nucl. Med. Mol. Imaging. 2011;38:509–514. doi: 10.1007/s00259-010-1628-5. [DOI] [PubMed] [Google Scholar]
- Fookes C. J. Pham T. Q. Mattner F. Greguric I. Loc'h C. Liu X. Berghofer P. Shepherd R. Gregoire M. C. Katsifis A. J. Med. Chem. 2008;51:3700–3712. doi: 10.1021/jm7014556. [DOI] [PubMed] [Google Scholar]
- James M. L. Fulton R. R. Vercoullie J. Henderson D. J. Garreau L. Chalon S. Dolle F. Costa B. Guilloteau D. Kassiou M. J. Nucl. Med. 2008;49:814–822. doi: 10.2967/jnumed.107.046151. [DOI] [PubMed] [Google Scholar]
- Wadsworth H. Jones P. A. Chau W. F. Durrant C. Fouladi N. Passmore J. O'Shea D. Wynn D. Morisson-Iveson V. Ewan A. Thaning M. Mantzilas D. Gausemel I. Khan I. Black A. Avory M. Trigg W. Bioorg. Med. Chem. Lett. 2012;22:1308–1313. doi: 10.1016/j.bmcl.2011.12.084. [DOI] [PubMed] [Google Scholar]
- Belloli S. Moresco R. M. Matarrese M. Biella G. Sanvito F. Simonelli P. Turolla E. Olivieri S. Cappelli A. Vomero S. Galli-Kienle M. Fazio F. Neurochem. Int. 2004;44:433–440. doi: 10.1016/j.neuint.2003.08.006. [DOI] [PubMed] [Google Scholar]
- Owen D. R. Howell O. W. Tang S. P. Wells L. A. Bennacef I. Bergstrom M. Gunn R. N. Rabiner E. A. Wilkins M. R. Reynolds R. Matthews P. M. Parker C. A. J. Cereb. Blood Flow Metab. 2010;30:1608–1618. doi: 10.1038/jcbfm.2010.63. [DOI] [PMC free article] [PubMed] [Google Scholar]
- Kreisl W. C. Fujita M. Fujimura Y. Kimura N. Jenko K. J. Kannan P. Hong J. Morse C. L. Zoghbi S. S. Gladding R. L. Jacobson S. Oh U. Pike V. W. Innis R. B. NeuroImage. 2010;49:2924–2932. doi: 10.1016/j.neuroimage.2009.11.056. [DOI] [PMC free article] [PubMed] [Google Scholar]
- Yoder K. K. Nho K. Risacher S. L. Kim S. Shen L. Saykin A. J. J. Nucl. Med. 2013;54:1320–1322. doi: 10.2967/jnumed.112.118885. [DOI] [PMC free article] [PubMed] [Google Scholar]
- Owen D. R. Gunn R. N. Rabiner E. A. Bennacef I. Fujita M. Kreisl W. C. Innis R. B. Pike V. W. Reynolds R. Matthews P. M. Parker C. A. J. Nucl. Med. 2011;52:24–32. doi: 10.2967/jnumed.110.079459. [DOI] [PMC free article] [PubMed] [Google Scholar]
- Owen D. R. Yeo A. J. Gunn R. N. Song K. Wadsworth G. Lewis A. Rhodes C. Pulford D. J. Bennacef I. Parker C. A. StJean P. L. Cardon L. R. Mooser V. E. Matthews P. M. Rabiner E. A. Rubio J. P. J. Cereb. Blood Flow Metab. 2012;32:1–5. doi: 10.1038/jcbfm.2011.147. [DOI] [PMC free article] [PubMed] [Google Scholar]
- Kreisl W. C. Jenko K. J. Hines C. S. Hyoung Lyoo C. Corona W. Morse C. L. Zoghbi S. S. Hyde T. Kleinman J. E. Pike V. W. McMahon F. J. Innis R. B. J. Cereb. Blood Flow Metab. 2013;33:53–58. doi: 10.1038/jcbfm.2012.131. [DOI] [PMC free article] [PubMed] [Google Scholar]
- Costa B. Pini S. Gabelloni P. Da Pozzo E. Abelli M. Lari L. Preve M. Lucacchini A. Cassano G. B. Martini C. Endocrinology. 2009;150:5438–5445. doi: 10.1210/en.2009-0752. [DOI] [PubMed] [Google Scholar]
- Ikawa M. Lohith T. G. Shrestha S. Telu S. Zoghbi S. S. Castellano S. Taliani S. Da Settimo F. Fujita M. Pike V. W. Innis R. B. Biomarkers Consortium Radioligand Project T. J. Nucl. Med. 2017;58:320–325. doi: 10.2967/jnumed.116.178996. [DOI] [PMC free article] [PubMed] [Google Scholar]
- MacAskill M. G. Stadulyte A. Williams L. Morgan T. E. F. Sloan N. L. Alcaide-Corral C. J. Walton T. Wimberley C. McKenzie C. A. Spath N. B. Mungall W. BouHaidar R. Dweck M. R. Gray G. A. Newby D. E. Lucatelli C. Sutherland A. Pimlott S. Tavares A. A. S. J. Nucl. Med. 2021;62:536–544. doi: 10.2967/jnumed.120.243600. [DOI] [PMC free article] [PubMed] [Google Scholar]
- Berroteran-Infante N. Kalina T. Fetty L. Janisch V. Velasco R. Vraka C. Hacker M. Haug A. R. Pallitsch K. Wadsak W. Mitterhauser M. Eur. J. Med. Chem. 2019;176:410–418. doi: 10.1016/j.ejmech.2019.05.008. [DOI] [PubMed] [Google Scholar]
- Tiwari A. K. Ji B. Yui J. Fujinaga M. Yamasaki T. Xie L. Luo R. Shimoda Y. Kumata K. Zhang Y. Hatori A. Maeda J. Higuchi M. Wang F. Zhang M. R. Theranostics. 2015;5:961–969. doi: 10.7150/thno.12027. [DOI] [PMC free article] [PubMed] [Google Scholar]
- Qiao L. Fisher E. McMurray L. Milicevic Sephton S. Hird M. Kuzhuppilly-Ramakrishnan N. Williamson D. J. Zhou X. Werry E. Kassiou M. Luthra S. Trigg W. Aigbirhio F. I. ChemMedChem. 2019;14:982–993. doi: 10.1002/cmdc.201900023. [DOI] [PMC free article] [PubMed] [Google Scholar]
- Katsifis A. Loc'h C. Henderson D. Bourdier T. Pham T. Greguric I. Lam P. Callaghan P. Mattner F. Eberl S. Fulham M. J. Eur. J. Nucl. Med. Mol. Imaging. 2017;44:296–307. doi: 10.1007/s00259-016-3517-z. [DOI] [PubMed] [Google Scholar]
- Eberl S. Katsifis A. Peyronneau M. A. Wen L. Henderson D. Loc'h C. Greguric I. Verschuer J. Pham T. Lam P. Mattner F. Mohamed A. Fulham M. J. Eur. J. Nucl. Med. Mol. Imaging. 2017;44:296–307. doi: 10.1007/s00259-016-3517-z. [DOI] [PubMed] [Google Scholar]
- Kazemi F. Massah A. R. Javaherian M. Tetrahedron. 2007;63:5083–5087. [Google Scholar]
- Anholt R. R. Murphy K. M. Mack G. E. Snyder S. H. J. Neurosci. 1984;4:593–603. doi: 10.1523/JNEUROSCI.04-02-00593.1984. [DOI] [PMC free article] [PubMed] [Google Scholar]
- Benavides J. Malgouris C. Imbault F. Begassat F. Uzan A. Renault C. Dubroeucq M. C. Gueremy C. Le Fur G. Arch. Int. Pharmacodyn. Ther. 1983;266:38–49. [PubMed] [Google Scholar]
- Gehlert D. R. Yamamura H. I. Wamsley J. K. Naunyn-Schmiedeberg's Arch. Pharmacol. 1985;328:454–460. doi: 10.1007/BF00692915. [DOI] [PubMed] [Google Scholar]
- Zhang M. R. Ogawa M. Maeda J. Ito T. Noguchi J. Kumata K. Okauchi T. Suhara T. Suzuki K. J. Med. Chem. 2006;49:2735–2742. doi: 10.1021/jm060006k. [DOI] [PubMed] [Google Scholar]
- Gildersleeve D. L. Van Dort M. E. Johnson J. W. Sherman P. S. Wieland D. M. Nucl. Med. Biol. 1996;23:23–28. doi: 10.1016/0969-8051(95)02007-1. [DOI] [PubMed] [Google Scholar]
- Mattner F. Mardon K. Katsifis A. Eur. J. Nucl. Med. Mol. Imaging. 2008;35:779–789. doi: 10.1007/s00259-007-0645-5. [DOI] [PubMed] [Google Scholar]
- Carayon P. Portier M. Dussossoy D. Bord A. Petitpretre G. Canat X. Le Fur G. Casellas P. Blood. 1996;87:3170–3178. [PubMed] [Google Scholar]
- Canat X. Carayon P. Bouaboula M. Cahard D. Shire D. Roque C. Le Fur G. Casellas P. Life Sci. 1993;52:107–118. doi: 10.1016/0024-3205(93)90293-c. [DOI] [PubMed] [Google Scholar]
- Kanegawa N. Collste K. Forsberg A. Schain M. Arakawa R. Jucaite A. Lekander M. Olgart Hoglund C. Kosek E. Lampa J. Halldin C. Farde L. Varrone A. Cervenka S. Brain, Behav., Immun. 2016;54:149–157. doi: 10.1016/j.bbi.2016.01.019. [DOI] [PubMed] [Google Scholar]
- Di Grigoli G. Monterisi C. Belloli S. Masiello V. Politi L. S. Valenti S. Paolino M. Anzini M. Matarrese M. Cappelli A. Moresco R. M. Mol. Imaging. 2015;14:7–17. doi: 10.2310/7290.2015.00007. [DOI] [PubMed] [Google Scholar]
- Vasdev N. Green D. E. Vines D. C. McLarty K. McCormick P. N. Moran M. D. Houle S. Wilson A. A. Reilly R. M. Cancer Biother. Radiopharm. 2013;28:254–259. doi: 10.1089/cbr.2012.1196. [DOI] [PubMed] [Google Scholar]
- Black K. L. Ikezaki K. Santori E. Becker D. P. Vinters H. V. Cancer. 1990;65:93–97. doi: 10.1002/1097-0142(19900101)65:1<93::aid-cncr2820650120>3.0.co;2-1. [DOI] [PubMed] [Google Scholar]
- Wu C. Yue X. Lang L. Kiesewetter D. O. Li F. Zhu Z. Niu G. Chen X. Theranostics. 2014;4:546–555. doi: 10.7150/thno.8159. [DOI] [PMC free article] [PubMed] [Google Scholar]
- Winkeler A. Boisgard R. Martin A. Tavitian B. J. Nucl. Med. 2010;51:1–4. doi: 10.2967/jnumed.109.065680. [DOI] [PubMed] [Google Scholar]
- Zheng J. Boisgard R. Siquier-Pernet K. Decaudin D. Dolle F. Tavitian B. Mol. Pharmaceutics. 2011;8:823–832. doi: 10.1021/mp100433c. [DOI] [PubMed] [Google Scholar]
- Primofiore G. Da Settimo F. Taliani S. Simorini F. Patrizi M. P. Novellino E. Greco G. Abignente E. Costa B. Chelli B. Martini C. J. Med. Chem. 2004;47:1852–1855. doi: 10.1021/jm030973k. [DOI] [PubMed] [Google Scholar]
- Da Settimo F. Simorini F. Taliani S. La Motta C. Marini A. M. Salerno S. Bellandi M. Novellino E. Greco G. Cosimelli B. Da Pozzo E. Costa B. Simola N. Morelli M. Martini C. J. Med. Chem. 2008;51:5798–5806. doi: 10.1021/jm8003224. [DOI] [PubMed] [Google Scholar]
- Homes T. P. Mattner F. Keller P. A. Katsifis A. Bioorg. Med. Chem. 2006;14:3938–3946. doi: 10.1016/j.bmc.2006.01.039. [DOI] [PubMed] [Google Scholar]
- Pike V. W. Taliani S. Lohith T. G. Owen D. R. Pugliesi I. Da Pozzo E. Hong J. Zoghbi S. S. Gunn R. N. Parker C. A. Rabiner E. A. Fujita M. Innis R. B. Martini C. Da Settimo F. J. Med. Chem. 2011;54:366–373. doi: 10.1021/jm101230g. [DOI] [PMC free article] [PubMed] [Google Scholar]
- Taliani S. Pugliesi I. Da Settimo F. Curr. Top. Med. Chem. 2011;11:860–886. doi: 10.2174/156802611795165142. [DOI] [PubMed] [Google Scholar]
- Trapani G. Franco M. Ricciardi L. Latrofa A. Genchi G. Sanna E. Tuveri F. Cagetti E. Biggio G. Liso G. J. Med. Chem. 1997;40:3109–3118. doi: 10.1021/jm970112+. [DOI] [PubMed] [Google Scholar]
- Trapani G. Laquintana V. Denora N. Trapani A. Lopedota A. Latrofa A. Franco M. Serra M. Pisu M. G. Floris I. Sanna E. Biggio G. Liso G. J. Med. Chem. 2005;48:292–305. doi: 10.1021/jm049610q. [DOI] [PubMed] [Google Scholar]
- Bourguignon J. J., Endogenous and synthetic ligand of mitochondrial benzodiazepine receptors:structure-affinity relationships, in Peripheral Benzodiazepine Receptors, Academic Press, London, 1993 [Google Scholar]
- Denora N. Laquintana V. Pisu M. G. Dore R. Murru L. Latrofa A. Trapani G. Sanna E. J. Med. Chem. 2008;51:6876–6888. doi: 10.1021/jm8006728. [DOI] [PubMed] [Google Scholar]
- Dumont F. Waterhouse R. N. Montoya J. A. Mattner F. Katsifis A. Kegeles L. S. Laruelle M. Nucl. Med. Biol. 2003;30:435–439. doi: 10.1016/s0969-8051(03)00006-4. [DOI] [PubMed] [Google Scholar]
- Mattner F. Mardon K. Loc'h C. Katsifis A. Life Sci. 2006;79:287–294. doi: 10.1016/j.lfs.2006.01.006. [DOI] [PubMed] [Google Scholar]
- Cheng Y. Prusoff W. H. Biochem. Pharmacol. 1973;22:3099–3108. doi: 10.1016/0006-2952(73)90196-2. [DOI] [PubMed] [Google Scholar]
- Katsifis A. Loc'h C. Henderson D. Bourdier T. Pham T. Greguric I. Lam P. Callaghan P. Mattner F. Eberl S. Fulham M. Nucl. Med. Biol. 2011;38:137–148. doi: 10.1016/j.nucmedbio.2010.07.008. [DOI] [PubMed] [Google Scholar]
Associated Data
This section collects any data citations, data availability statements, or supplementary materials included in this article.


