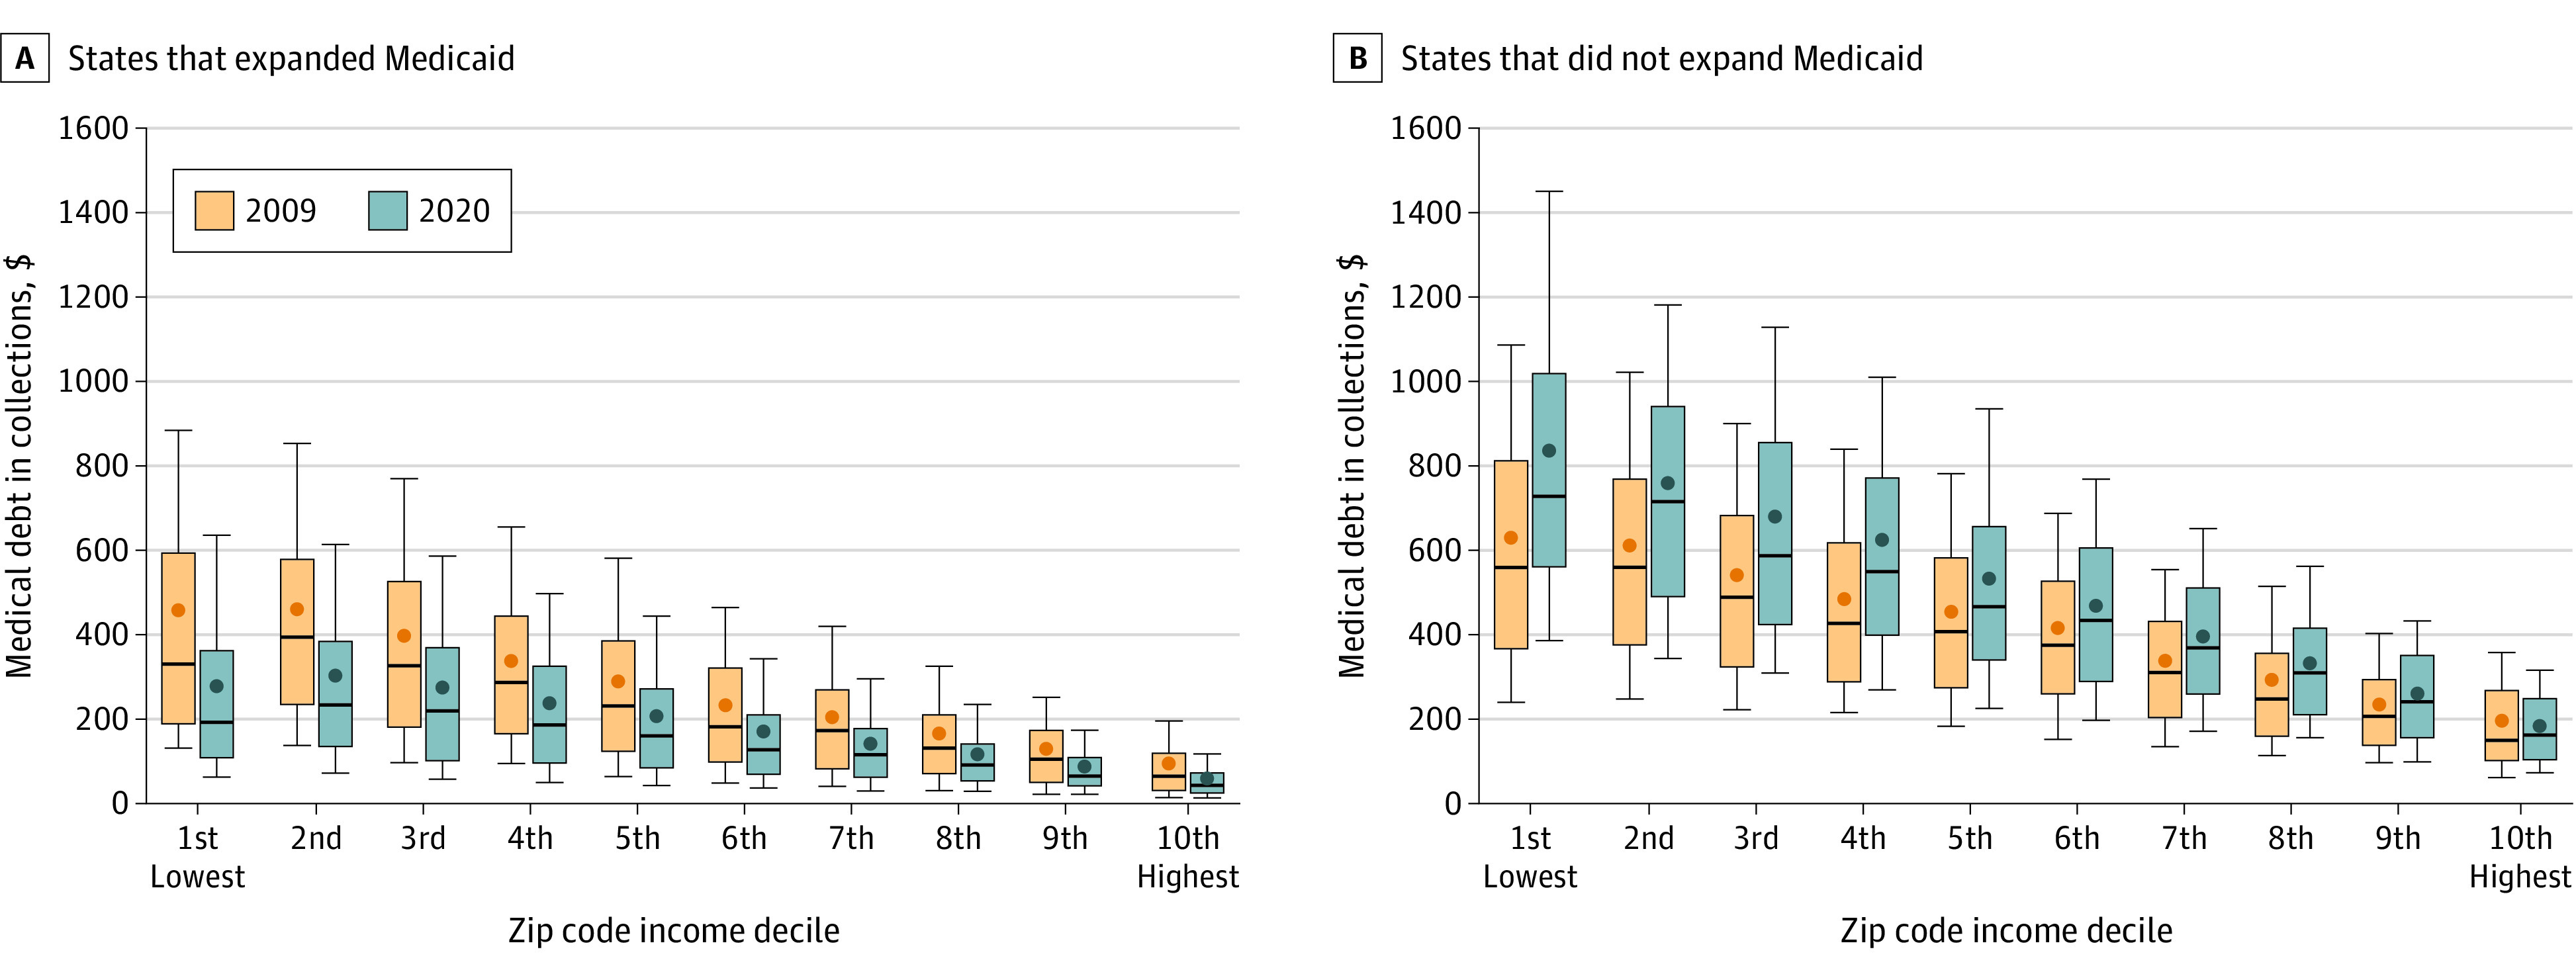
Figure 4. Flow of Medical Debt by State Medicaid Expansion Status and Zip Code Income Decile in 2009 and 2020.

The dots are means, the black horizontal lines are medians, the boxes are the interquartile ranges, and whiskers are the 10 to 90 range for flow of zip code level medical debt by zip code income decile as of June 2020. To maintain consistent income deciles across expansion and nonexpansion states, zip codes were assigned income deciles based on their population-weighted rank in the national distribution. The median number of zip codes in each income decile was 3474 (interquartile range, 2396-3764) in 2009 and 3474 (interquartile range, 2398-3762) in 2020.
