Abstract
Objective
To study the link between a high body mass index (BMI) in childhood and the occurrence of pediatric-onset multiple sclerosis (POMS) and to compare, within the MS population, the clinical-radiologic-biological characteristics, according to BMI.
Methods
A case-control study comparing BMI data of 60 patients with POMS (39 girls and 21 boys) at Bicêtre Hospital with that of 113 non-neurologic controls NNCs (68 girls and 45 boys) and 18,614 healthy controls HCs (9,271 girls and 9,343 boys) was performed. Crude BMI (cBMI), residual BMI (rBMI = measured BMI − expected BMI for age), z-score (rBMI/SD), and adult equivalent categories (International Obesity Task Force ≥25 = overweight, ≥30 = obese) were assessed.
Results
In boys, cBMI and rBMI were significantly higher in patients with POMS compared with NNCs (cBMI: +2.9; rBMI: +2.95, p < 0.01) and HCs (cBMI: +2.04, p < 0.01). In girls, cBMI or rBMI did not differ between POMS and NNCs patients (cBMI p = 0.4; rBMI p = 0.44) but with HCs (cBMI +0.99, p < 0.01). CSF inflammatory markers increased with BMI in prepubertal patients (p < 0.01), whereas vitamin D level at diagnosis was lower in boys with higher BMI (p = 0.016). Increased BMI was not associated with clinical and radiologic disease characteristics.
Conclusions
Overweight and obesity are more frequently observed at diagnosis, particularly in boys with POMS compared with non-neurologic controls and French HCs. Moreover, BMI is related to initial inflammation in the CSF in prepubertal patients with POMS suggesting an interaction between excess body fat, sexual hormones, and POMS occurrence.
Multiple sclerosis (MS), a chronic inflammatory and autoimmune disease of the CNS, is the most common demyelinating disease in the world. Pediatric onset of MS (POMS) concerns 3%–10% of patients with MS and can occur before age 10 years in 1% of patients with MS.1–4 The annual incidence is 0.05–2.85 per 100,000 children depending on the country, and the patient's sex ratio is balanced in childhood but becomes distorted toward females after puberty.5 A higher relapse rate is observed in children despite better recoveries after relapses, and a slower evolution toward a secondarily progressive disease has been described.6,7 POMS is probably the result of the interaction between genetic and environmental factors resulting in neuroinflammation. Among these factors, HLADR DRB1*15:01,8–10 herpesviridae infections, particularly Epstein-Barr virus infection,11–15 vitamin D deficiency,16–18 diet and microbiota,19 and ethnic origin20 have been studied. An increasing but small number of studies on the potential link between childhood obesity and the occurrence of MS in children have emerged in recent years. The studies have conflicting results, but they seem to support the role of obesity in the occurrence of MS in the United States21–24 and in German populations.25 In France, body mass index (BMI) in the healthy pediatric population increased in the 1970s and 1980s, before stabilizing since the end of the 1990s. The prevalence of overweight and obesity is estimated to be, respectively, 13% and 4% (data from the national ESTEBAN study: Etude de SanTé sur l'Environnement, la Biosurveillance, l'Activité physique et la Nutrition, 2015). The relationship between POMS and obesity has not been studied yet. The causal role and mechanisms involved in obesity-mediated neuroinflammation remain unclear.
Low-grade inflammation mediated by obesity is thought to be able to lead to neuroinflammation via various mechanisms such as disruption of the blood-brain barrier (BBB) or primary activation of microglia in the CNS in response to adipokines released into the peripheral circulation by fatty tissues.26–28
Here, the first objective was to analyze the link between a high BMI in children, defining overweight and obesity, and the occurrence of POMS in the French pediatric population. Our second objective was to compare, in a French POMS group of patients, the clinical, biological, and radiologic characteristics between patients who were overweight or obese and those who had a normal BMI.
Methods
Standard Protocol Approvals, Registrations, and Patient Consents
The clinical and biological data of the patients came from the biobank of the national cohort of the first demyelinating episode KidBiosep 2004 (No. 910506), which has been authorized by the National Commission for Information and Liberties. An informed consent form was signed by the parents of each child included.
Participants With MS
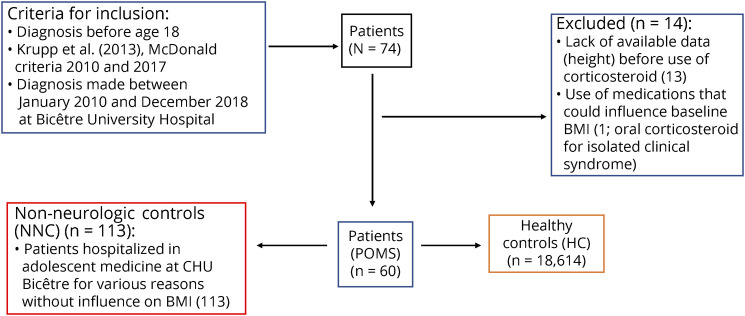
Seventy-four patients with POMS (Figure 1), followed in the national referral center for rare inflammatory brain and spinal diseases and part of the national KidBiosep cohort, were included. The inclusion criteria were as follows: age <18 years at diagnosis of MS; diagnosed with MS between January 2010 and December 2018; and diagnosis of MS in accordance with IPMSSG criteria, 2013 criteria until 2017 and then with 2017 McDonald criteria. We decided to exclude from the analysis patients whose BMI at the first demyelinating episode (before any oral or IV corticosteroid treatment) was not available. We did not include patients who took other treatments likely to influence BMI (tricyclic antidepressants, neuroleptics, long-term corticosteroids, insulin, beta-blockers, sodium valproate, and lithium) or who had other concomitant pathologies likely to influence BMI such as respiratory diseases (asthma and cystic fibrosis), digestive (celiac disease and chronic inflammatory bowel disease), endocrine (diabetes, adrenal insufficiency, hypercorticism, and hypo or hyperthyroidism), neurologic disease other than multiple sclerosis, psychiatric difficulties (depression, anorexia nervosa, and bulimia), tumoral, genetic, nephrologic (tubulopathies), or cardiac problems (congenital heart failure). A total of 14 patients had to be excluded (n = 13/14 with lack of availability of height at diagnosis; n = 1/14 took oral corticosteroids for clinically isolated syndrome), based on the exclusion criteria detailed above (Figure 1).
Figure 1. Flowchart.
BMI = body mass index; POMS = pediatric-onset multiple sclerosis.
Control Groups
Non-neurologic Controls
The local control group consisted of 113 patients younger than 18 years. Their clinical data had been collected during hospitalization in the Adolescent Medicine Department of Bicêtre Hospital between January 2014 and February 2019. They were subject to the same exclusion criteria as patients with POMS and were not expected to present any symptoms suggesting a demyelinating episode (reasons for consultation listed in eTable 2, links.lww.com/NXI/A516).
Healthy Controls
We finally used a data set on 18,614 healthy French children aged between 5 and 18 years as the second control group (providing 71,337 pairs of weight and height measurements). This healthy control (HC) group comes from various longitudinal studies conducted in France between 1981 and 2007 on the growth of the French pediatric population.29 We used this data set to model the mean corpulence (BMI) trajectories of healthy French boys and girls (data not shown), and these trajectories served as a reference against which to compare our patients with POMS and non-neurologic controls (NNCs).
Data Collection
The data were collected retrospectively (list of study variables in eTable 1 links.lww.com/NXI/A516). Weight was measured in kilogram (kg) and height in meter (m). BMI was calculated according to international recommendations (BMI = weight [kg]/height [m]2). The 3 International Obesity Task Force (IOTF) categories (normal, overweight, and obesity) were determined by plotting the patient's BMI on adult equivalent curves according to international recommendations (IOTF). An IOTF of less than 25 indicated a BMI in the normal range; between 25 and <30 defined overweight, and equal to or greater than 30 defined obesity.30 When information on height at the time of the diagnosis was not available, it was extrapolated from the child's height curve, comprising at least 3 points, or a curve consisting of at least 2 points framing the diagnosis period or, in rare cases, within 3 months before or after hospitalization.
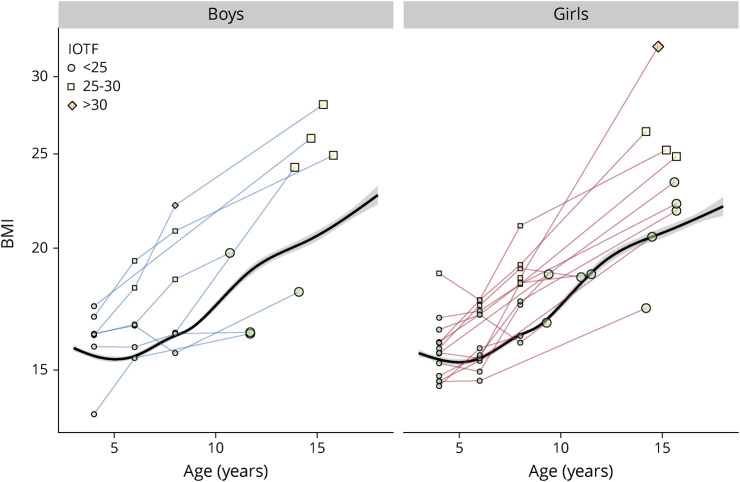
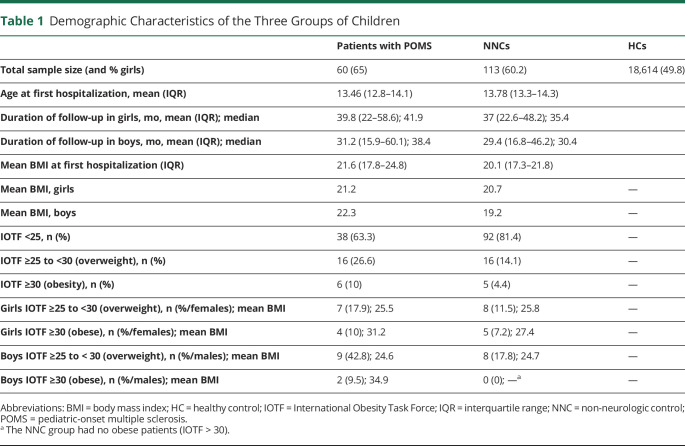
For NNCs, data on date of birth, sex, weight, and height at hospital admission were collected. The BMI and IOTF categories were determined as for the patients with POMS. To calculate the residual BMIs (rBMIs) and z-scores, we first adjusted a generalized additive model (generalized additive model “gam” function) to model how BMI changes with increasing age for each sex in HC. Using smooth gam models allows us to describe the shape of the BMI age trajectories without having to make specific constrained hypotheses (these age trajectories are the black smooth lines on Figure 4). We then compared the measured BMI of NNCs and of patients with POMS with the BMI predicted with the gam models, given the age and sex of each patient, to compute the rBMI (rBMI = raw BMI − mean BMI of a healthy child of the same age and sex). To compute the z-scores, we divided the rBMI by the estimated standard deviance of the BMI of HC. For each POMS and NNC patient, we computed a standard deviance using a subset of the healthy children database that included the BMI measurements of healthy children whose age difference did not exceed 1.5 years compared with the patient. The patients who are more corpulent than an average healthy French child of the same age and sex have positive rBMI and z-score. Those who are leaner have negative rBMI and z-score. rBMI and z-score thus provide 2 (highly correlated) quantitative measurements of the patient's corpulence relative to its pediatric fellow citizen while controlling for its sex and age. Table 1 summarizes the main characteristics of the 3 groups of children.
Figure 4. BMI Age-Trajectories.
There are plotter for several young boys and girls before being diagnosed for MS. The last measurement (larger plot) has been performed at the occasion of their first hospitalization for MS. The black smooth line is the mean BMI age trajectory of the healthy controls. BMI = body mass index; IOTF = International Obesity Task Force; MS = multiple sclerosis.
Table 1.
Demographic Characteristics of the Three Groups of Children
Statistical Analysis
Statistical analyses were performed using R 4.0.3 software, and we used the ggplot2 and visreg packages to generate the figures showing the models' predictions. We first analyzed the BMI to search for any effect of sex and child type (POMS, NNC, and HC) with a generalized additive model (gam), which enabled to take into account the fact that BMI depends on an unknown nonlinear function of age (smooth term). We then completed this analysis with generalized linear models (GLMs, Gaussian) to quantify if and how the rBMI and z-score differed among our 4 groups of patients (POMS and NNC, boys and girls). The 3 IOTF categories were analyzed with binomial glm models to study the potential influence of sex and patient type (POMS vs NNC) on the probability to belong to each of these categories. More specifically, we analyzed if and how the probability that a child had an IOTF higher than 30 (resp. 25) was determined by its sex, age, and state (POMS vs NNC) using binomial model. Linear models (GLM) were used by applying Gaussian models for continuous variables, binomial models for binomial variables, and Poisson or quasi-Poisson models for discrete positive variables corresponding to counts. The BMI trajectory of some of the children in the cohort was also observed to define the anteriority of obesity. In the second part of the study, the effect of BMI on various clinical, biological, and radiologic POMS variables was studied within the POMS patient cohort. Statistical tests used for each variable of the study and p values are detailed in eTables 1, 3, and 4 (links.lww.com/NXI/A516). The annual rate of clinical relapses, age at diagnosis, symptom at diagnosis, C-reactive protein (CRP) and vitamin D levels, presence or absence of contrast enhancement on initial MRI, number of T2 lesions on initial MRI, presence of inflammation on the initial CSF, and delay with the second relapse were analyzed as a function of sex, age (except for age at diagnosis), and rBMI at diagnosis.
Data Availability
Anonymized data will be shared by request from any qualified investigator.
Results
Data from 60 patients (39 girls and 21 boys, mean age 13.46 [12.8–14.1] years) diagnosed with MS before age 18 years were analyzed. They were compared with NNCs (68 girls and 45 boys, mean age 13.8 [13.3–14.3]) years and with a larger group of HCs (9,271 girls and 9,343 boys) (Table 1).
Body Mass Index
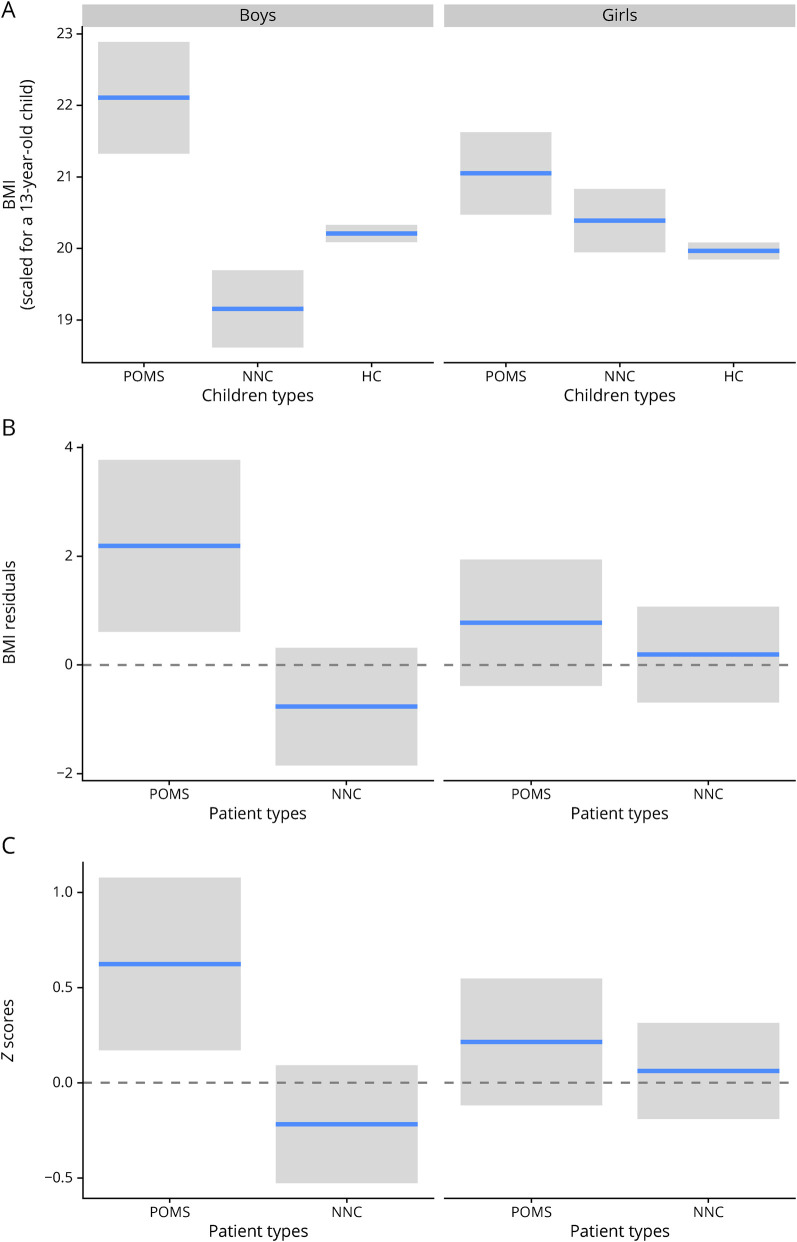
We first studied whether the BMI differed among the 3 types of children (POMS, NNC, and HC). This model shows that BMI varies with age and is also affected by an interaction between child's sex and type (Figure 2A). The Fisher statistics with 2 degrees of freedom for this sex × type interaction equal 9.1. The p value derived from comparing this F statistics to the Fisher distribution equals 0.0001. We express this as F2df = 9.1, p < 0.001). The boys with POMS had on average a higher BMI than the NNCs (+2.9 BMI, F1 = 10, p < 0.001) and healthy boys (+2.06, F1 = 26, p < 0.001). We also found that the NNCs had a slightly lower BMI than the HCs (−0.9, F1 = 11.8, p = 0.01, eTable 3, links.lww.com/NXI/A516). The difference among the 3 groups was less pronounced for girls: pairwise comparisons failed to detect any significant difference between the NNCs and the 2 other groups (p > 0.19), but we found that the girls with POMS were on average slightly more corpulent that the healthy ones (+0.99, F1 = 8.7, p < 0.01) (Figure 2A).
Figure 2. Effects of Sex and Children Type on BMI.
This figure presents on the panel A the BMI predicted by the gam model for each combination of sex and children type. To control for the effect of patients' age, we present the predictions (horizontal blue lines) and their 95% CIs for a 13-year-old child. The panel B represents the BMI in terms of difference between the patient's BMI and the expected BMI of a HC (rBMI). The mean z-scores, which correspond to the rBMI divided by the SD of the BMI of HC, are presented on panel C. BMI = body mass index; HC = healthy control; NNC = non-neurologic control; POMS = pediatric-onset multiple sclerosis; rBMI = residual BMI.
rBMI and Z-Score
We found significant interaction between sex and patient type (POMS vs NNC) for both z-score (likelihood ratio χ2 value of 3.84 for 1 degree of freedom, expressed as χ21 = 3.84, p = 0.049) and rBMI (χ21 = 3.73, p = 0.05). Boys with POMS had a higher rBMI (+2.95) and z-score (+0.84) than the NNCs (χ21 ≥ 10.2, p ≤ 0.0013, Figure 2C), whereas this was not the case for girls (p > 0.44). Only boys with POMS had an rBMI significantly different from zero (p = 0.007), zero corresponding to HCs. They had an average BMI +2.19 points higher than an average healthy French boy of similar age (Figure 2B).
IOTF Categories
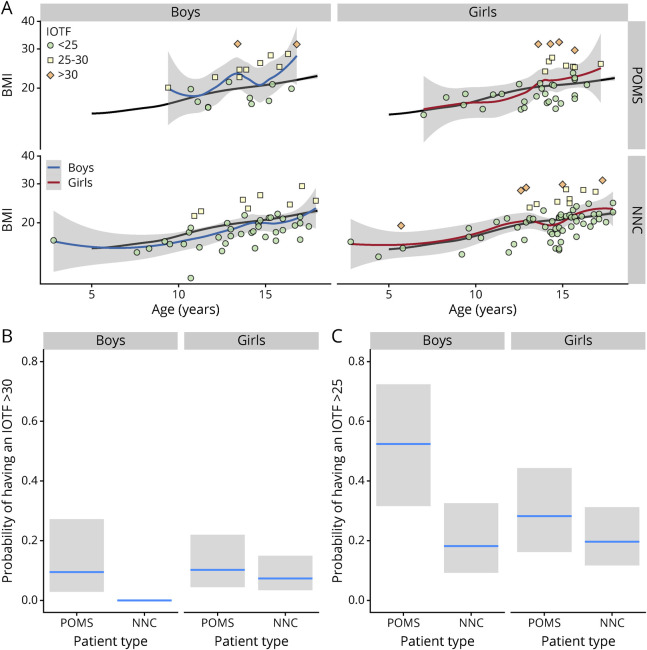
The probability of being obese was also found to depend on a sex × patient type interaction (IOTF ≥30, χ21 = 4.23, p = 0.039, Figure 3). The percentage of obese girls was similar among patients with POMS (10%) and NNCs(7.3%, p = 0.6), but more obese children were observed among the boys with POMS (9.5%) that among the NNC boys (0%, χ21 = 14.3, p < 0.001). When we included the overweight children (IOTF ≥25), the sex × patient type interaction was not significant anymore, and we found that on average, the children with POMS (boys and girls) were more likely to be overweight or obese than the NNCs (52% vs 18%, p = 0.01, Figure 3).
Figure 3. IOTF Categories and Patient Types.
The panel A represents the BMI as a function of age for the patients with POMS (upper line) and NNCs (lower line) for the 2 sexes (boys on the left and girts on the right). The IOTF categories are represented with a color code. The black line is the mean BMI age trajectory computed for the healthy controls. The blue and red lines are the smoothed function adjusted for the 4 categories of and patient types corresponding to the 4 subpanels. Estimation of the proportion of patients having an IOTF larger than 30 (panel B, obese patients) or larger than 25 (panel C, overweight or obese patients) for each combination of sex and patient type (patient with POMS vs NNC). BMI = body mass index; IOTF = International Obesity Task Force; NNC = non-neurologic control; POMS = pediatric-onset multiple sclerosis.
The BMI age trajectories of some children with POMS who have been followed several years before their first hospitalization have been plotted on Figure 4 to verify whether their weight status (being overweight or obese) occurs earlier in life: overweight, when it was present, occurred mostly before age 6 years, and increased in most cases in the peripubertal period.
Clinical, Biological, and Radiologic Characteristics of the Patients With POMS
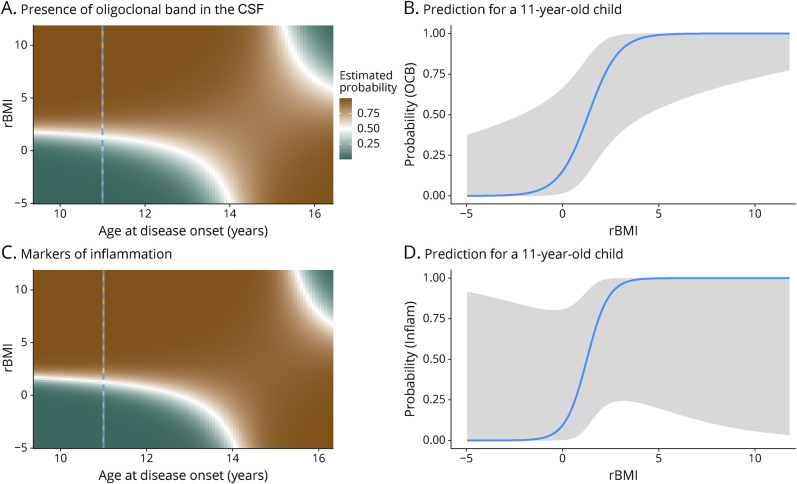
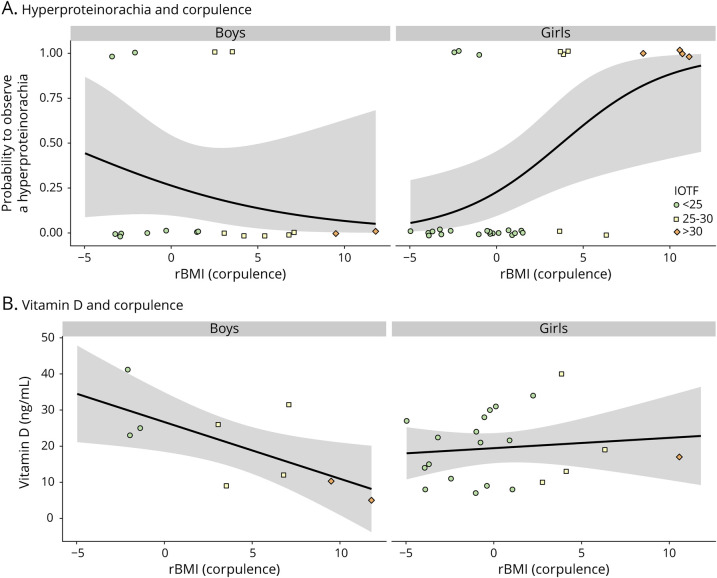
In the patients with POMS, the clinical, biological, and radiologic characteristics of the disease were studied according to patients' sex, rBMI, and age at diagnosis (models in eTable 4, links.lww.com/NXI/A516). The presence of oligoclonal band (OCB) in the CSF at diagnosis did not vary among sex but depended on an interaction between rBMI and age at disease onset (χ21 = 9.8; p = 0.0017): in children younger than 14 years, the probability of observing an OCB increased in overweight children, whereas this effect disappeared for patients older than 14 years (Figure 5, eTable 4). Among the available data on OCBs (65% of patients), 74.3% of patients had OCBs at diagnosis, whereas 25.7% did not. Concerning proteinorachia in the CSF, there was no association between hyperproteinorachia and body weight (rBMI) in boys (χ21 = 1.22, p = 0.27), whereas in girls, the probability of observing a hyperproteinorachia increased with rBMI (χ21 = 9.34, p = 0.002, Figure 6, eTable 4). The probability of observing any of the 3 markers of inflammation (hyperproteinorachia and/or pleocytosis and/or OCB) was similar for both sexes (p = 0.95). It increased with rBMI but only in younger children (<14 years, χ21 = 7.17, p = 0.007, Figure 5). Results were available for 81.7% of patients with POMS for hyperproteinorachia and pleocytosis. The mean vitamin D level at onset measured in patients with POMS was 19.4 ng/mL, corresponding to vitamin D deficiency. The values were measured in 60% of patients and ranged from 5 to 41.2 ng/mL. Vitamin D levels at onset decreased with increasing corpulence in boys (χ21 = 5.75, p = 0.016) but did not vary significantly with girls' rBMI (p = 0.62, Figure 6, eTable 4). Time interval between the first 2 relapses, probability to have more than 7 T2 lesions, and probability to have a gadolinium enhancement (at least 1 contrast-enhancing lesion) on initial MRI did not differ significantly according to patient rBMI (p = 0.47, eFigure 1, links.lww.com/NXI/A515, and eTable 4). Data concerning time interval before the second relapse were available for 100% of patients, about initial MRI for 80% of patients for number of lesions, and 75% for gadolinium enhancement.
Figure 5. Presence of OCBs and Inflammation in the CSF.
The 2-dimensional density plots (A and C) represent the prediction from the models age × rBMI interaction. The probability to observe an OCB (A) or any other marker of inflammation (pleocytosis and/or hyperproteinorachia and/or OCBs) (C) increases with the patient's corpulence in a prepubertal child (aged <14 years) but not in older patients. The panels B and D represent the model prediction for an 11-year-old patient (underlined with the dotted blues lines in panels A and C). OCB = oligoclonal band; rBMI = residual body mass index.
Figure 6. Effect of POMS Patients' Corpulence on Hyperproteinorachia and Vitamin D Levels.
(A) Predicted probabilities (black lines with 95% CI) of observing hyperproteinorachia (>0.4 g/L) as a function of corpulence (rBMI) at the first hospitalization for boys (nonsignificant effect of rBMI) and girls (the probability increases with patient's corpulence). (B) The vitamin D concentration (ng/mL) decreases with increasing corpulence in boys (black line with 95% CI, prediction from the model) but remains roughly constant in girls. The raw measurements are overlayed, and geometric shapes with different colors represent each patient's IOTF categories. IOTF = International Obesity Task Force; rBMI = residual body mass index; POMS = pediatric-onset multiple sclerosis.
The age at diagnosis, annualized relapse rate, first clinical signs, and CRP levels at diagnosis did not vary significantly according to the patient's corpulence, sex, or age at diagnosis (data not shown).
Discussion
We observed a higher prevalence of overweight and obesity in our sample of French patients with POMS at diagnosis, and one of our findings is the possible sexual dimorphism, attributing a higher risk to male sex. We have also noticed that overweight and obesity were associated with a higher probability to observe CSF inflammatory markers in younger patients. A particularity of this study is to have used 2 control groups. The first one (NNC) included children and adolescents followed in the Adolescent Medicine Department at Bicêtre Hospital. The second one was a large sample of the general healthy French pediatric population (HC). This allowed a double analysis and freed us from a selection bias or a lack of representativeness of the local control patient population.
The difference in prevalence of overweight/obesity was consistent whether expressed in terms of crude BMI to prevent the loss of raw information, corrected BMI called the residual BMI in this study, or the IOTF category. This study used the IOTF corresponding to the International Classification of Obesity and Overweight in children. This difference in prevalence was also found in girls with POMS, in whom there was a clear trend toward overweight and obesity at diagnosis, especially compared with HCs. The high prevalence of obesity and overweight at the time of diagnosis of MS has been observed in recent years in various studies, but it has never been reported in the French population. In California, obesity, and more specifically extreme obesity, has been found to be associated with MS, but contrary to our finding, it was observed in girls but not in boys. Obesity and overweight were characterized according to percentiles and gross BMI, without controlling for patients' age, or referring to adult IOTF curves. In another US study,22 the BMI and proportion of overweight or obese were higher in MS cases than in controls for both girls and boys, but these differences were reported to be stronger for girls, although the interaction between sex and corpulence was not specifically tested. Brenton et al. reported that the interaction was more pronounced in boys than girls, when studying gross BMI before and at diagnosis in 40 patients with pediatric MS vs 120 controls using US standard z-score BMI measurements, according to American curves and without referring to adult IOTF curves.23 Recently, an association between obesity and MS in German children in both sexes, comparing BMI in percentiles within 6 months of diagnosis, was demonstrated, supporting our results within a European population. They also highlight an association with a therapeutic failure of the first line of treatment in cases of obesity.25
In our study, BMI age trajectories of some patients suggest that overweight and obesity, particularly in boys, precede disease onset and occur in early childhood. Mice models support the hypothesis that the low-grade inflammatory state mediated by obesity and increased leptin in obese males could be responsible for testosterone depletion via downregulation of kisspeptin neurons and inhibition of the gonadotropic axis.31 Testosterone, known for its anti-inflammatory actions at the cerebral level, through its depletion during puberty, could explain the stronger association in our study between POMS and obesity in boys. In adult men with MS, testosterone depletion is associated with increased disease severity and neuroinflammation progression.32 Our results on the sex × patient type interactions have to be interpreted with caution, and these hypotheses need to be explored in other studies.
Several hypotheses have been put forward as to the genesis of obesity-mediated neuroinflammation. This first hypothesis would support the theory of migration of self-reactive lymphocytes produced in the periphery by adipose tissue. A recent study has shown the involvement of the BBB in neuroinflammation in obese mice (leptin receptor deficient). By using a protein kinase inhibitor protein kinase C β that enhances the BBB, neuroinflammation was significantly reduced.33–35 In addition, pericytes can produce proinflammatory mediators leading to a defect in the permeability of the BBB in a porcine model.36 Another hypothesis concerning obesity-mediated neuroinflammation could be a massive activation of the different cell types present in the CNS in response to changes in peripheral levels of certain mediators such as leptin and other adipokines.28 Adult studies have shown high plasma levels of leptin, resistin, fatty acid–binding protein (FABP), and low levels of adiponectin in patients with relapsing-remitting MS.37,38 In children, 1 study found that serum leptin and FABP levels were negatively correlated with the hazard of relapse and disability score, whereas adiponectin levels were negatively correlated with these parameters.27 Further studies are needed to deepen our understanding of POMS.
Clinical, biological, and radiologic comparative study in children with MS according to their BMI demonstrated that vitamin D deficiency in girls was noTable regardless of BMI, whereas in boys, mean vitamin D levels at onset decreased with BMI. These observations echo the various findings that vitamin D deficiency is a potential risk factor in the pathogenesis of POMS.24,39 Our results showed that hyperproteinorachia (>0.4 g/L) and OCBs presence were significantly associated with BMI in younger children only. Results were the same by coupling the 3 markers of CSF inflammation (hyperproteinorachia and/or pleocytosis and/or presence of OCB): the probability of observing a sign of inflammation increased with corpulence but only in younger children less than 14 years. The relationship with puberty was little studied in our analysis. A study that dissociates diagnosis in the prepubertal and postpubertal periods might be of interest if we consider the fact that hormonal status can potentially play a role in the development of POMS, as raised in several studies.22,40
The study limitations are a lack of power, related to sample size, but this is inherent to the fact that POMS is a rare disease in children. Interactions must be interpreted with caution given the sample size, and larger-scale studies are needed to confirm these results and clarify the role of sex hormones. In addition, the retrospective nature of the study resulted in a possible loss of information. This could explain the lack of significance in the girl subgroup.
In conclusion, overweight and obesity are observed more frequently in boys with POMS at the time of diagnosis compared with a local control population (NNC) and the healthy French pediatric population (HC). Excess body fat appears to influence initial inflammation in the CSF in prepubertal patients, but would not influence the annual relapse rate, the age of diagnosis of the pathology, or the initial clinical and radiologic parameters. Studies considering the hormonal influence of puberty would be necessary. These results need to be validated in prospective cohorts and highlight the importance of primary prevention of overweight and obesity in children, possibly involved in the processes of neuroinflammation.
Glossary
- BBB
blood-brain barrier
- BMI
body mass index
- CRP
C-reactive protein
- FABP
fatty acid–binding protein
- GLM
generalized linear model
- IOTF
International Obesity Task Force
- MS
multiple sclerosis
- NNC
non-neurologic control
- OCB
oligoclonal band
- POMS
pediatric-onset MS
- rBMI
residual BMI
Appendix 1. Authors
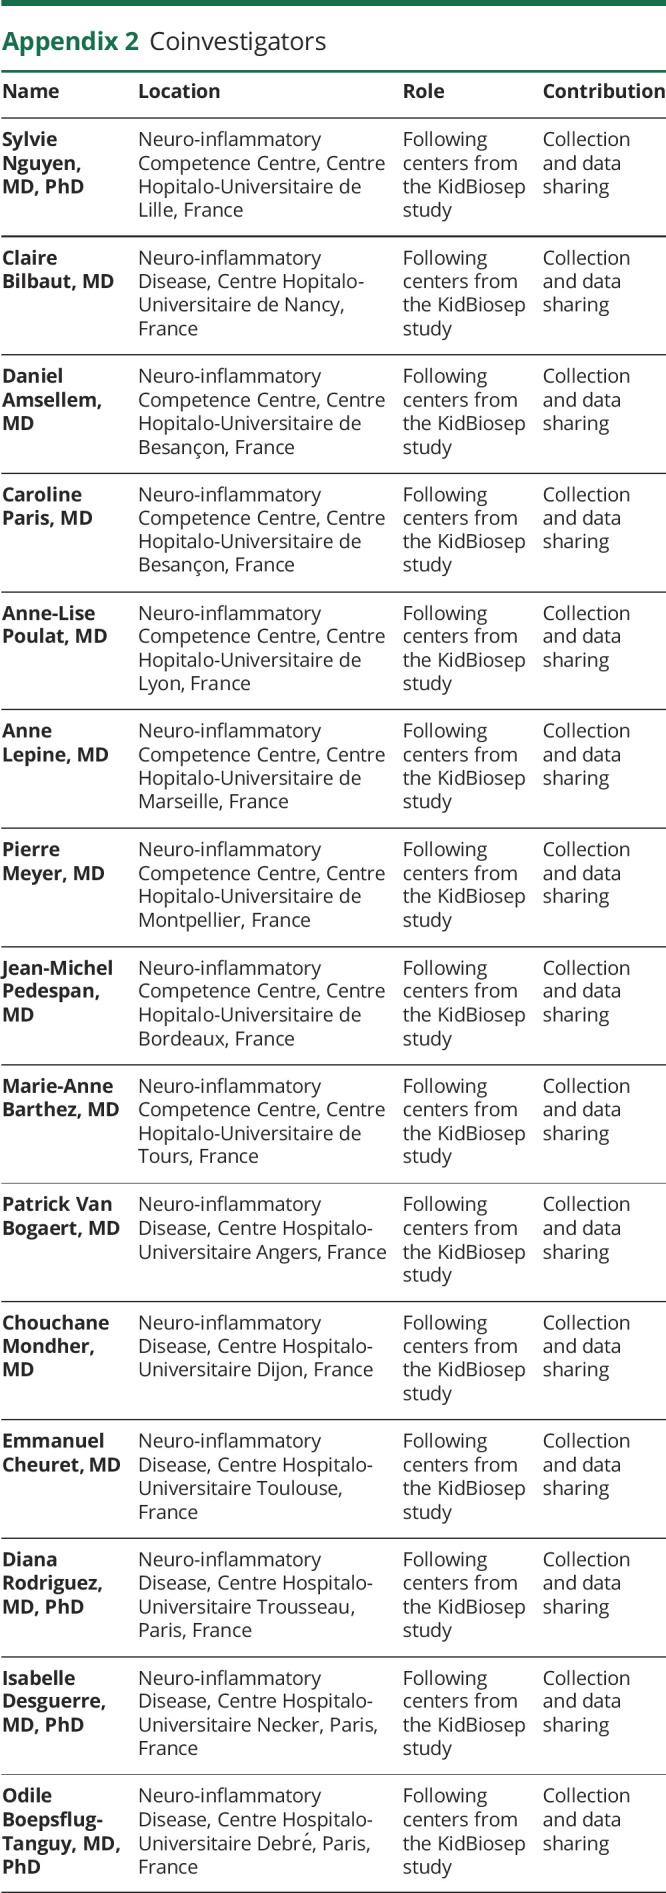
Appendix 2. Coinvestigators
Contributor Information
Gianpaolo De Filippo, Email: gianpaolo.defilippo@aphp.fr.
Hélène Maurey, Email: helene.maurey@aphp.fr.
Thomas Tully, Email: thomas.tully@sorbonne-universite.fr.
Kumaran Deiva, Email: kumaran.deiva@aphp.fr.
Study Funding
No targeted funding reported.
Disclosure
P. Milles, G. de Filippo, H. Maurey, and T. Tully report no disclosures relevant to the manuscript. K. Deiva participates in treatment studies in pediatric MS led by Novartis, Sanofi-Genzyme, and Biogen and received consultation fees from Novartis, Alexion, Viala, and Sanofi-Genzyme. Go to Neurology.org/NN for full disclosures.
References
- 1.Alroughani R, Boyko A. Pediatric multiple sclerosis: a review. BMC Neurol. 2018;18(1):27. [DOI] [PMC free article] [PubMed] [Google Scholar]
- 2.Boiko A, Vorobeychik G, Paty D, Devonshire V, Sadovnick D, University of British Columbia MS Clinic Neurologists. Early onset multiple sclerosis: a longitudinal study. Neurology. 2002;59(7):1006-1010. [DOI] [PubMed] [Google Scholar]
- 3.Renoux C, Vukusic S, Confavreux C. The natural history of multiple sclerosis with childhood onset. Clin Neurol Neurosurg. 2008;110(9):897-904. [DOI] [PubMed] [Google Scholar]
- 4.Deiva K. Pediatric onset multiple sclerosis. Rev Neurol (Paris). 2020;176(1–2):30-36. [DOI] [PubMed] [Google Scholar]
- 5.Waldman A, Ness J, Pohl D, et al. Pediatric multiple sclerosis: clinical features and outcome. Neurology. 2016;87(9 suppl 2):S74-S81. [DOI] [PMC free article] [PubMed] [Google Scholar]
- 6.Jeong A, Oleske DM, Holman J. Epidemiology of pediatric-onset multiple sclerosis: a systematic review of the literature. J Child Neurol. 2019;34(12):705-712. [DOI] [PubMed] [Google Scholar]
- 7.Ghezzi A. Pediatric multiple sclerosis: epidemiology, clinical aspects, diagnosis and treatment. Neurodegener Dis Manag. 2017;7(6s):23-25. [DOI] [PubMed] [Google Scholar]
- 8.International Multiple Sclerosis Genetics Consortium, Wellcome Trust Case Control Consortium 2, Sawcer S, et al. Genetic risk and a primary role for cell-mediated immune mechanisms in multiple sclerosis. Nature. 2011;476(7359):214-219. [DOI] [PMC free article] [PubMed] [Google Scholar]
- 9.International Multiple Sclerosis Genetics Consortium (IMSGC), Beecham AH, Patsopoulos NA, et al. Analysis of immune-related loci identifies 48 new susceptibility variants for multiple sclerosis. Nat Genet. 2013;45(11):1353-1360. [DOI] [PMC free article] [PubMed] [Google Scholar]
- 10.Moutsianas L, Jostins L, Beecham AH, et al. Class II HLA interactions modulate genetic risk for multiple sclerosis. Nat Genet. 2015;47(10):1107-1113. [DOI] [PMC free article] [PubMed] [Google Scholar]
- 11.Sundström P, Nyström M, Ruuth K, Lundgren E. Antibodies to specific EBNA-1 domains and HLA DRB1*1501 interact as risk factors for multiple sclerosis. J Neuroimmunol. 2009;215(1–2):102-107. [DOI] [PubMed] [Google Scholar]
- 12.Lassmann H, Niedobitek G, Aloisi F, Middeldorp JM, NeuroproMiSe EBV Working Group. Epstein-Barr virus in the multiple sclerosis brain: a controversial issue—report on a focused workshop held in the Centre for Brain Research of the Medical University of Vienna, Austria. Brain. 2011;134(pt 9):2772-2786. [DOI] [PMC free article] [PubMed] [Google Scholar]
- 13.Makhani N, Banwell B, Tellier R, et al. Viral exposures and MS outcome in a prospective cohort of children with acquired demyelination. Mult Scler. 2016;22(3):385-388. [DOI] [PubMed] [Google Scholar]
- 14.Banwell B, Krupp L, Kennedy J, et al. Clinical features and viral serologies in children with multiple sclerosis: a multinational observational study. Lancet Neurol. 2007;6(9):773-781. [DOI] [PubMed] [Google Scholar]
- 15.Krone B, Pohl D, Rostasy K, et al. Common infectious agents in multiple sclerosis: a case-control study in children. Mult Scler. 2008;14(1):136-139. [DOI] [PubMed] [Google Scholar]
- 16.Bjørnevik K, Riise T, Casetta I, et al. Sun exposure and multiple sclerosis risk in Norway and Italy: the EnvIMS study. Mult Scler. 2014;20(8):1042-1049. [DOI] [PubMed] [Google Scholar]
- 17.Munger KL, Köchert K, Simon KC, et al. Molecular mechanism underlying the impact of vitamin D on disease activity of MS. Ann Clin Transl Neurol. 2014;1(8):605-617. [DOI] [PMC free article] [PubMed] [Google Scholar]
- 18.Lucas RM, Byrne SN, Correale J, Ilschner S, Hart PH. Ultraviolet radiation, vitamin D and multiple sclerosis. Neurodegener Dis Manag. 2015;5(5):413-424. [DOI] [PubMed] [Google Scholar]
- 19.Berer K, Mues M, Koutrolos M, et al. Commensal microbiota and myelin autoantigen cooperate to trigger autoimmune demyelination. Nature. 2011;479(7374):538-541. [DOI] [PubMed] [Google Scholar]
- 20.Boster AL, Endress CF, Hreha SA, Caon C, Perumal JS, Khan OA. Pediatric-onset multiple sclerosis in African-American black and European-origin white patients. Pediatr Neurol. 2009;40(1):31-33. [DOI] [PubMed] [Google Scholar]
- 21.Langer-Gould A, Brara SM, Beaber BE, Koebnick C. Childhood obesity and risk of pediatric multiple sclerosis and clinically isolated syndrome. Neurology. 2013;80(6):548-552. [DOI] [PMC free article] [PubMed] [Google Scholar]
- 22.Chitnis T, Graves J, Weinstock-Guttman B, et al. Distinct effects of obesity and puberty on risk and age at onset of pediatric MS. Ann Clin Transl Neurol. 2016;3(12):897-907. [DOI] [PMC free article] [PubMed] [Google Scholar]
- 23.Brenton JN, Woolbright E, Briscoe-Abath C, Qureshi A, Conaway M, Goldman MD. Body mass index trajectories in pediatric multiple sclerosis. Dev Med Child Neurol. 2019;61(11):1289-1294. [DOI] [PubMed] [Google Scholar]
- 24.Gianfrancesco MA, Stridh P, Rhead B, et al. Evidence for a causal relationship between low vitamin D, high BMI, and pediatric-onset MS. Neurology. 2017;88(17):1623-1629. [DOI] [PMC free article] [PubMed] [Google Scholar]
- 25.Huppke B, Ellenberger D, Hummel H, et al. Association of obesity with multiple sclerosis risk and response to first-line disease modifying drugs in children. JAMA Neurol. 2019;76(10):1157-1165. [DOI] [PMC free article] [PubMed] [Google Scholar]
- 26.Guerrero-García JdeJ, Carrera-Quintanar L, López-Roa RI, Márquez-Aguirre AL, Rojas-Mayorquín AE, Ortuño-Sahagún D. Multiple sclerosis and obesity: possible roles of adipokines. Mediators Inflamm. 2016;2016:4036232. [DOI] [PMC free article] [PubMed] [Google Scholar]
- 27.Keyhanian K, Saxena S, Gombolay G, Healy BC, Misra M, Chitnis T. Adipokines are associated with pediatric multiple sclerosis risk and course. Mult Scler Relat Disord. 2019;36:101384. [DOI] [PubMed] [Google Scholar]
- 28.Guillemot-Legris O, Muccioli GG. Obesity-induced neuroinflammation: beyond the hypothalamus. Trends Neurosci. 2017;40(4):237-253. [DOI] [PubMed] [Google Scholar]
- 29.Scherdel P, Botton J, Rolland-Cachera M-F, et al. Should the WHO growth charts be used in France? PLoS One. 2015;10(3):e0120806. [DOI] [PMC free article] [PubMed] [Google Scholar]
- 30.Cole TJ, Lobstein T. Extended international (IOTF) body mass index cut-offs for thinness, overweight and obesity. Pediatr Obes. 2012;7(4):284-294. [DOI] [PubMed] [Google Scholar]
- 31.Chang B, Song C, Gao H, et al. Leptin and inflammatory factors play a synergistic role in the regulation of reproduction in male mice through hypothalamic kisspeptin-mediated energy balance. Reprod Biol Endocrinol. 2021;19(1):12. [DOI] [PMC free article] [PubMed] [Google Scholar]
- 32.Bove R, Musallam A, Healy BC, et al. Low testosterone is associated with disability in men with multiple sclerosis. Mult Scler. 2014;20(12):1584-1592. [DOI] [PMC free article] [PubMed] [Google Scholar]
- 33.Dendrou CA, Fugger L, Friese MA. Immunopathology of multiple sclerosis. Nat Rev Immunol. 2015;15(9):545-558. [DOI] [PubMed] [Google Scholar]
- 34.Stranahan AM, Hao S, Dey A, Yu X, Baban B. Blood-brain barrier breakdown promotes macrophage infiltration and cognitive impairment in leptin receptor-deficient mice. J Cereb Blood Flow Metab. 2016;36(12):2108-2121. [DOI] [PMC free article] [PubMed] [Google Scholar]
- 35.Palavra F, Almeida L, Ambrósio AF, Reis F. Obesity and brain inflammation: a focus on multiple sclerosis. Obes Rev. 2016;17(3):211-224. [DOI] [PubMed] [Google Scholar]
- 36.Pieper C, Pieloch P, Galla HJ. Pericytes support neutrophil transmigration via interleukin-8 across a porcine co-culture model of the blood-brain barrier. Brain Res. 2013;1524:1-11. [DOI] [PubMed] [Google Scholar]
- 37.Messina S, Vargas-Lowy D, Musallam A, et al. Increased leptin and A-FABP levels in relapsing and progressive forms of MS. BMC Neurol. 2013;13:172. [DOI] [PMC free article] [PubMed] [Google Scholar]
- 38.Kraszula L, Jasińska A, Eusebio MO, Kuna P, Głąbiński A, Pietruczuk M. Evaluation of the relationship between leptin, resistin, adiponectin and natural regulatory T cells in relapsing-remitting multiple sclerosis. Neurol Neurochir Pol. 2012;46(1):22-28. [DOI] [PubMed] [Google Scholar]
- 39.Barja-Fernández S, Aguilera CM, Martínez-Silva I, et al. 25-Hydroxyvitamin D levels of children are inversely related to adiposity assessed by body mass index. J Physiol Biochem. 2018;74(1):111-118. [DOI] [PubMed] [Google Scholar]
- 40.Ahn JJ, O'Mahony J, Moshkova M, et al. Puberty in females enhances the risk of an outcome of multiple sclerosis in children and the development of central nervous system autoimmunity in mice. Mult Scler. 2015;21(6):735-748. [DOI] [PubMed] [Google Scholar]
Associated Data
This section collects any data citations, data availability statements, or supplementary materials included in this article.
Data Availability Statement
Anonymized data will be shared by request from any qualified investigator.


