Abstract
Despite major advances in breast cancer imaging there is compelling need to reduce unnecessary biopsies by improving characterization of breast lesions. This study demonstrates the use of machine learning to enhance breast cancer diagnosis with multimodal ultrasound. Surgically proven solid breast lesions were studied using quantitative features extracted from grayscale and Doppler ultrasound images. Statistically different features from the logistic regression classifier were used train and test lesion differentiation by leave-one-out cross-validation. The area under the ROC curve (AUC) of the grayscale morphologic features was 0.85 (sensitivity = 87, specificity = 69). The diagnostic performance improved (AUC = 0.89, sensitivity = 79, specificity = 89) when Doppler features were added to the analysis. Reliability of the individual training cycles of leave-one-out cross-validation was tested by measuring dispersion from the mean model. Significant dispersion from the mean, representing weak learning, was observed in 11.3% of cases. Pruning the high-dispersion cases improved the diagnostic performance markedly (AUC 0.96, sensitivity = 92, specificity = 95). These results demonstrate the effectiveness of dispersion to identify weakly learned cases. In conclusion, machine learning with multimodal ultrasound including grayscale and Doppler can achieve high performance for breast cancer diagnosis, comparable to that of human observers. Identifying weakly learned cases can markedly enhance diagnosis.
Keywords: Breast cancer, ultrasound, computer-aided diagnosis, machine learning, radiomics
I. Introduction
Breast cancer is currently the most common cancer in American women, except for skin cancers. It is estimated that about 266,120 new cases of invasive breast cancer will be diagnosed in women in 2018 [1]. Breast cancer is also the second leading cause of cancer death in women. The chance that a woman will die from breast cancer is about 1 in 37 (2.7%) [2]. Despite all recent advances in diagnostic breast imaging, particularly in screening, mammography yield for biopsy is still, low leading to a large number of false positives and associated expenses and inconveniences to patients.
Regardless of its many advantages, the quality of ultrasound suffers from its intrinsic speckle noise and low contrast. To compensate for these limitations, various studies have demonstrated the use of digital image processing techniques and computer-aided diagnosis to improve detection rate and increase specificity [3–5]. Such methods improve tumor detection and reduce background noise to improve image contrast of the tumor relative to the surrounding tissue, to better differentiate benign from worrisome lesions. These advances also enable more objective and precise description of lesion shape and texture and result in a large number of quantitative features or biomarkers. The emerging field of radiomics involving extraction and analysis of a large number of quantitative features with high throughput from medical images is being increasingly used for medical diagnosis [6]. Our previous studies have assessed ultrasound grayscale and Doppler vascular features independently to characterize breast lesions. In this study we use radiomics, where grayscale and Doppler features are used together, for a comprehensive analysis of breast lesions. An approach based on measuring dispersion is outlined to identify weakly learned cases, and their effect on diagnostic performance is evaluated.
II. Materials and Methods
A. Data and Image acquisition
Grayscale and color Doppler images for 160 biopsy-proven breast lesions acquired from the institutional database were analyzed quantitatively. The study was approved by the institutional review board. The grayscale images for each mass consisted of five to seven views of the lesion in radial and anti-radial planes. For the same lesions, two to three color Doppler vascular images were analyzed on average.
B. Quantitative feature extraction
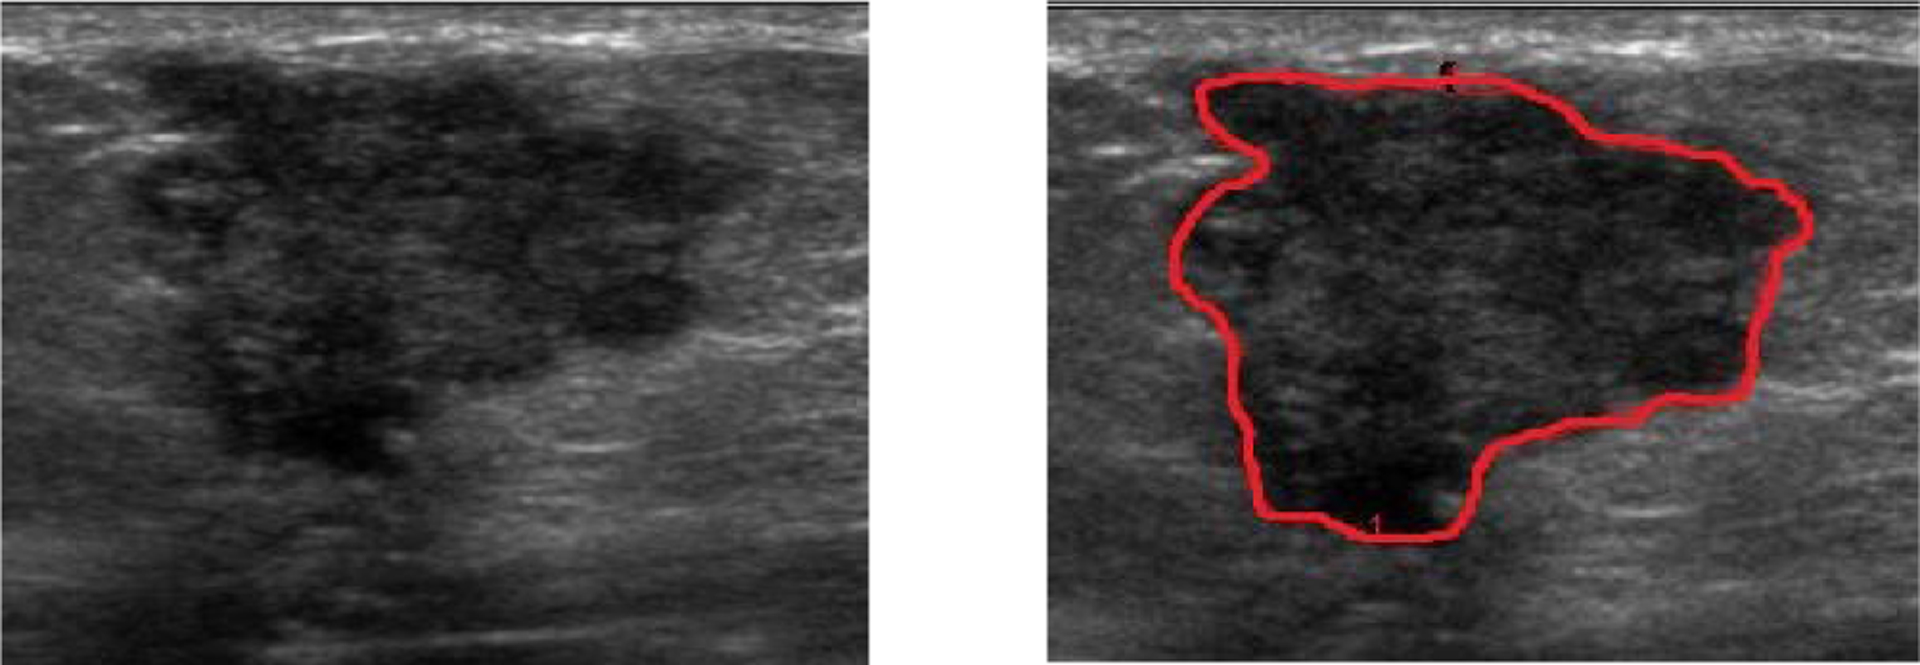
For each grayscale ultrasound image, the lesion was manually traced by an experienced clinician (Figure 1). The observer was blinded to the histological classifications of the lesions. Eight features describing grayscale, shape and coarseness of the margin were automatically computed from the traced margin. These features were extracted by partitioning the lesion into 5-degree sectors and then comparing the difference between the inside and the outside of each sector [7]. The features used in the analysis included brightness difference at the margin, margin sharpness, angular variation in brightness at the margin, depth-to-width ratio, axis ratio, tortuosity, radius variation, and elliptically normalized skeleton.
Fig. 1.

B-mode ultrasound images of a malignant lesion showing the manually outlined tumor margin for quantitative extraction of grayscale features.
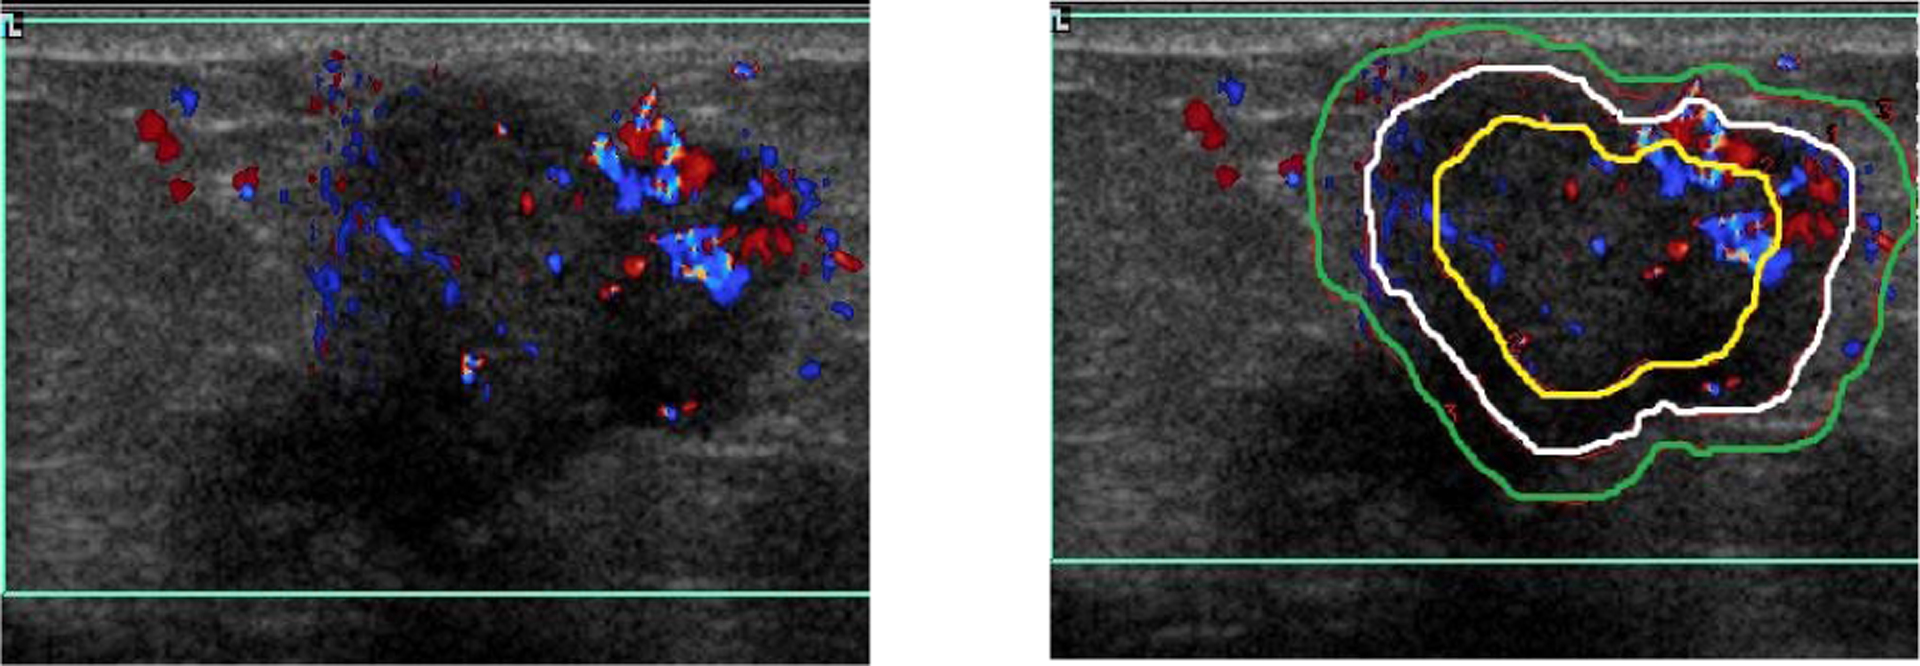
Color Doppler images were analyzed in three concentric regions using an IDL program developed in-house for vascular analysis (Figure 2). The three regions were lesion center, rim, and the surrounding tissue. The same observer manually outlined the lesion margins on all images, and the computer used this margin to automatically derive the three regions so that they were equal in area. Quantitative Doppler analysis involved two steps. First, the color bar for each directional flow in the Doppler image was divided into 100 equal levels. Each level was assigned a velocity value between 0 and v max (maximum velocity) based on the position of the color level in the color bar, to create a color scale. The second step was to use the color scale to detect pixels with flow (colored pixels). The number of colored pixels; the mean velocity of flow, through each colored pixel; and the total number of pixels enclosed within each region, were measured. These measurements were used to determine vascular fraction area (A), mean flow velocity index (VI) and blood flow volume index (FVI) with the formulas as described earlier [13].
Fig. 2.

A color Doppler image of a malignant lesion showing the three regions selected for quantitiave vascular analysis.
C. Learning model construction and evaluation
The grayscale features with patient age and measured vascularity parameters were used to train and test the classification model using a logistic regression classifier. Cross-validation was performed using a round-robin (leave-one-out) approach: N–1 samples of the N samples in the data were trained to predict the behavior of the remaining sample, and the process was repeated until each sample had been the test case. From each cross-validation, performance of learning was computed by measuring dispersion of logistic regression coefficients from the mean.
Probability of malignancy was compared with the biopsy results to perform ROC analysis using MedCalc [Version 17.9, Ostend, Belgium]. The area under the ROC curve (AUC), sensitivity (Se), and specificity (Sp) at Youden index for each ROC curve were used for evaluating diagnostic performance of the classification model.
C. Identification of weak learning and selective pruning
To achieve high diagnostic performance, it is important that the probability estimates of the machine learning classification scheme are reliable. The term “reliability” refers to internal consistency in the measurements: masses with similar image characteristics should yield similar probability estimates. In cross-validation by the leave-one-out method (LOOM), all but one case are used to iteratively train models on the holdout case. Since each training cycle differs by only one sample and the number of cases in the analysis is generally large (N≫1), it is expected that the input-output function is perturbed by only a small amount δ between different learning sets, that is, LOOM assumes small perturbations. In such a circumstance, a significant deviation of the input-output function of a learning set from the expected value in LOOM cross-validation (a large δ) signifies that the training for the set is not consistent with the other learning sets of the group, so the set is an outlier and/or the logistic regression was a weak learner with respect to these cases. Cases that caused weak learning were identified by summing the dispersion in the coefficients of logit probability from the mean values of the coefficients. Weak cases were defined as those with top-ten-percentile dispersion (low confidence), and were pruned. ROC analysis on the residual cases was repeated to assess the influence of weak learning on the final diagnostic assessment.
III. Results
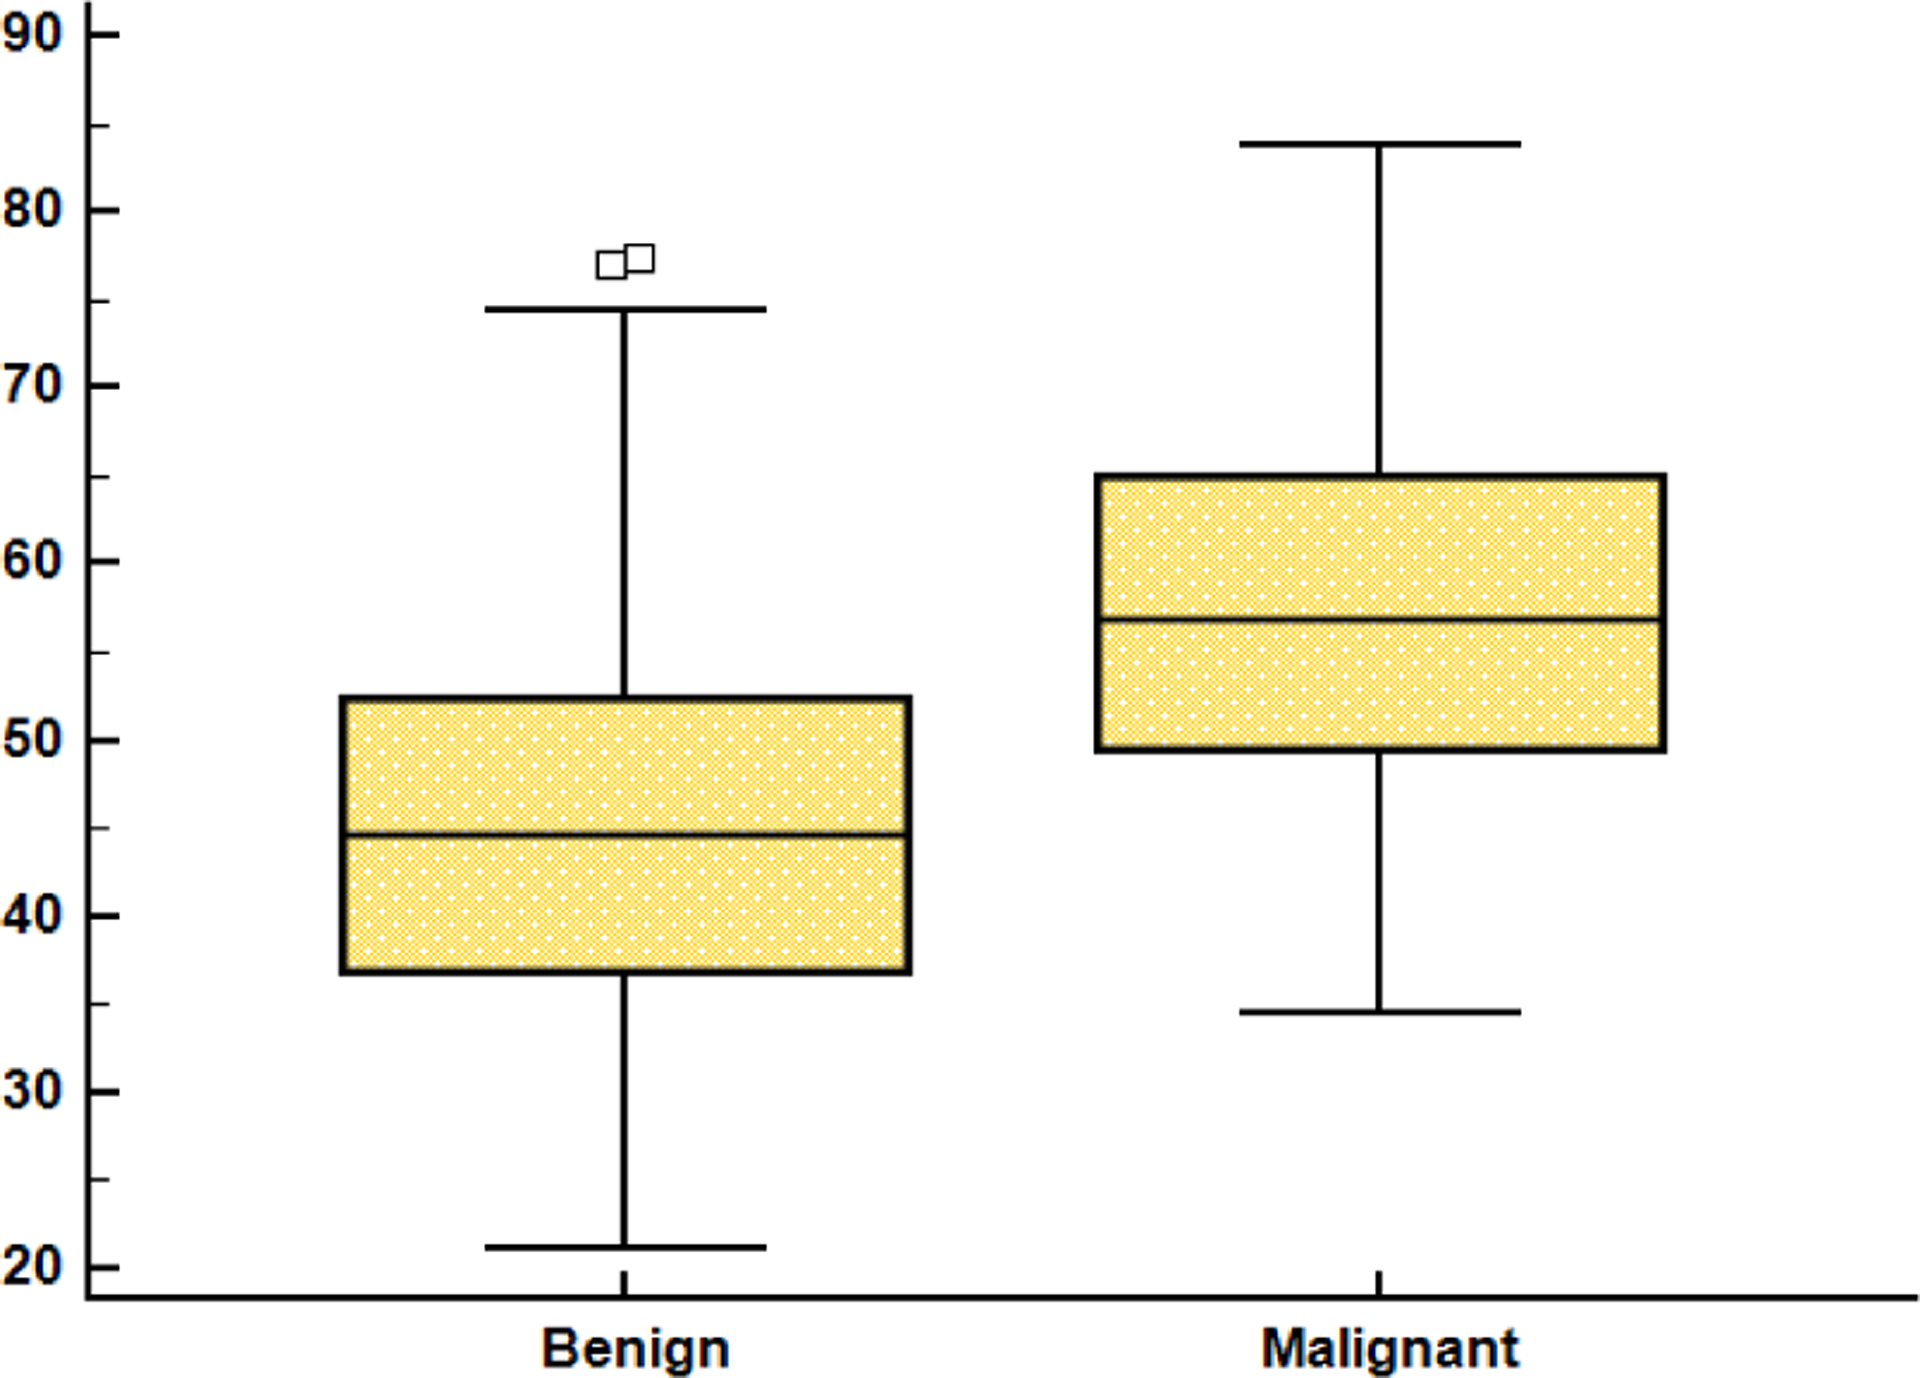
The mean age of patients was (41.82 ± 12.55) significantly lower in patients with benign lesions when compared to those with malignant lesions (57. 66 ± 10.78) (Figure 3, p < 0.05).
Fig. 3.

The age difference between malignant and benign tumor cases.
A. Quantitative imaging features
Table 1 compares the magnitude of the quantitative computerized ultrasound features of all the malignant lesions with those of benign lesions. Of the various features studied, one margin, two shape, and three vascularity features showed statistical difference between the two subtypes (p < 0.05). Margin sharpness difference confirms that the margins of malignant lesions are less defined than those of the malignant subtype: MS was 54.22 ± 11.1 vs 60.07 ± 9.02. The smaller value of elliptically normalized skeleton (ENS) in benign lesions, 1.14 ± 0.20, compared to malignant, 0.15 ± 0.03, indicates that malignant shapes are more irregular (p = 0.00005). Marked difference in Doppler vascular features was observed between malignant and benign lesions. Color Doppler vascular fraction area (AI), mean flow velocity index (VI), and flow volume index (FVI) in the lesion were all substantially higher for malignant lesions compared to benign.
Table 1:
Magnitude of the quantitative computer-derived features of malignant and benign lesions.
| Margin sharpness | Skelton Norm | Depth to Width | Vascular fractional area | Flow velocity | Flow volume | |
|---|---|---|---|---|---|---|
| Malignant | 54.22 ± 11.14 | 0.15 ± 0.03 | 0.83 ± 0.27 | 4.66 ± 7.27 | 0.85 ± 0.65 | 2.62 ± 3.40 |
| Benign | 60.07 ± 9.02 | 1.14 ± 0.2 | 0.71 ± 0.19 | 1.67 ± 2.57 | 0.44 ± 0.58 | 0.85 ± 1.49 |
| p-value | 0.0007 | 0.0412 | 0.0015 | 0.0023 | 0.0001 | 0.0002 |
B. Performance of diagnostic models
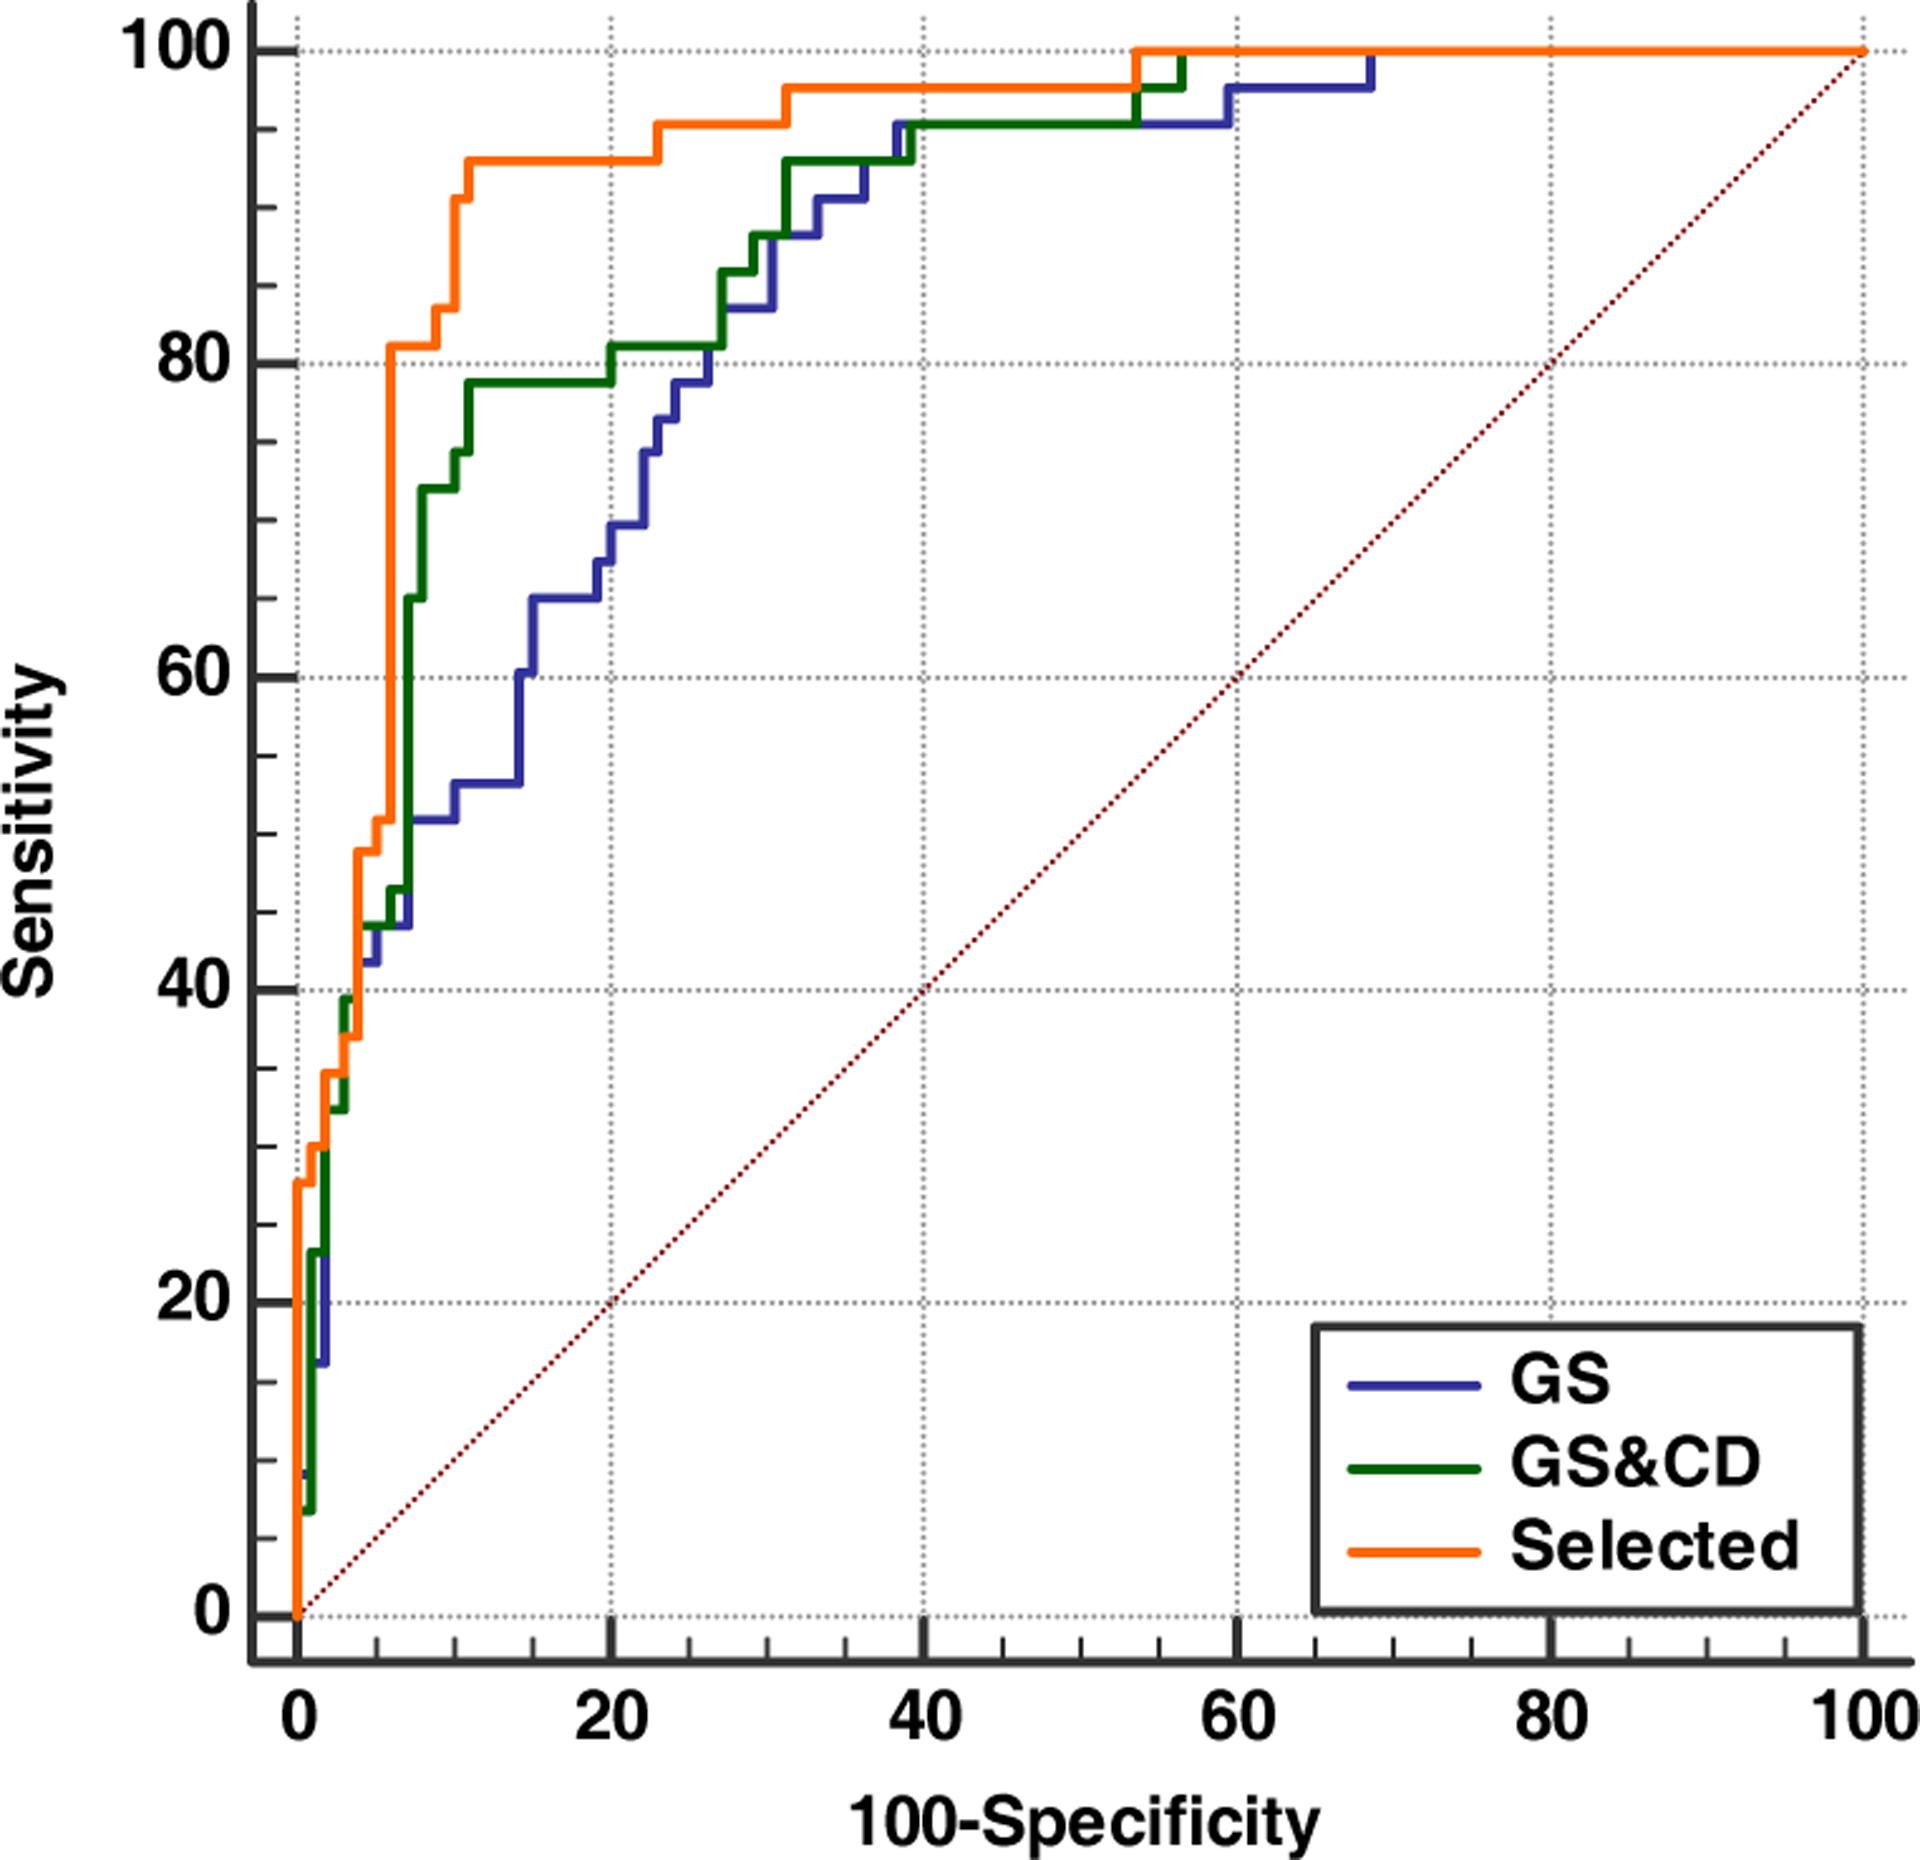
Figure 4 and Table 2 demonstrate the diagnostic performance measured by Area under ROC curve, as well as sensitivity and specificity for GS features both alone and when CD is added and after pruning. When CD measurements were included, the performance of ML improved to AUC of 0.89 ± 0.03, with sensitivity and specificity of 79 and 89.
Fig 4.

ROC curves comparing the diagnostic performances of grayscale features, grayscale with Doppler features, and weakly learned cases pruned.
Table 2.
The diagnostic performance measured by the area under ROC curve (AUC), as well as sensitivity and specificity, for GS features alone; for grayscale and Doppler features; and for selected cased with weakly learned cases pruned.
| Grayscale | Grayscale + Doppler | Selected cases | |
|---|---|---|---|
| AUC (± SE) | 0.85 ± 0.03 | 0.89 ± 0.03 | 0.96 ± 0.01 |
| Sensitivity | 0.87 | 0.79 | 0.92 |
| Specificity | 0.69 | 0.89 | 0.95 |
This level of performance is comparable to that of human observers. The high level of performance by machine learning further improved when weak learner cases were identified. Using dispersion measurement as a metric for the quality of training, 18 training cycles out of 160 (11.3%) were found to be weak. Pruning these cases improved diagnostic performance to AUC of 0.96 (Sen 92, Spe = 95).
C. Selective pruning
18 cases showed high dispersion values from the mean and were excluded from the final diagnostic assessment. The diagnostic performance improved markedly to 0.96 with sensitivity and specificity (Figure 4).
IV. Discussion
Our previous studies using computer-extracted features have been primarily on evaluating grayscale characteristics of lesion margins [8, 9]. The features are extracted by partitioning the lesion into N sectors and then comparing the difference between the inside and the outside of each sector. Consistent with clinical assessments, the quantitative grayscale features show malignant masses to have less distinct margins, whereas benign masses are characterized by regular and smoother margins [10]. With quantitative margin features it is feasible to achieve diagnostic performance as measured by AUC of 0.85 to 0.90 for solid masses. In the present study we achieved a performance (AUC = 0.85) comparable to earlier studies with margin features. Since a different cohort of subjects was used these results demonstrate the reproducibility of our approach. To improve the diagnostic performance, we proposed the use of additional features that provide information on different tumor attributes such as vascularity. Angiogenesis and abnormal vessel formation are usually linked with malignant neoplastic changes in breast lesions. Studies assessing the vascularity of breast lesions on Doppler ultrasound have shown higher vascularity in malignant masses than in benign masses [11, 12]. Consistent with these prior studies, vascularity measures in this study were higher in malignant lesions. Including the vascularity features with grayscale features in training and testing improved diagnostic performance to AUC of 0.89, a 4.7% increase. This is a significant improvement, towards a perfect AUC of 1.
This study also explored the influence of quality of learning during the training cycle on the diagnostic outcome. Leave-one-out (LOO) cross-validation is essentially a small perturbation approach, so it is to be expected that individual training cycles of LOO are very similar. Dispersion of an individual training cycle from the mean or from any other reference is a measure of the reliability of the training cycle in assessing probability of the event. For example, high-dispersion cases indicate that weak learners were used. When the weakly learned cases were pruned from the analysis, a near-perfect diagnosis of AUC=0.96 was achieved. That is, the significant drop in diagnostic performance at AUC down to 0.89 is attributable weak learners. Apparently, a small change in the training data of the individual training cycles alters the interactions between the data points significantly, enough to influence the learning optimization process, thereby leading to inconsistent models and ambiguous predictions. Future studies emphasizing reliability testing of the training could provide a means to achieve near-perfect diagnostic performance.
V. Conclusion
Machine learning with multimodal ultrasound including grayscale and Doppler can achieve high sensitivity and specificity for breast cancer diagnosis that is comparable to the performance of human observers. The importance of this result is that it suggests that computerized assessment can be used as independent observer. Identifying cases that cause weak learning can markedly enhance the diagnosis. Implementation and further validation of this approach using a larger dataset has a potential to reduce unnecessary breast biopsies.
Acknowledgments
Supported by the NIH grant: RO1 CA130946
REFERENCES
- [1].Breast cancer research foundtion. 2018. statistics.
- [2].World cancer research fund. 2018. statistics.
- [3].Guan FD, Ton P, Ge SP, Zhao LN Anisotropic diffusion filtering for ultrasound speckle reduction Sci. China, Technol. Sci, 57 (3) (2014), pp. 607–61. [Google Scholar]
- [4].Lee JS. Digital image enhancement and noise filtering by use of local statistics vol. PAMI-2, no. 2, pp. 165–168, March 1980 [DOI] [PubMed] [Google Scholar]
- [5].Balocco S, Gatta C, Pujol O, Mauri J, Radeva P. SRBF: speckle reducing bilateral filtering. Ultrasound Med. Biol, 36 (8) (2010), pp. 1353–1363 [DOI] [PubMed] [Google Scholar]
- [6].Lambin Philippe, Emmanuel Rios-Velazquez, Leijenaar Ralph T. H. et al. Radiomics: Extracting more Eur J Cancer. 2012. March;48 (4):441–6 information from medical images using advanced feature analysis. [DOI] [PMC free article] [PubMed] [Google Scholar]
- [7].Sehgal CM, Cary TW, Kangas SA, Weinstein SP, Schultz SM, Arger PH, Conant EF Computer-based margin analysis of breast sonography for differentiating malignant and benign masses. J Ultrasound Med. 2004;23:1201–1209+- [DOI] [PubMed] [Google Scholar]
- [8].Bouzghar G, Levenback BJ, Sultan LR, Venkatesh SS, Cwanger A, Conant EF, Sehgal CM Bayesian probability of malignancy with breast ultrasound BI-RADS features. J Ultrasound Med. 2014;33:641–648 [DOI] [PubMed] [Google Scholar]
- [9].Venkatesh S, Levenback BJ, Sultan LR, Bouzghar G, Sehgal CM. Going beyond a First Reader: A Machine Learning Methodology for Optimizing Cost and Performance in Breast Ultrasound Diagnosis. Ultrasound in Medicine and BiologyVolume 41, Issue 12, December 2015, Pages 3148–3162. [DOI] [PubMed] [Google Scholar]
- [10].American College of Radiology (ACR). BI-RADS: Ultrasound. In: Breast imaging reporting and data system: BI-RADS atlas. 5th ed. Author, Reston, VA; 2013 [Google Scholar]
- [11].Peters-Engl C, Medl M, Leodolter S The use of colour-coded and spectral Doppler ultrasound in the differentiation of benign and malignant breast lesions. Br J Cancer, 71 (1995), pp. 137–139 [DOI] [PMC free article] [PubMed] [Google Scholar]
- [12].Sehgal CM, Arger PH, Rowling SE, et al. Quantitative vascularity of breast masses by Doppler imaging: regional variations and diagnostic implications. J Ultrasound Med, 19 (2000), pp. 427–440. [DOI] [PubMed] [Google Scholar]


