

SUMMARY
Background & aims:
Increasing dietary intake of n-3 EPA+DHA and lowering dietary n-6 LA is under investigation as a therapeutic diet for improving chronic pain syndromes as well as other health outcomes. Herein we describe the diet methodology used to modulate intake of n-3 and n-6 PUFA in a free living migraine headache population and report on nutrient intake, BMI and diet acceptability achieved at week 16 of the intensive diet intervention and week 22 follow-up time-point.
Methods:
A total of 178 participants were randomized and began one of three diet interventions: 1) a high n-3 PUFA, average n-6 PUFA (H3) diet targeting 1500 mg EPA+DHA/day and 7% of energy (en%) from n-6 linoleic acid (LA), 2) a high-n-3 PUFA, low-n-6 PUFA (H3L6) targeting 1500 mg EPA+DHA/day and <1.8 en% n-6 LA or 3) a Control diet with typical American intakes of both EPA+DHA (<150 mg/day) and 7 en% from n-6 LA. Methods used to achieve diet change to week 16 include diet education, diet counseling, supply of specially prepared foods, self-monitoring and access to online diet materials. Only study oils and website materials were provided for the follow-up week 16 to week 22 periods. Diet adherence was assessed by multiple 24 h recalls administered throughout the trial. Diet acceptability was assessed in a subset of participants at 4 time points by questionnaire.
Results:
At week 16H3 and H3L6 diet groups significantly increased median n-3 EPA+DHA intake from 48 mg/2000 kcals at baseline to 1484 mg/2000 kcals (p < 0.0001) and from 44 mg/2000 kcals to 1341 mg/2000 kcals (p < 0.0001), respectively. In the Control group, EPA+DHA intake remained below the typical American intake with baseline median at 60 mg/2000 kcals and 80 mg/2000 kcals (p = 0.6) at week 16. As desired, LA intake was maintained in the H3 and Control group with baseline median of 6.5 en% to 7.1 en% (p = 0.4) at week 16 and from 6.5 en% to 6.8 en% (p = 1.0) at week 16, respectively. In the H3-L6 group, n-6 LA decreased from 6.3 en% at baseline to 3.2 en% (p < 0.0001) at week 16. There were no significant changes in BMI or diet acceptability throughout the trial or between diet groups.
Conclusions:
We find this diet method to be acceptable to research participants and successful in altering dietary n-3 EPA+DHA with and without concurrent decreases in n-6 LA. If n-6 LA of less than 3 en% is desired, additional techniques to limit LA may need to be employed.
Keywords: Fish, n-6, n-3, Linoleic acid, Polyunsaturated fatty acids, Migraine headache
1. Introduction
Interventions altering dietary polyunsaturated fatty acids (PUFA) are hypothesized to reduce physical pain [1,2]. PUFAs—including n-3 PUFA such as eicosapentaenoic acid (EPA, 20:5n-3), docosahexaenoic acid (DHA, 22:6n-3), and n-6 PUFA such as linoleic acid (LA, 18:2n-6) and arachidonic acid (AA, 20:4n-6)—are key components of human tissues including myelin, neuronal and glial cell membranes which serve as precursor pools for conversion to bioactive derivatives that activate or inhibit pain signaling pathways [3–7]. Humans lack the enzymes required to synthesize n-3 and n-6 PUFA de novo therefore the distribution of these fatty acids in the body responds to diet or supplementation [8]. Herein, we describe the diet intervention method used to alter dietary PUFAs in free living migraine population.
LA is an essential nutrient, although the optimal dietary intake is unknown [9,10]. Traditional U.S. and evolutionary diets without added seed oils provided an estimated 2–3% of energy from LA throughout the lifespan [11,12]. Modern U.S. diets with added seed oils are estimated to provide 7.6% of energy [13], which is reflected in an increased abundance of LA in adipose tissue [14]. LA is a direct precursor to oxylipins that are reported to regulate nociception [15], immune activation [16] and matrix remodeling [17–19] in preclinical models, although the effects of lowering dietary LA are incompletely understood [20,21]. Here we sought to decrease LA to 1.8%, an amount that is consistent with historical intakes, for 4 months to elucidate the effects of modulating dietary LA on headache pain.
Proposed benefits of n-3 PUFA consumed from whole fish as shown in epidemiologic studies have often not been borne out in randomized controlled trials (RCTs) [22,23]. It is common for trials to deliver n-3 PUFAs in the form of a dietary supplement which should not be considered synonymous with n-3 PUFAs from fish. The benefits of a study design that employ dietary supplements to increase fatty acids is acknowledged, although we chose to alter omega-3 EPA+DHA with a diet intervention that increased intake of whole fish and results should be interpreted in the context of such.
To address some of the gaps in understanding, we developed diet methodology allowing for controlled manipulation of dietary EPA+DHA, LA and n-3 alpha-linolenic acid (ALA, 18:3n-3), a precursor to EPA+DHA, in an outpatient setting. In a prior pilot study, we investigated the effects of a High n-3 plus Low n-6 LA (H3L6) versus a Low n-6 LA (L6) diet in 67 participants with chronic daily headache [24]. The diet targets achieved in this prior study were a lowering of LA to 2.5 en% in both the H3L6 and L6 diet groups with a coinciding increase of EPA+DHA intake to >1000 mg/day in the H3L6 group, as estimated by three, randomly administered 24-hr dietary recalls [25]. The dietary changes resulted in alterations in antinociceptive lipid mediators in the H3L6 diet compared to the L6 diet [15] as well as a significant improvement in the Headache Impact Test (HIT-6) (−7.5 vs −2.1; P < 0.001); and greater reductions in headache days per month (−8.8 vs −4.0; P = 0.02); and headache hours per day (−4.6 vs −1.2; P = 0.01) [1].
In the current study, we extend our methodology to test the biochemical and clinical effects of controlled increases in EPA+DHA with or without concurrent reduction in dietary LA in individuals with frequent episodic migraines [26]. It is of note that EPA and DHA have differential biochemical outcomes and due to the cooccurrence of EPA and DHA in fish and in varying ratios by fish species they are studied here in combination [27,28]. In this paper, we report the diet methods used and nutrient intakes achieved for the purpose of investigating the effects of targeted PUFA modifications on migraine severity and frequency as well as alterations in nociceptive lipid mediators of which the latter will be presented in future publications.
2. Materials and methods
2.1. Participants
Individuals who were at least 18 years of age and met inclusion criteria of experiencing 5–20 migraine headaches per month as shown in a daily headache diary recorded for 28–42 days were invited to participate. Rolling enrollment was conducted from July 2014 through November 2017 with the last participant completing the diet intervention May 2018. Pregnant or breastfeeding women, individuals regularly consuming fatty acid supplements, those who participated in the pilot study for chronic daily headache and those who refused to eat fish were excluded from the study. Total possible compensation for completing all study visits [9], blood draw procedures [5] and headache diaries was $600. There was no charge to participants for food provisions. Compensation was also provided for gas and parking to attend study visits. Detailed recruitment and study methods can be found in the published protocol [26]. The study was conducted according to the Declaration of Helsinki guidelines, with all procedures involving human participants approved by the UNC-Chapel Hill Institutional Review Board. All participants provided written informed consent. This trial is registered under ClinicalTrials.gov (NCT02012790).
2.2. Study diets
Three research diets were developed for this 3-arm, parallel-group, 16-week, randomized dietary intervention. For the purpose of assessing the feasibility of following the diets independently and to provide an extended biochemical outcomes time-point, participants continued the diet for a follow-up period of 6 weeks to the final week 22 time point. Up to week 16, free living participants were provided with prepared and unprepared foods to supply approximately 2/3 of energy needs. Methods to achieve diet adherence included intensive diet education, tailored diet counseling, food provision, self-monitoring and access to a mobile friendly website with all diet education materials for eating away from home and >75 recipes. The H3 diet was designed to increase n-3 EPA+DHA to >1500 mg per day from fish, a level associated with marked biochemical alterations and clinical efficacy in our pilot study [1], while maintaining typical US intakes of LA. The H3-L6 diet was designed to increase n-3 EPA and DHA to >1500 mg/day with concurrent reduction of LA to <1.8 en%. The Control diet was designed to achieve n-3 and n-6 intakes similar to that of typical US intake at the time of intervention development of 7.0 en% from LA (NHANES 2011–2012) and less than 150 mg EPA + DHA [29]. Because ALA is enzymatically converted in low rates to EPA and DHA [30] all three diets were designed to maintain typical US intake of ALA of 0.7 en% [29]. All diets were designed to deliver adequate calories for weight maintenance and provide typical US proportions of total protein, total carbohydrate and total fat [29]. All diets were low in processed foods.
2.3. Lowering n-6
Foods high and low in n-6 fatty acids were identified using the USDA National Nutrient Database for Standard Reference, Release 26 [31]. Cooking oils high in n-6 LA such as soybean oil, corn oil, cottonseed oil, sunflower oil and safflower oil were excluded from the diets as well as foods containing moderate to high amounts of n-6 LA such as most nuts, nut butters, avocado and processed foods. Cooking oils with the low LA content include olive oil, macadamia nut oil, coconut oil, butter and palm oil. These oils were allowed in packaged foods and foods eaten away from home. Participants in the H3L6 diet group were provided with regular salted butter and a low n-6 oil blend composed of olive oil and macadamia nut oil and instructed to use these exclusively in place of all other oils, butter and margarine in all home food preparation. Study provided foods were carefully selected to be low in n-6 LA, and recipes were prepared with the low LA oil. Education was delivered on what foods, particularly oils, to avoid and which to choose when purchasing foods and selecting foods away from home. Participants were trained on how to read food labels and identify foods with acceptable oils. They were allowed to dine out, although it was discouraged. Because snack foods and salad dressings are often particularly high in LA, the study provided low LA snacks and packets of specially prepared salad dressing to improve diet adherence away from home.
2.4. Increasing n-3 EPA + DHA
The best fish sources of EPA + DHA were identified using the USDA SR 26 dataset [31]. Seven fish varieties high in EPA + DHA (see Supplement A) were provided by the study. Canned fish was sourced from Vital Choice Wild Seafood & Organics, Bellingham, WA, as these products were shown by laboratory analysis to be significantly higher in EPA and DHA compared to locally source canned fish products. Participants were instructed to consume one serving of high fat fish (e.g. 4oz of salmon) per day and provided with a fish cooking guide, fish recipes, and diet counseling on how incorporate fish into daily routine.
2.5. Average n-3 ALA
The 2011–2012 estimated US adult intake of ALA of 0.7 en% originates largely from soybean oil and canola oil [32]. Participants in all three diet arms were instructed to avoid soybean oil and canola oil. Therefore, to prevent a decrease in ALA and achieve 0.7 en% ALA participants were instructed to consume a small amount of ground flaxseed each day (1.5tsp in the H3 group and Control group, 2 tsp in the H3-L6 group). Participants were provided with measured packets of ground flaxseed, and study prepared flaxseed muffins and flaxseed granola, in order to achieve this goal.
2.6. Average n-6 LA
All participants were instructed to eliminate high LA oils from their diet, such as soybean oil, corn oil, peanut oil and canola oil. Participants in the Control group and the H3 group were provided with an oil blend composed of olive oil and corn oil and whipped butter blend of butter and corn oil, both formulated to achieve typical LA intakes of 7.0 en%. Participants were instructed to use the study provided oil and butter blend in place of all other oils, butters or margarines in all home food preparation.
2.7. Control diet
The Control diet intervention was designed to be as similar as possible to the H3 and H3L6 diet interventions, but with the exclusion of high n-3 fish. Participants received the same instruction on oils, flaxseed, fruits, vegetables, grains and prepared foods. The Control diet participants were instructed to exclude high fat fish and to focus on consumption of lean fish, skinless poultry, lean meats, beans and low-fat dairy products. Participants were provided with chicken breast, ground turkey, cod fish, chunk light canned tuna and canned beans. To aid in the preparation of study provided foods, participants received diet counseling along with a poultry cooking guide and recipes for utilizing study foods.
2.8. Study food preparation, procurement and recipe development
The Metabolic and Nutrition Research Core, a service of UNC Healthcare Nutrition and Food Service Department, procured all study foods, monitored foods for changes in formulation and prepared the specially formulated study recipes in a state-inspected kitchen facility. Substantial effort was spent on recipe selection and testing, taking into consideration the need to meet LA, ALA and EPA+DHA diet targets, palatability, regional acceptability, ability to prepare and freeze the recipe in large quantities and consume easily at home. Commercially available snack foods often contain high LA oils, therefore effort was spent on providing low LA snacks like granola bars, popcorn, hummus and cheese sticks. The same recipes were used in all three diets with the only difference between them being either the amount of ground flaxseed or the LA content/oil ingredient. Recipes were tested for taste and appearance to ensure that alterations in these ingredients did not have visual or taste effects. See Supplement A for study food’s LA, ALA, EPA and DHA nutrient analysis. The study budgeted $40/day for the cost of food for a total of $4480 per participant. Additionally, $360/participant for 9 h/8 visits with the dietitian.
2.9. Blinding
This was a modified double-blind design. All study staff, except the dietitian due to necessity of delivering the diet education, were blinded to the diet randomization. The dietitian met with study participants individually and did not provide information as to the study hypotheses, composition of study oils or contents of the other diets. The diet interventions were designed to be as similar as possible, delivering the same intensity of diet education and counseling, the same number of study provided foods and same instruction on eliminating specific oils. Diet education included information on oils to choose and to avoid, but no information specifically about n-6 or n-3 fatty acids. Diet education materials were the same between all diet groups with the only exception being that the Control group participants were asked to consume lean poultry and lean seafood instead of high fat fish. Study oils, study butter and all study prepared recipes were parceled into generic packaging excluding all ingredient information. The same foods (but prepared with diet group specific oils) were offered on all three diets with exception of the fish and poultry (see Supplement A for nutrient analysis of study provided foods and Supplement B for pictures of supplied foods and example meals).
2.10. Weight changes
To avoid confounding from weight changes participants were encouraged to maintain weight throughout the study, counseled to eat “allowed” foods ad libitum, to eat based on hunger and satiety cues and provided with an example meal plan with adequate calories for weight maintenance. Body weight was measured at each study visit (every 2–3 weeks). Weight management counseling was provided if weight fluctuated 5% or more from the first day of the diet.
3. Study visits
3.1. Diet education and nutrition counseling
After enrollment, but prior to randomization, participants completed 4–6 weeks of headache diary to confirm self-report of headache days per month and ability to complete the daily headache diary to an 80% completion rate or better. Upon meeting inclusion criteria diet randomization was conducted via an uneditable, web-based randomization tool. Each participant attended an initial 2-h education session with the dietitian that began with a detailed diet history to assess current diet and allowed for tailored diet counseling followed by review of the [1] Diet Guidelines [2]; Food List [3]; Seven-day Meal Plan [4]; Grocery Shopping Guides [5]; Dining Out Guide [6]; Cooking Guide and [7] Reading Food Labels Activity. Participants were also given access to a password protected website developed by the UNC Communication for Health for Applications and Interventions Core (CHAI) that included all diet-arm-specific diet education materials and 75+ recipes. Visit checklists were used to record completion of all intervention procedures.
The diet intervention took place over a total of 22 weeks. The first 16 weeks of the study included diet counseling at regular intervals with the study dietitian, dietary self-monitoring and study food provision. Participants met with the study dietitian and picked up a supply of study foods at weeks 0, 2, 4, 7, 10, and 13. At the week 16 visit participants met with the dietitian for diet counseling, were provided with a 6 weeks supply of study oil and butter and encouraged to continue on the diet with continued access to diet education materials and website.
3.2. Study food provision
At each study visit, participants determined, with guidance from the dietitian, how much and which foods to select, keeping in mind time between visits, upcoming travel and adequate supplies to follow the requirements of the study diet. Food supplies were stored at the UNC Metabolic and Nutrition Research Core kitchen facility. Frozen and refrigerated foods were packed into a 60-quart rolling cooler with ice packs and prepared within 30 min of selection for pick-up at the kitchen facility by participants.
3.3. Self-monitoring
A self-monitoring component was included to improve diet adherence. Participants completed a 3-day food record between Week 0 and Week 2 visit for review with the dietitian. Thereafter, a daily diet checklist was used to track compliance with the diet goals and report diet adherence on a scale of 1–5 from Week 2 to Week 16.
3.4. Multiple 24-hr dietary recalls
Unscheduled, telephone-administered, 24-hr dietary recalls were collected by the trained staff of the UNC Nutrition and Obesity Research Center (NORC) Behavioral Assessment Sub-Core and analyzed using Nutrition Data System for Research (NDSR) software versions 2014, 2015 and 2016 developed by the Nutrition Coordinating Center (NCC), University of Minnesota, Minneapolis, MN. Two, 24-hr dietary recalls, one weekend day and one weekday, were collected in each of the three weeks prior to each time point (Week 0, Week 16 and Week 22). Three attempts were made to contact participants for each recall. An average of the two dietary recalls was used in data analysis to help account for day to day nutrient intake variation. To improve data accuracy of estimated LA, ALA, EPA and DHA intakes, the NDSR nutrient database was reconciled with the NIAAA lab analysis of study provided foods. Custom ingredients and recipes were created to better estimate nutrients of interest from study provided foods. Efforts were made to reconcile foods eaten outside the home with the database by calling restaurants for ingredient, especially oil, information.
3.5. Diet acceptability
In a subset of 39 participants, a Diet Acceptability Questionnaire (Fig. 1) was administered at weeks 4, 10, 16 and 22. Participants rated agreement with the statements on a 4-point Likert scale (1 = strongly disagree, 2 = disagree, 3 = agree, 4 = strongly agree) for a total of 20 possible points. To our knowledge, no diet acceptability questionnaire had previously been validated for use with experimental diet interventions. Crohnbach’s alpha was 0.89 at week 4 and 0.87 at week 10, demonstrating high internal consistency, a measure of questionnaire reliability [33].
Fig. 1.

Diet acceptability questionnaire.
4. Data analysis methods
As most dietary intake data had non-normal distribution, we performed nonparametric analyses to compare intakes across diets. Descriptive statistics were provided for the participants’ demographics and the dietary recalls data. Achievement of projected dietary targets at post-intervention (Week 16) was assessed by one-sample Wilcoxon signed-rank tests. The comparisons between pre-and post-intervention within diets groups were made using Wilcoxon signed-rank tests. Kruskal–Wallis tests, followed by Dunn’s tests of multiple comparisons, were employed to examine diet-group differences in nutrients intakes post-intervention and diet acceptability [34]. All statistical analyses were conducted using STATA 15 (StataCorp LP, College Station, TX, USA) (see Table 1).
Table 1.
Dietary fatty acid intake targets.
| Diet Group | LA en% (g/2000 kcals) | EPA + DHA mg | ALA en% (g/2000 kcals) |
|---|---|---|---|
| High n-3, Low n-6 (H3L6) | ≤1.8 (4.0) | ≥1500 | 0.7 (1.5) |
| High n-3, Average n-6 (H3) | 7.0 (16.6) | ≥1500 | 0.7 (1.5) |
| Average n-3, Average n-6 (Control) | 7.0 (16.6) | <150 | 0.7 (1.5) |
Abbreviations: LA = linoleic acid; ALA = alpha linolenic acid; EPA = eicosapentaenoic acid; DHA = docosahexaenoic acid; en% = % of food energy. Formula for converting en% to g/2000 kcals = (2000 kcals x (en%/100)/9).
5. Results
A total of 178 participants were randomized to and started one of the three dietary interventions. (see Table 2 for the demographics). After randomization, a total of 37 participants dropped out of the study prior to the end of the 16-week intensive diet intervention phase (12 in the H3 group, 14 in the H3L6 group and 11 in the Control group) and 7 dropped out in the post intervention phase (Week 16-Week 22). Reasons for drop out in all phases included time/too busy [15], lost to follow-up [12], didn’t want to follow diet [7], moved [6], surgery [2], pregnancy [1], and no reason given [1].
Table 2.
Baseline characteristics of the 24-h recall sample.
| Characteristic |
Total (N = 178) |
H3 (N = 60) |
H3L6 (N = 61) |
Control (N = 57) |
|---|---|---|---|---|
| N(%) | N(%) | N(%) | N(%) | |
|
Marital statusa Partnered |
115 (64.6) | 38 (63.3) | 36 (60.0) | 41 (70.7) |
| Non-partnered | 60 (33.7) | 21 (35.0) | 22 (36.7) | 17 (29.3) |
|
Highest education levelb High school or less |
42 (23.6) | 14 (23.3) | 18 (30.0) | 10 (17.2) |
| Undergraduate degree | 78 (43.8) | 25 (41.7) | 22 (36.7) | 31 (53.5) |
| Graduate degree | 56 (31.5) | 21 (35.0) | 18 (30.0) | 17 (29.3) |
|
Employmentc Employed |
110 (61.2) | 31 (51.7) | 39 (65.0) | 39 (67.2) |
| Student | 33 (18.5) | 13 (21.7) | 9 (15.0) | 11 (19.0) |
| Retired/Caretaker | 22 (12.4) | 11 (18.3) | 7 (11.7) | 4 (6.9) |
| Disabled/Unemployed | 12 (6.7) | 4 (6.7) | 4 (6.7) | 4 (6.9) |
|
Race/Ethnicity White |
134 (75.3) | 44 (73.4) | 45 (75.0) | 45 (77.6) |
| Black | 33 (18.5) | 8 (13.3) | 14 (23.3) | 11 (19.0) |
| Other | 11 (6.2) | 8 (13.3) | 1 (1.7) | 2 (3.4) |
|
Sex Female |
157 (88.2) | 51 (85.0) | 56 (93.3) | 50 (86.2) |
| Male | 21 (11.8) | 9 (15.0) | 4 (6.7) | 8 (13.8) |
| Age (years) Mean(SD) | 38.3 (12.0) | 38.8 (12.0) | 39.7 (11.6) | 36.5 (12.4) |
Missing data for 3 participants.
Missing data for 2 participants.
Missing data for 1 participant.
5.1. Weight/BMI
No significant weight changes occurred during the intensive diet intervention period or the end of trial as determined by a sign rank test comparing Week 0 (baseline) with Week 16 BMI (p = 0.1) and Week 0 with Week 22 BMI (p = 0.9). There were no significant inter-group differences in BMI at Week 0 or Week 16, as indicated by Kruskal–Wallis tests (χ2 = 0.692, p = 0.7 at Week 0; and χ2 = 0.226, p = 0.9 at Week 16). There were no within-group changes from Week 0 to Week 16 or Week 22 as shown in Table 3.
Table 3.
BMI at Week 0, Week 16 and Week 22 by diet group.
| Diet Group | Week 0 N | BMI Week 0 Mean (SD) | Week 16 N | BMI Week 16 Mean (SD) | Week 22 N | BMI Week 22 Mean (SD) | p-value WK0-16 WK0-22 | |
|---|---|---|---|---|---|---|---|---|
| H3 | 60 | 28.9 (8.2) | 46 | 28.9 (8.3) | 43 | 28.6 (8.2) | 0.4 | 0.5 |
| H3-L6 | 60 | 28.9 (7.0) | 44 | 28.4 (6.3) | 43 | 28.4 (6.4) | 0.6 | 0.7 |
| Control | 57 | 29.6 (7.4) | 46 | 29.1 (7.3) | 46 | 29.3 (7.3) | 0.2 | 1.0 |
| All Participants | 177a | 29.2 (7.5) | 136b | 28.8 (7.3) | 132 | 28.8 (7.3) | 0.1 | 0.9 |
Missing data for 1 subject.
missing data for 5 participants due to missed Week 16 visit.
5.2. 24-hr dietary recall results
Dietary recall data was provided by 177 participants at Week 0, 143 participants at Week 16 and 128 participants at Week 22. No dietary recall data exists for one participant at Week 0, three participants at Week 16, and six participants at Week 22. Data was not included for those who dropped out prior to randomization or were found to be ineligible on the randomization day. All available dietary recall data was included in the analysis at Week 16, including data from those who completed recalls but dropped prior to completing the Week 16 visit. There were no such occasions in the Week 22 time point. Attempts were made to collect two days of 24-hr dietary recall from every participant and were achieved in 93.7% of participants at Week 0, 78.3% of participants at Week 16 and 85.9% of participants at Week 22. Data from the remaining participants (6.3%-Week 0, 21.7%-Week 16, 14.1%-Week 22) is reflective of 1 day of dietary recall.
Table 4 presents the 24-hr dietary recall median nutrient intakes for nutrients of interest. Week 16 results show that the desired maintenance of typical LA intakes were achieved in the Control (6.8 en%) and H3 (7.1 en%) groups and that the differences were not statistically significant from baseline to Week 16 (p = 0.99 and 0.38, respectively). In the H3L6 group, LA intake decreased by 49% (3.2 en %) from baseline intake (p < 0.01), but did not achieve the lofty target decrease to 1.8 en%. There was a slight, but statistically significant increase in ALA from Week 0 to Week 16 in the H3L6 (0.7 en % to 1.1 en%) and H3 (0.7 en% to 0.9 en%) diet groups (p = 0.02 and < 0.01 respectively) but no change in the Control group (0.8 en % to 0.9 en%, p = 0.96). Target EPA+DHA intake in the Control group was achieved with a non-significant change from baseline (60 mg/2000 kcals) to Week 16 (80 mg/2000 kcals,p = 0.62). Median EPA+DHA intake increased in both the H3 (1484 mg/2000 kclas) and H3L6 (1436 mg/2000 kca/s) group at Week 16 by more than 2900%, but fell short of ≥1500 mg/day (both p-values <0.01). Kruskal–Wallis test comparisons between diet groups at Week 16 showed statistically significant differences for LA and EPA+DHA as desired. There was an unplanned increase (p = 0.01) in ALA intake from Week 0 to Week 16 in both active diet groups that resulted in a difference in ALA intake of 0.2 en% between the active diet groups and the Control group.
Table 4.
24hr dietary recall median intake data.
| Total energy (Kcal) | Total fat (en %) | Total protein (en %) | Total SFA (en %) | Total MUFA (en %) | Total PUFA (en %) | LA 18:2 (en %) | LA 18:2 (g/2000 kcal) | ALA 18:3 (en %) | ALA 18:3 (g/2000 kcal) | AA 20:4 (mg/2000 kcal) | EPA (mg/2000 kcal) | DHA (mg/2000 kcal) | EPA + DHA (mg/2000) | |||
|---|---|---|---|---|---|---|---|---|---|---|---|---|---|---|---|---|
| Control | W0 | Median | 1569 | 34.5 | 17.0 | 11.5 | 11.9 | 7.4 | 6.5 | 14.4 | 0.8 | 1.8 | 134 | 16 | 40 | 60 |
| IQR | (1261–1967) | (30.7–38.8) | (14.7–19.1) | (9.6–13.7) | (10.5–13.6) | (6.1–9.5) | (5.5–9.0) | (12.2–20.0) | (0.6–1.1) | (1.3–2.4) | (83–192) | (8–26) | (23–81) | (34–111) | ||
| W16 | Median | 1720 | 29.9 | 17.9 | 7.8 | 10.5 | 7.8 | 6.8 | 15.1 | 0.9 | 2.0 | 109 | 23 | 55 | 80 | |
| IQR | (1240–2099) | (24.1–35.9) | (14.2–22.7) | (6.4–10.3) | (8.8–13.2) | (6.2–10.4) | (5.1–9.5) | (11.3–21.1) | (0.7–1.0) | (1.5–2.2) | (49–169) | (8–35) | (22–139) | (29–174) | ||
| W22 | Median | 1567 | 30.1 | 18.5 | 9.2 | 10.1 | 7.6 | 7.2 | 16 | 0.8 | 1.8 | 137 | 20 | 53 | 74 | |
| IQR | (1245–1888) | (25.0–34.5) | (15.9–21.9) | (6.0–10.6) | (8.0–12.6) | (5.2–11.1) | (4.7–9.6) | (10.4–21.3) | (0.6–1.1) | (1.3–2.4) | (85–215) | (13–33) | (24–104) | (37–137) | ||
| Control-WK16 change (p-value) | 0.3 (0.9918)a | 0.7 | 0.1 (0.9591)a | 0.2 | 20 (0.6225)a | |||||||||||
| H3 | W0 | Median | 1603 | 34.7 | 15.7 | 11.4 | 12.2 | 7.0 | 6.5 | 14.4 | 0.7 | 1.6 | 122 | 11 | 36 | 48 |
| IQR | (1232–1955) | (28.7–39.1) | (12.6–18.6) | (8.4–13.4) | (10.5–13.4) | (5.0–9.1) | (4.5–8.3) | (10.0–18.4) | (0.5–0.9) | (1.1–2.0) | (80–195) | (6–16) | (20–54) | (27–77) | ||
| W16 | Median | 1652 | 34.2 | 18.9 | 10.0 | 11.6 | 8.8 | 7.1 | 15.8 | 0.9 | 2.0 | 83 | 380 | 1063 | 1484 | |
| IQR | (1360–2093) | (28.0–40.3) | (15.5–20.8) | (8.6–13.0) | (9.2–14.0) | (7.2–10.7) | (5.5–8.5) | (12.2–20.0) | (0.7–1.1) | (1.5–2.4) | (41–161) | (218–614) | (599–1747) | (804–2367) | ||
| W22 | Median | 1471 | 34.3 | 17.9 | 10.2 | 11.3 | 8.2 | 6.9 | 15.3 | 0.7 | 1.6 | 124 | 250 | 632 | 861 | |
| IQR | (1073–1838) | (28.5–38.0) | (14.4–22.1) | (7.7–13.3) | (8.8–13.6) | (6.8–10.5) | (5.5–9.0) | (12.2–20.0) | (0.6–0.9) | (1.3–2.0) | (77–223) | (20–511) | (50–1071) | (70–1662) | ||
| H3-WK16 change (p-value) | 0.6 (0.3777)a |
1.3 | 0.2 (0.0159)c | 0.4 | 1436 (0.0000)b | |||||||||||
| H3L6 | W0 | Median | 1568 | 35.2 | 17.8 | 11.3 | 12.3 | 7.0 | 6.3 | 14.0 | 0.7 | 1.6 | 164 | 13 | 36 | 44 |
| H3L6 | IQR | (1193–1841) | (30.1–40.2) | (14.8–21.2) | (9.9–13.0) | (10.1–14.4) | (5.3–9.2) | (4.7–8.3) | (10.4–18.4) | (0.5–1.0) | (1.1–2.2) | (100–237) | (6–26) | (13–78) | (20–96) | |
| W16 | Median | 1494 | 34.7 | 18.5 | 11.6 | 13.1 | 5.4 | 3.2 | 7.1 | 1.1 | 2.4 | 130 | 371 | 964 | 1341 | |
| IQR | (1137–1884) | (29.6–40.9) | (15.8–23.2) | 8.8–13.7 | (11.1–18.8) | (4.4–6.5) | (2.7–4.4) | (6.0–9.8) | (0.8–1.2) | (1.8–2.7) | 79–190 | 211–744 | 530–1482 | 778–2216 | ||
| W22 | Median | 1472 | 33.0 | 18.6 | 12.3 | 12.5 | 5.3 | 3.6 | 8 | 0.8 | 1.8 | 170 | 296 | 722 | 1052 | |
| IQR | (1172–1734) | (28.5–39.8) | (15.3–21.4) | (8.7–14.4) | (8.8–17.6) | (4.0–7.0) | (2.9–4.9) | (6.4–10.9) | (0.6–1.3) | (1.3–2.9) | (90–260) | (43–506) | (110–1212) | (149–1785) | ||
| H3L6-WK16 change (p-value) | −3.1 (0.0000)b | −6.9 | 0.4 (0.0040)c | 0.9 | 1297 (0.0000)b | |||||||||||
| WK16 H3 vs Control (p-value) | 1.0 | 0.6 | <0.0001 | |||||||||||||
| WK16 H3L6 vs Control (p-value) | <0.0001 | 0.01c | <0.0001 | |||||||||||||
| WK16 H3 vs H3L6 (p-value) | <0.0001 | 0.1 | 1.0 | |||||||||||||
Achieved nutrient target.
Achieved nutrient target but not to level planned.
Change occurred when maintenance was nutrient target.
The results of the Week 22 time point show that the nutrient intakes achieved during the intensive diet intervention phase were maintained for LA and ALA in all three diet groups. EPA+DHA in the H3 and H3L6 diet groups remained elevated from baseline (1694% increase in H3 and 2290% increase in H3L6), but to a lesser extent than was seen at Week 16.
5.3. Diet acceptability questionnaire
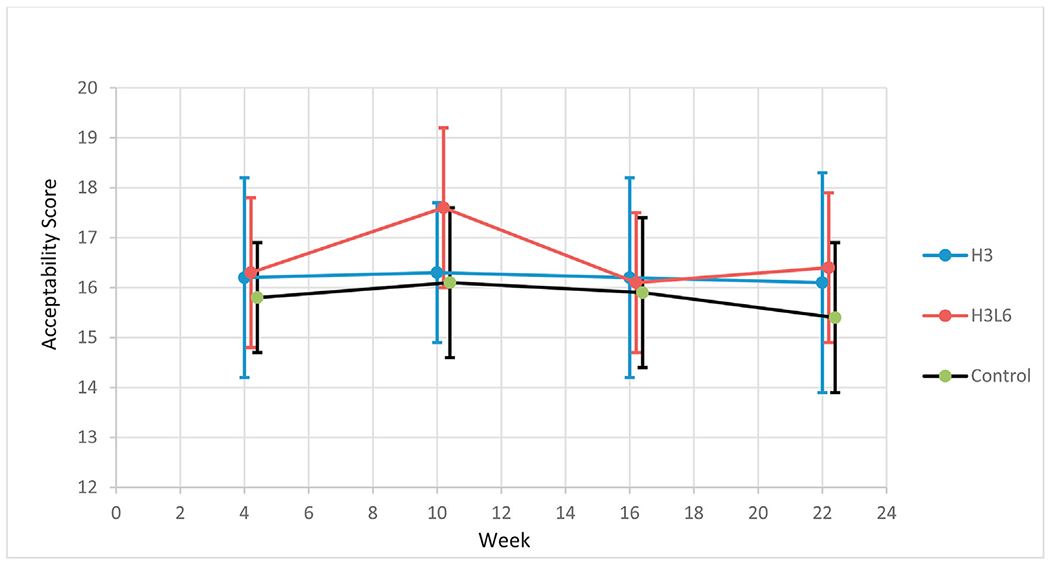
Forty-eight participants completed the diet acceptability questionnaire at the Week 4 timepoint with 15 in the H3 group, 15 in the H3L6 group and 18 in the Control group. Due to drop-out and/or missed study visits, 39 responses are included at Week 10, 38 at Week 16, and 40 at Week 22. All available data, including for those who dropped out of the study, are included (Fig. 2). Mean diet acceptability remained stable throughout the study with good acceptability and remarkably similar acceptability across all three diets at Week 16, with a mean score of 16.2 (SD 3.3) in the H3 group, 16.1 (SD 2.2) in the H3L6 group and 15.9 (SD 2.6) in the Control Group out of a total possible score of 20. Kruskal–Wallis tests did not detect any statistically significant difference between diet groups at Week 4 (p = 0.8), Week 10 (p = 0.3) or Week 16 (p = 0.9).
Fig. 2.
Mean(95% CI) total diet acceptability scores in a subset of study participants.
6. Discussion
The purpose of this publication is to provide details of the dietary intervention methods to support the reporting of outcomes of an RCT comparing three dietary interventions for altering biochemical metabolites thought to be important in nociception in a population of adults with frequent episodic migraine. It is hoped that this report will help address reproducibility concerns common to nutrition research. For example, systematic reviews have often shown no benefit of a dietary manipulation due to marked heterogeneity among dietary clinical trials [35]. Inability to replicate diet interventions due to a lack of detail in the reported diet methods could be partially responsible [35].
Designing a controlled, food based feeding trial in a free-living population presents many challenges including, but not limited to 1) diet adherence; 2) blinding; 3) contamination; 4) control diet design; 5) diet acceptability; 6) study attrition, 7) expectancy/bias and 8) measurement error [36]. A persistent challenge in dietary trials is that the replacement of a food or alteration of a nutrient may modify another with consequence. With this in mind the study diets were designed to be as similar as possible allowing seafood on all diets, with focus on including low n-3 seafood in the Control diet, and replacing corn oil with macadamia nut oil on the H3L6 diet. This oil choice resulted in LA being largely replaced with MUFAs palmitoleic acid (16:1n-7) and oleic acid (18:1n9) from macadamia nut oil in the H3L6 group.
Although our design included multiple methods to promote a high level of diet adherence and these methods were rigorously applied, adherence as shown by 24-hr dietary recall, was good, but remained imperfect. Additional research is required to determine optimum adherence strategies, possibly involving employing mobile health applications [37].
Although participants were not blinded to the identity of study foods, they were blinded to the composition of study oils used therein and the specific fatty acids being manipulated. Study oils were identical in color and consistency between groups. Efforts to maintain blinding and prevent contamination included meeting with participants individually, providing no information about the other study diets and limiting education to discussions of oils and fish as opposed to discussions of omega-3 and omega-6 fatty acids. Other than specific diet differences, diet education was consistent among all three diet arms, with participants receiving the same exact instruction in regard to oils, striving for 5–7 fruit and vegetable servings/day and avoidance of processed foods with added oils. The Control diet was as similar as possible to the active diets with provision of low EPA+DHA seafood, identical education in regards to oils and a healthful diet modeled after the 2010 Dietary Guidelines for Americans [38]. Finally, two registered dietitians trained in nutrition research and these diet methods conducted 99% of the nutrition counseling visits throughout the three and a half years, maximizing consistency among participants.
All three diets were well accepted with no significant between-group differences in acceptability. There was a relatively low dropout rate (21%) with similar dropout across diet groups. There were no significant weight changes from Week 0 to Week 16 or Week 22. Participants achieved considerable success in increasing EPA+DHA and moderate success with lowering levels of LA during the intervention.
Dietary LA was not reduced to the target of 1.8 en% and instead was reduced to 3.2 en% as estimated by 24-hr dietary recall. Erythrocyte data being published elsewhere by the same authors confirmed diet alterations showing a lowering ofLA as a percent of highly unsaturated fatty acids (HUFA) by −14%, −11% and −1% in the H3, H3L6 and Control diet respectively from Week 0 to Week 16. Additionally, in erythrocytesn-3 as a percent of HUFA increased +49%, +43% and +5% in the H3, H3L6, and Control diet respectively between the same time points. It is curious that n-3 in HUFA increased more in the H3 group vs the H3L6 group. Although this difference is not significant and may be related to diet compliance as the H3L6 group took in less n-3 as shown in the 24hr dietary recall data. Achieving 1.8 en% or less is possible with formula diet interventions [39] but is much more difficult to achieve using a food based diet. In our prior pilot study in chronic daily headache sufferers, three 24-hr recalls showed a LA lowering to 2.5 en% with a very similar diet intervention method, but during a shorter intervention period (12 weeks) [25]. To reduce participant burden, in the current study, only two 24-h recalls were planned between Weeks 10 and 16. It is possible either that: 1) measurement error associated with fewer recalls limits our ability to assess LA intakes; or 2) diet fatigue between Weeks 10 and 16 played a role in the higher LA intakes as assessed. In a 2015 review of studies lowering LA, the lowest dietary LA achieved in a controlled trial was 2.0 en% over a 4 week period in a free living population as indicated by weighed food records [40,41]. To our knowledge, no other studies have lowered LA below 2.5 en% with food based diet in a free-living population [39,40,42–44]. To achieve very low LA intakes it may be necessary to revise the diet intervention to include daily food records which are known to alter food intake or to provide 100% of food intake.
Estimating dietary intake via recall methods engenders error, although the best recall method (unannounced, telephone administered 24-hr recall) available was employed. As noted, we collected 2 days of recall, and sometimes 1 day for those who could not be reached by phone, before, during, and after the dietary intervention. More days of recall may be needed to estimate a true mean fatty acid intake. Three days of food records is adequate for assessing group mean energy intake, but additional days of records are required to more precisely assess other nutrients including fats [45,46].
7. Conclusion
In a rigorous, highly controlled study of three dietary interventions providing whole foods to free-living individuals with migraine headache, participants achieved some, but not all dietary intake targets. The diets were considered plausible for improving headaches and attrition was not differential across randomized diets. Future research should focus on increasing adherence to the specifics of dietary guidelines as well as the development of dietary intake methods that minimize both measurement error and participant burden.
Supplementary Material
Sources of support
This project was funded by NIH grant # 1R01AT007813-01A1 from the National Center for Complementary and Integrative Health. The intramural programs of the National Institute on Aging and the National Institute on Alcohol Abuse and Alcoholism provided additional support. Mr. Honvoh was supported by NIH T-32 5T32AT3378-13 Research Fellowship in Complementary and Integrative Healthcare from the National Center for Complementary and Integrative Health.
We thank the staff of the UNC Health Care Metabolic and Nutrition Research Core for preparation and provision of the study foods, the Nutrition and Obesity Research Center Nutrition and Physical Activity Core (NIH DK56350) for conducting 24-hr dietary recalls, the UNC Connected Health Applications & Interventions Core (NIH DK056350) for development and maintenance of the study website, and the North Carolina Translation and Clinical Sciences Institute (UL1TR002489) for their support through the REDcap project development team and the Clinical and Translational Research Core services.
Footnotes
Ethics approval and consent to participate
Ethics approval was provided by the Human Research Ethics Committee of the University of North Carolina (IRB # 13–3284) and all participants provided written informed consent.
Conflict of interest
The authors declare that they have no competing interests.
Appendix A. Supplementary data
Supplementary data to this article can be found online at https://doi.Org/10.1016/j.clnu.2021.04.050.
References
- [1].Ramsden CE, Faurot KR, Zamora D, Suchindran CM, Macintosh BA, Gaylord S, et al. Targeted alteration of dietary n-3 and n-6 fatty acids for the treatment of chronic headaches; A randomized trial. Pain November 2013; 154(11):2441–51. [DOI] [PMC free article] [PubMed] [Google Scholar]
- [2].Lands B Consequences of essential fatty acids. Nutrients September 2012;4(9):1338–57. [DOI] [PMC free article] [PubMed] [Google Scholar]
- [3].Mozzaffarian D, Wu JH. (n-3) fatty acids and cardiovascular health: are effects of EPA and DHA shared or complementary? J Nutr 2012:614S–25S. [DOI] [PMC free article] [PubMed] [Google Scholar]
- [4].Ramsden CE, Ringel A, Majchrzak-Hong SF, Yang J, Blanchard H, Zamora D, et al. Dietary linoleic acid-induced alterations in pro- and anti-nociceptive lipid autacoids: implication for idiopathic pain syndromes? Mol Pain March 2016; 10(12). [DOI] [PMC free article] [PubMed] [Google Scholar]
- [5].Calder PC. Omega-3 fatty acids and inflammatory processes: from molecules to man. Biochem Soc Trans 2017. October;45:1105–15. 5, Oct 15, 2017. [DOI] [PubMed] [Google Scholar]
- [6].Zhang MJ, Spite M. Resolvins: anti-inflammatory and proresolving mediators derived from omega-3 polyunsaturated fatty acids. Annu Rev Nutr August 21, 2012;32:203–27. [DOI] [PubMed] [Google Scholar]
- [7].Morisseau C, Inceoglu B, Schmelzer K, Tsai HJ, Jinks SL, Hegedus CM, et al. Naturally occurring monoepoxides of eicosapentaenoic acid and docosahexaenoic acid are bioactive antihyperalgesic lipids. J Lipid Res December 2010;51(12): 3481–90. [DOI] [PMC free article] [PubMed] [Google Scholar]
- [8].Saini RK, Keum YS. Omega-3 and omega-6 polyunsaturated fatty acids: dietary sources, metabolism, and significance - a review. Life Sci June 15, 2018;203:255–67. [DOI] [PubMed] [Google Scholar]
- [9].Otten Jennifer J, Hellwig Jennifer Pitzi, Meyers Linda D, editors. Dietary referenc intakes: the essential Guide to nutrient requirements. Institute of Medicine of the National Academies; 2006. [Google Scholar]
- [10].Chowdhury R, Warnakula S, Kunutsor S, Crowe F, Ward HA, Johnson L, et al. Association of dietary, circulating, and supplement fatty acids with coronary risk: a systematic review and meta-analysis. Ann Intern Med March 2014;160(6):s.l. Vol. 18. [DOI] [PubMed] [Google Scholar]
- [11].Blasbalg TL, Hibbeln JR, Ramsden CE, Majchrzak SF, Rawlings RR. Changes in consumption of omega-3 and omega-6 fatty acids in the United States during the 20th century. Am J Clin Nutr 5, May 2011;93:950–62. [DOI] [PMC free article] [PubMed] [Google Scholar]
- [12].Kuipers RS, Luxwolda MF, Dijck-Brouwer DA, Eaton SB, Crawford MA, Cordain L, et al. Estimated macronutrient and fatty acid intakes from an East African Paleolithic diet. Br J Nutr 11, December 2010;104:1666–87. [DOI] [PubMed] [Google Scholar]
- [13].U.S. Department of Agricutlure. Agricultural research service 2020. What we Eat in America, NHANES 2017-2018. Nutrient Intakes per 1000kcal from Food and beverages: mean Energy and mean nutrient Amounts per 1000kcal Consumed per individual, by Gener and Age. 2018. [Google Scholar]
- [14].Guyenet SJ, Carlson SE. Increase in adipose tissue linoleic acid of US adults in the last half century. 6, Nov 2015 Adv Nutr 2015. November 13;6(6):660–4. Vol. 13. [DOI] [PMC free article] [PubMed] [Google Scholar]
- [15].Ramsden CE, Zamora D, Makriyannis A, Wood JT, Mann JD, Faurot KR, et al. Diet-induced changes in n-3-and n-6-derived endocannabinoids and reductions in headache pain and psychologic distress. J Pain 8, August 2015;16: 707–16. [DOI] [PMC free article] [PubMed] [Google Scholar]
- [16].Burns JL, Nakamura MT, Ma DWL. Differentiating the biological effects of linoleic acid from arachidonic acid in health and disease. Prostaglandins Leukot Essent Fatty Acids August 2018;135:1–4. [DOI] [PubMed] [Google Scholar]
- [17].Sasaguri Y, Kakita N, Murahashi N, Kato S, Hiraoka K, Morimatsu M, et al. Effect of linoleic acid hydroperoxide on production of matrix metalloproteinases by human aortic endothelial and smooth muscle cells. Atherosclerosis 1993;100(2):189–96. [DOI] [PubMed] [Google Scholar]
- [18].Hiraoka K, Sasaguri Y, Komiya S, Zenmyo M, Inoue A, Morimatsu M. Effects of lipid peroxide on production of matrix metalloproteinase 1 (tissue collage-nase) and 3 (stromelysin) and tissue inhibitor metalloproteinase 1 by human rheumatoid synovial fibroblasts. Exper Mol Pathol 1993;59(3):169–76. [DOI] [PubMed] [Google Scholar]
- [19].Ohuchida M, Sasaguri Y, Morimatsu M, Nagase H, Yagi K. Effect of linoleic acid hydroperoxide on production of matrix metalloproteinases by human skin fibroblasts. Biochem Inter 1991;25(3):447–52. [PubMed] [Google Scholar]
- [20].Caligiuri SPB, Parikh M, Stamenkovic A, Pierce GN, Aukema HM. Dietary modulation of oxylipins in cardiovascular disease and aging. Am J Physiol Heart Circ Physiol November 1, 2017;313(5):H903–18. [DOI] [PubMed] [Google Scholar]
- [21].Innes JK, Calder PC. Omega-6 fatty acids and inflammation. Prostaglandins Leukot Essent Fatty Acids May 2018;132:41–8. [DOI] [PubMed] [Google Scholar]
- [22].Omega-3 fatty acids for the primary and secondary prevention of cardiovascular disease, Abdelhamid AS, Brown TJ, Brainard JS, Biswas P, Thorpe GC, et al. Omega-3 fatty acids for the primary and secondary prevention of cardiovascular disease. Cochrane Database S. CD003177, s.l. : cochrane Database Syst Rev. Cochrane Database Syst Rev July 18, 2018;7. [Google Scholar]
- [23].Fish consumption, fish oil, omega-3 fatty acids, and cardiovascular disease, Kris-Etherton PM, Harris WS, Appel LJ, Committee., American heart association. Nutrition. Circulation November 19, 2002;106(21):2747–57. [DOI] [PubMed] [Google Scholar]
- [24].Ramsden CE, Mann JD, Faurot KR, Lynch C, Imam ST, MacIntosh BA, et al. Low omega-6 vs. low omega-6 plus high omega-3 dietary intervention for chronic daily headache: protocol for a randomized clinical trial. Trials April 15, 2015;12(97). [DOI] [PMC free article] [PubMed] [Google Scholar]
- [25].MacIntosh BA, Ramsden CE, Faurot KR, Zamora D, Mangan M, Hibbeln JR, et al. Low-n-6 and low-n-6 plus high-n-3 diets for use in clinical research. Br J Nutr August 28, 2013;110:559–68. 3. [DOI] [PMC free article] [PubMed] [Google Scholar]
- [26].Mann JD, Faurot KR, MacIntosh B, Palsson OS, Suchindran CM, Gaylord SA, et al. A sixteen-week three-armed, randomized, controlled trial investigating clinical and biochemical effects of targeted alterations in dietary linoleic acid and n-3 EPA+DHA in adults with episodic migraine: study protocol. Prostaglandins Leukot Essent Fatty Acids January 41–52, 2018;128. [DOI] [PMC free article] [PubMed] [Google Scholar]
- [27].Allaire J, Couture P, Leclerc M, Charest A, Marin J, Lépine MC, et al. A randomized, crossover, head-to-head comparison of eicosapentaenoic acid and docosahexaenoic acid supplementation to reduce inflammation markers in men and women: the Comparing EPA to DHA (ComparED) Study. Am J Clin Nutr August 2016;104(2):280–7. [DOI] [PubMed] [Google Scholar]
- [28].Zárate R, El Jaber-Vazdekis N, Tejera N, Pérez JA, Rodríguez C. Significance of long chain polyunsaturated fatty acids in human health. Clin Transl Med December 2017;6(25). [DOI] [PMC free article] [PubMed] [Google Scholar]
- [29].What We Eat in America. NHANES 2011-2012, individuals 2 years and over (excluding breast-fed children), day 1. Available: www.ars.usda.gov/nea/bhnrc/fsrg.
- [30].Baker EJ, Miles EA, Burdge GC, Yaqoob P, Calder PC. Metabolism and functional effects of plant-derived omega-3 fatty acids in humans. Prog Lipid Res October 2016;64:30–56. [DOI] [PubMed] [Google Scholar]
- [31].U.S. Department of Agriculture, Agricultural Research Service. USDA national nutrient database for standard reference, Release 26. Nutrient Data Laboratory; 2013. Home Page,/ba/bhnrc/ndl. [Google Scholar]
- [32].Kris-Etherton PM1, Taylor DS, Yu-Poth S, Huth P, Moriarty K, Fishell V, et al. Polyunsaturated fatty acids in the food chain in the United States. Am J Clin Nutr January 2000;71(1Suppl):179S–88S. [DOI] [PubMed] [Google Scholar]
- [33].Tavakol M, Dennick R. Making sense of Cronbach’s alpha. Int J Med Educ 2011;2(53). [DOI] [PMC free article] [PubMed] [Google Scholar]
- [34].Dunn OJ. Multiple comparisons using rank sums. Technometrics 1964;6:241–52. [Google Scholar]
- [35].Barnard ND, Willett WC, Ding EL. The misuse of meta-analysis in nutrition research. J Am Med Assoc October 17, 2017;318(15):1435–6. [DOI] [PubMed] [Google Scholar]
- [36].Yao CK, Gibson PR, Shepherd SJ. Design of clinical trials evaluating dietary interventions in patients with functional gastrointestinal disorders. Am J Gastroenterol May 2013;108(5):738058. [DOI] [PubMed] [Google Scholar]
- [37].Lee M, Lee H, Kim Y, Kim J, Cho M, Jang J, et al. Mobile app-based health promotion programs: a systematic review of the literature. Int J Environ Res Publ Health December 13, 2018;15(12). [DOI] [PMC free article] [PubMed] [Google Scholar]
- [38].Services US. Department of agriculture and U.S. Department of health and human. Dietary guidelines for Americans. 7th ed. Washington, DC: U.S. Government Printing Office; 2010. December 2010. [Google Scholar]
- [39].Adam O, Tesche A, Wolfram G. Impact of linoleic acid intake on arachidonic acid formation and eicosanoid biosynthesis in humans Sep-Nov 2008;79(3-5):177–81. [DOI] [PubMed] [Google Scholar]
- [40].Wood KE, Mantzioris E, Gibson RA, Ramsden CE, Muhlhausler BS. The effect of modyfying dietary LA and ALA intakes on omega-3 long chain polyunsaturated fatty acid (n-3 LCPUFA) status in human adults: a systematic review and commentary 2015;95:47–55. [DOI] [PMC free article] [PubMed] [Google Scholar]
- [41].Wood KE, lau A, Mantzioris E, Gibosn RA, Ramsden CE. A low omega-6 polyunsaturated fatty acid (n-6 PUFA) diet increases omega-3 (n-3) long chain PUFA status in plasma phospholipids in humans. Muhlhausler BS 2014;90:133–8. [DOI] [PMC free article] [PubMed] [Google Scholar]
- [42].Liou YA1, King DJ, Zibrik D, Innis SM. Decreasing linoleic acid with constant alpha-linolenic acid in dietary fats increases (n-3) eicosapentaenoic acid in plasma phospholipids in healthy men. J Nutr April 2007;137(4):945–52. [DOI] [PubMed] [Google Scholar]
- [43].Allman-Farinelli MA, Hall D, Kingham K, pang D, Petocz P, Favaloro EJ. Comparison of the effects of two low fat diets with different alpha-linolenic: linoleic acid ratios on coagulation and fibrinolysis. Atherosclerosis 1999;142:159–68. [DOI] [PubMed] [Google Scholar]
- [44].Damsgaard CT, Frokiaer H, Lauritzen L. The effects of fish oil and high or low linoleic acid intake on fatty acid composition of human peripheral blood mononuclear cells. Br J Nutr 2008;99:147–54. [DOI] [PubMed] [Google Scholar]
- [45].Basiotis PP, Welsh SO, Cronin FJ, Kelsay JL, Mertz W. Number of days of food intake records required to estimate individual and group nutrient intakes with defined confidence. J Nutr September 1987;117(9):1638–41. [DOI] [PubMed] [Google Scholar]
- [46].Ma Y, Olendzki BC, Pagoto SL, Hurley TG, Magner RP, Ockene IS, et al. Number of 24-hour diet recalls needed to estimate energy intake. Ann Epidemiol August 2009;19(8):553–9. [DOI] [PMC free article] [PubMed] [Google Scholar]
- [47].Zibaeenezhad MJ, Ghavipisheh M, Attar A, Aslani A. Comparison of the effect of omega-3 supplements and fresh fish on lipid profile: a randomized, open-labeled trial. Nutr Diabetes December 19, 2017;7(12). [DOI] [PMC free article] [PubMed] [Google Scholar]
- [48].Mason RP, Sherratt SCR. Omega-3 fatty acid fish oil dietary supplements contain saturated fats and oxidized lipids that may interfere with their intended biological benefits. Biochem Biophys Res Commun January 29, 2017;483(1):425–9. [DOI] [PubMed] [Google Scholar]
Associated Data
This section collects any data citations, data availability statements, or supplementary materials included in this article.