

Abstract
The host‐associated microbiome is an important player in the ecology and evolution of species. Despite growing interest in the medical, veterinary, and conservation communities, there remain numerous questions about the primary factors underlying microbiota, particularly in wildlife. We bridged this knowledge gap by leveraging microbial, genetic, and observational data collected in a wild, pedigreed population of gray wolves (Canis lupus) inhabiting Yellowstone National Park. We characterized body site‐specific microbes across six haired and mucosal body sites (and two fecal samples) using 16S rRNA amplicon sequencing. At the phylum level, we found that the microbiome of gray wolves primarily consists of Actinobacteria, Bacteroidetes, Firmicutes, Fusobacteria, and Proteobacteria, consistent with previous studies within Mammalia and Canidae. At the genus level, we documented body site‐specific microbiota with functions relevant to microenvironment and local physiological processes. We additionally employed observational and RAD sequencing data to examine genetic, demographic, and environmental correlates of skin and gut microbiota. We surveyed individuals across several levels of pedigree relationships, generations, and social groups, and found that social environment (i.e., pack) and genetic relatedness were two primary factors associated with microbial community composition to differing degrees between body sites. We additionally reported body condition and coat color as secondary factors underlying gut and skin microbiomes, respectively. We concluded that gray wolf microbiota resemble similar host species, differ between body sites, and are shaped by numerous endogenous and exogenous factors. These results provide baseline information for this long‐term study population and yield important insights into the evolutionary history, ecology, and conservation of wild wolves and their associated microbes.
Keywords: genetics, gray wolf, host–microbe interactions, mammal, microbiome, pedigree, social behavior, wild canid
We characterized the host‐associated microbiome across multiple body sites in gray wolves living in Yellowstone National Park, USA. Leveraging genetic, microbial, and observational data, we determined that social environment and genetics primarily underly microbial community composition in this wild mammalian system. Photo credit: NPS/Jacob W. Frank, Jim Peaco, and Daniel Stahler.

1. INTRODUCTION
Widespread interest in host‐associated microbiomes has led to critical insights about their form and function. Far from idle passengers, commensal microbes affect host development (Dominguez‐Bello et al., 2019), metabolism (Martin et al., 2019), immunity (Honda & Littman, 2012; Thaiss et al., 2016), reproduction (Al‐Nasiry et al., 2020), stress tolerance (Stothart et al., 2016), and behavior (Ezenwa et al., 2012), among other processes. Although originally limited to human and model systems, there has been a recent surge of studies characterizing microbiota in diverse host taxa. These studies traverse medical (Gupta et al., 2020), veterinary (Rodrigues Hoffmann et al., 2014), and conservation (Trevelline et al., 2019) communities, and include host systems ranging from invertebrates (Petersen & Osvatic, 2018) through humans (Peterson et al., 2009). Examples within Mammalia include carnivorans (Guo et al., 2018; He et al., 2018) cetaceans (Hooper et al., 2019; Sanders et al., 2015), chiropterans (Avena et al., 2016; Ingala et al., 2019), marsupials (Alfano et al., 2015; Cheng et al., 2015), primates (Clayton et al., 2016; Gomez et al., 2015), rodents (Lavrinienko et al., 2018; Suzuki et al., 2019), and ungulates (Gibson et al., 2019; Sun et al., 2019) sampled in captivity and the wild.
Despite increased study, there remain numerous questions about the primary factors underlying microbial species presence and abundance. Of particular interest is the contribution of host genetics, demography, and environment (Bonder et al., 2016; Ceja‐Navarro et al., 2015; Goodrich et al., 2014; Kurilshikov et al., 2017; Rothschild et al., 2018; Spor et al., 2011). As microbiota function in diverse physiological processes, elucidating these factors can have important implications for the evolutionary history, ecology, and conservation of species (DeCandia et al., 2018; Hauffe & Barelli, 2019; Trevelline et al., 2019).
Within wildlife systems, studies often consider broad‐scale patterns of phylosymbiosis or the eco‐evolutionary scenario where host phylogenetic relationships are mirrored by dissimilarity between host‐associated microbiomes (Brooks et al., 2016). This pattern has been observed within numerous host lineages, including invertebrates, rodents, and primates (Brooks et al., 2016). However, the taxonomic scale of comparison can strongly influence the degree of congruence between host phylogenies and microbial dendrograms, as these patterns break down within speciose host genera (Greene et al., 2019; Grond et al., 2020). Further, environmental and behavioral variables often explain significant portions of variance alongside phylogenetics. Metagenomic analyses of gut microbiomes across Mammalia, Aves, Reptilia, Osteichthyes, and others found evidence that host taxonomy, diet, lifespan, and behavior (i.e., activity and social structure) influenced microbial composition to varying degrees (Levin et al., 2021). Similar analyses of 16S rRNA across Mammalia, Aves, Reptilia, Amphibia, and Actinopterygii revealed that diet primarily predicted functional guilds and host phylogeny predicted the specific microbes present (Youngblut et al., 2019). The same pattern emerged within Mammalia, where diet was predictive of gut microbiome convergence at higher taxonomic rankings (such as microbial phylum) and host phylogeny was predictive of gut and skin microbial communities at lower taxonomic rankings (such as microbial family; Nishida & Ochman, 2018; Ross et al., 2018).
These broad‐scale studies provide valuable insights into the evolutionary history of hosts and their associated microbes. However, they lack details that may be relevant to the ecology and conservation of lower host clades. In order to obtain finer‐scale information, researchers have turned to species‐specific studies. Within captive management settings, microbiome analyses have yielded important information about the reproductive (Southern white rhinoceros, Ceratotherium simum simum; Williams et al., 2019) and gastrointestinal (red wolf, Canis rufus; Bragg et al., 2020) health of captive‐housed wildlife. Across host species, artificial diet and housing conditions significantly influence microbiota, as seen in primate microbes “humanized” by captivity (red‐shanked douc, Pygathrix nemaeus, and mantled howler monkey, Alouatta palliata; Clayton et al., 2016). While critical for ex situ conservation management, captive studies fail to capture wild microbes that colonize hosts in their natural habitat. Consequently, in situ studies are required to disentangle the evolutionary and ecological factors shaping wild microbiomes. These factors may include disease (Santa Catalina Island fox, Urocyon littoralis catalinae; DeCandia et al., 2020), habitat fragmentation (common vampire bat, Desmodus rotundus; Ingala et al., 2019) and geography, diet, and anthropogenic pressure (western lowland gorilla, Gorilla gorilla; Gomez et al., 2015), with increasing interest in the contribution of within‐species host genetics (house mouse, Mus musculus; Suzuki et al., 2019).
The majority of in situ microbiome studies focus on gut microbiota (Gomez et al., 2015; Ingala et al., 2019; Sanders et al., 2015; Suzuki et al., 2019), with a few studies targeting skin sites (Avena et al., 2016; Hooper et al., 2019). While informative, narrow focus on one or two sample types provides an incomplete characterization of commensal microbes. Body sites exhibit distinct microbial communities, due to differences in oxygen exposure, nutrient availability, substrate, and environmental factors (The Human Microbiome Project Consortium, 2012). For example, human guts harbor far more anaerobic species than human skin, due to low oxygen availability in the gastrointestinal tract (Coates et al., 2019). Further differences exist between skin microenvironments, where dry sites (such as the forearm) exhibit higher species richness than sebaceous sites (such as the forehead; Byrd et al., 2018; Grice & Segre, 2011). Similar patterns are observed in domestic dogs (Canis familiaris), where microbial species richness is highest at haired body sites (such as the axilla) and lowest at specialized mucosal sites (such as the nostril; Rodrigues Hoffmann et al., 2014). Considered together, this evidence suggests that different factors may influence microbiota at each body site, as seen in wild bank voles (Myodes glareolus; Lavrinienko et al., 2018). This necessitates study of body site‐specific microbiota in the wild to more holistically characterize host‐associated microbiomes.
The present study bridges these knowledge gaps by characterizing in situ wildlife microbiomes across multiple body sites. Specifically, we sequenced host‐associated bacterial communities across six haired and mucosal body sites (and two fecal samples) in a wild pedigreed population of gray wolves (Canis lupus) inhabiting Yellowstone National Park (YNP) in Wyoming, USA (Figure 1). We hypothesized that body sites would harbor distinct microbial communities, with haired sites exhibiting higher alpha diversity than mucosal sites, and fecal sites hosting higher proportions of anaerobic bacteria than nonfecal sites. We further leveraged observational data, biobanked blood and tissue, and the highly resolved YNP wolf pedigree (vonHoldt et al., 2020) to examine genetic, demographic, and environmental factors underlying body site‐specific microbiota in this wild mammalian system. Given that wolves live in kin‐structured family groups comprised of close relatives (Stahler et al., 2020; vonHoldt et al., 2008), we predicted that genetic relatedness would positively correlate with microbial similarity, as seen in studies of humans and model systems (Bonder et al., 2016; Spor et al., 2011). However, as many wolves disperse from their natal groups, we also predicted that unrelated wolves sharing the same social environment (here termed “sampling pack”) would exhibit more similar microbiota than unrelated wolves sampled in different packs, as seen in cohabitating humans (Dill‐McFarland et al., 2019; Song et al., 2013). Pack mates cooperatively share social contacts, resources, and prey items, including elk and (to a more variable degree) bison, deer, moose, or beaver (Metz et al., 2020)—it therefore follows that they share microbes, as well. The social structure of wolves, coupled with the availability of host genetic, microbial, demographic, environmental, and pedigree information provided the unique opportunity to examine body site‐specific microbiota and their underlying factors in a wild mammalian system. Results yielded system‐specific insights, while also contributing to the larger‐scale effort of characterizing wildlife microbiomes in situ.
FIGURE 1.

Gray wolves were reintroduced to Yellowstone National Park in 1995–1996 and have been closely monitored ever since. Photo Credit: NPS/Jacob W. Frank
2. MATERIALS AND METHODS
2.1. Sample and data collection
Gray wolves have been monitored annually by the National Park Service (NPS) since their reintroduction to YNP in 1995 and 1996. Static (e.g., sex) and dynamic (e.g., pack membership) life history variables were collected from aerial and ground surveys conducted during the winter monitoring season. In addition, biological samples were collected between December and February during helicopter captures (whole blood sampled through venipuncture) and field necropsies (tissue sampled from deceased individuals). At the time of microbiome sample collection, body condition was qualitatively scored by two handlers based on sex‐ and age‐specific patterns of weight, muscle/fat condition, coat condition, and injuries/illness detected. All capture and handling protocols were conducted in accordance with the NPS (IACUC permit IMR_YELL_Smith_wolves_2012) and Princeton University (Princeton IACUC #2009A‐17) Institutional Animal Care and Use Committees.
We generated genomic data using whole blood and microbiome data using skin swabs and fresh scat. We used sterile BD BBL™ CultureSwab™ swabs to sample commensal bacteria at six body sites, including ear canal, nostril, lip commissure, axilla, dorsal flank, and perianal area (Figure S1). At each body site, we rubbed the swab tip on the skin roughly 100 times, rotating by 90° every 25 times. We also collected fresh scat if the individual released feces during or immediately prior to sampling. Across three field seasons, we collected 151 microbiome samples from 25 unique individuals. We collected 56 samples from nine wolves during the 2017–2018 season, 35 samples from eight wolves during the 2018–2019 season, and 60 samples from 10 wolves during the 2019–2020 season. Two wolves were resampled in different field seasons, with wolf 1106M sampled in 2017–2018 and 2018–2019, and wolf 907F sampled in 2017–2018 and 2019–2020. One wolf (949M) was sampled after death following complications due to canine distemper virus (Canine morbillivirus). In total, we collected 25 ear canal swabs, 25 nostril swabs, 26 lip commissure swabs, 24 axilla swabs, 24 dorsal flank swabs, 25 perianal swabs, and 2 fresh scat samples. Upon collection, all samples were stored at −80°C until DNA extraction.
2.2. Genomic DNA extraction, RAD sequencing, and data analysis
We extracted DNA from whole blood following the Qiagen DNeasy Blood and Tissue Kit manufacturer protocol (Qiagen Inc.), quantified DNA using Quant‐iT™ PicoGreen™ dsDNA assays or high‐sensitivity Qubit™ fluorometry (Thermo Fisher Scientific), visualized extracts on 1% agarose gels to assess molecular weight, and standardized concentrations to 5 ng/μl. We then generated genomic data using a modified restriction site‐associated DNA sequencing protocol designed by (Ali et al., 2016) and described in (DeCandia et al., 2021; vonHoldt et al., 2020). Briefly, we digested DNA with the restriction enzyme sbfI and ligated uniquely barcoded, biotinylated adaptors. We pooled barcoded samples, sheared DNA to 400 bp using a Covaris LE220, and enriched for fragments containing the ligated adaptor using a streptavidin bead‐binding assay (Invitrogen Dynabeads M‐280). We prepared libraries for sequencing using the NEBNext Ultra II DNA Library Preparation Kit (New England Biolabs) manufacturer protocol and performed size selection for fragments 300–400 bp in length using Agencourt AMPure XP magnetic beads (Beckman Coulter). We standardized final libraries to 10 nM and performed paired‐end sequencing (2 × 150nt) on an Illumina HiSeq2500 or NovaSeq6000 at the Princeton University Lewis Sigler Genomics Core Facility.
After sequencing, we aligned all forward and reverse reads with the restriction enzyme cut site using a custom perl script (Data S1). We then used STACKS v1.42 (Catchen et al., 2013) to demultiplex reads, remove reads with >2 bp barcode mismatches or quality scores <90% (using a sliding window of 15% read length), and filter out PCR duplicates using default parameters in clone_filter. We manually removed samples with <500,000 reads and performed paired‐end alignment to the reference domestic dog CanFam3.1 genome (Lindblad‐Toh et al., 2005) with STAMPY v1.0.21 (Lunter & Goodson, 2011). We used Samtools v0.1.18 (Li et al., 2009) to sort and filter mapped reads for quality scores (MAPQ ≥ 96) and convert files to BAM format.
We then implemented the gstacks and populations modules in STACKS v2.2 (Rochette et al., 2019) to genotype and filter genome‐wide single nucleotide polymorphisms (SNPs) from paired‐end data using the Marukilow model (Maruki & Lynch, 2017). We ran gstacks using a dataset of 32 samples representing 24 unique individuals (N.B., we excluded wolf 949M from these analyses due to microbial sampling after death). We manually determined which duplicate samples exhibited higher read counts and implemented populations using 24 unique samples and the filtering parameters ‐‐write_single_snp (which only retains one SNP per read) and –r 0.9 (which only retains loci genotyped in >90% of wolves). This yielded a dataset of 116,953 variant sites genotyped in 24 wolves. We subsequently removed singletons, doubletons, and X‐chromosome sites (due to our mixed‐sex sample set; Clayton, 2009) using VCFtools v0.1.12b (Danecek et al., 2011). This produced a dataset of 86,545 high‐confidence autosomal SNPs found throughout the genome.
We additionally created a heavily filtered, pedigree‐informative dataset using PLINK (Purcell et al., 2007) to enable pairwise relatedness estimation. This dataset only included biallelic SNPs in Hardy–Weinberg equilibrium (‐‐hwe 0.001) with minor allele frequency >0.45 (‐‐maf 0.45), following recommended guidelines (Huisman, 2017). It further excluded loci exhibiting statistical linkage disequilibrium as evidenced by genotypic correlation (‐‐indep‐pairwise 50 5 0.2). After filtering, the pedigree‐informative dataset retained 517 highly informative SNPs genotyped in 24 wolves. As results obtained using the 86,545 SNP and 517 SNP datasets were largely congruent, we primarily present results using the 517 SNP data (see Appendix S1 for 86,545 SNP results).
To consider familial relationships, we calculated pairwise relatedness coefficients in the R package related (Pew et al., 2015). We used the coancestry function and implemented the dyadic likelihood estimator (dyadml = 1; Milligan, 2003) with allowance for inbreeding (allow.inbreeding = TRUE). We additionally identified putative parents and grandparents of wolves with microbiome data by referencing the full YNP wolf pedigree, which included 871 parent–offspring pairs as of October 2020 (vonHoldt et al., 2020).
2.3. Microbial DNA extraction and amplicon sequencing
We used a modified Qiagen DNeasy PowerSoil Kit protocol (Qiagen Inc.) to extract DNA from each sample, as described in (DeCandia et al., 2019, 2020). Briefly, we placed swab tips or fecal material into PowerBead tubes that were shaken for two cycles on a Qiagen TissueLyserII. Each cycle lasted for 12 min at 20 shakes/s, with the addition of 60 μl of C1 solution occurring between cycles. We then followed the standard manufacturer protocol until the final elution, when we incubated samples for 10–15 min at room temperature with 60 μl C6 buffer preheated to 70°C. We used sterile swab tips as negative controls during extraction and subsequent library preparation and sequencing. We concentrated extracts to 20 μl in a Vacufuge if needed, quantified DNA using a high‐sensitivity Qubit™ fluorometer, standardized high‐yield samples to 2.5 ng/μl, and included low‐yield samples with concentrations as low as 0.062 ng/μl.
We used barcoded forward (GTGCCAGCMGCCGCGGTAA) and reverse (TAATCTWTGGGVHCATCAGG) primers described in (Caporaso et al., 2011) to amplify and tag the 16S ribosomal RNA (rRNA) V4 region. PCR reactions included 5 μl HiFi HotStart ReadyMix (KAPA Biosystems), 3.2 μl primer mix (1.25 μM), and 1.8 μl template DNA and cycling conditions included: initial denaturation of 94°C/3 min, touchdown cycling for 30 cycles of (94°C/45 s, 80–50°C/60 s, 72°C/90 s) decreasing 1°C each cycle, 12 cycles of (94°C/45 s, 50°C/60 s, 72°C/90 s), and final extension of 72°C/10 min. We quantified PCR product using Quant‐iT™ PicoGreen™ dsDNA assays, pooled equal nanograms of uniquely barcoded libraries, and completed a size selection for fragments between 300 and 400nt using Agencourt AMPure XP magnetic beads. We performed paired‐end sequencing (2 × 150nt) on an Illumina MiSeq in the Princeton University Lewis Sigler Genomics Core Facility.
We sequenced 133 samples (axilla, n = 15; dorsal flank, n = 20; ear canal, n = 21; lip commissure, n = 24; nostril, n = 21; perianal area, n = 25; feces, n = 2; negative controls, n = 5) collected from 25 wolves (1–11 samples/wolf, with median = 5 and mode = 6). We used a barcode splitter for paired‐end, dual‐indexed data in the online platform Galaxy (Afgan et al., 2018) to demultiplex raw sequencing reads with allowance for a single nucleotide mismatch in sequence tags. We filtered 4,998,642 demultiplexed reads in QIIME 2 v2020.8 (Bolyen et al., 2019; https://qiime2.org) using the dada2 denoise‐paired plugin (Callahan et al., 2016), which corrects probable sequencing errors, trims low‐quality bases, merges paired‐end reads, and removes chimeric sequences. We retained 4,272,465 sequences containing 8,944 amplicon sequence variants (ASVs; Table S1).
We found that negative controls on average contained two orders of magnitude fewer reads (mean ± SE, 625.60 ± 338.25) than microbiome samples (33,354.20 ± 1,393.65). Negative control reads included 131 ASVs, 127 of which only appeared in one control sample (Table S2). Since frequencies ranged from 2 to 255, we removed ASVs with frequencies lower than 260 from our denoised dataset. This enabled us to mitigate possible contamination while retaining biologically meaningful features (Eisenhofer et al., 2019; Salter et al., 2014). We subsequently removed repeat samples (n = 11), samples collected after death (n = 6), and negative controls (n = 5) for a final dataset of 3,592,905 sequences and 955 ASVs. This included 113 samples (axilla, n = 13; dorsal flank, n = 17; ear canal, n = 19; lip commissure, n = 22; nostril, n = 18; perianal area, n = 22; feces, n = 2; Table 1) collected from 24 wolves (1–6 samples/wolf, with median = 5 and mode = 6; Table S4).
TABLE 1.
Samples included in the microbiome dataset
| Sampling pack | Wolves | Axilla | Flank | Ear Canal | Lip | Nostril | Anus | Feces | Total |
|---|---|---|---|---|---|---|---|---|---|
| 1108M group | 2 | 0 | 0 | 1 | 2 | 2 | 2 | 1 | 8 |
| 8 Mile | 5 | 4 | 5 | 5 | 5 | 3 | 5 | 0 | 27 |
| Alone | 1 | 0 | 0 | 1 | 1 | 1 | 1 | 0 | 4 |
| Cougar Creek | 2 | 0 | 1 | 1 | 1 | 1 | 2 | 0 | 6 |
| Junction Butte | 6 | 6 | 6 | 5 | 6 | 4 | 6 | 0 | 33 |
| Wapiti Lake | 8 | 3 | 5 | 6 | 7 | 7 | 6 | 1 | 35 |
| Total | 24 | 13 | 17 | 19 | 22 | 18 | 22 | 2 | 113 |
2.4. Characterizing the host‐associated microbiome across multiple body sites
We characterized microbial communities inhabiting each body site using QIIME 2 (Bolyen et al., 2019; https://qiime2.org). For these analyses, we employed four measures of bacterial diversity to consider different aspects of microbial community composition (Knight et al., 2018). For alpha (or within sample) diversity, we measured microbial species richness using observed amplicon sequence variants (ASVs; Hagerty et al., 2020) and species equitability using Pielou's evenness (Pielou, 1966). For beta (or between sample) diversity, we used qualitative (unweighted UniFrac) and quantitative (Bray–Curtis dissimilarity) measures to consider differences in species presence and abundance (Lozupone et al., 2007). Unweighted UniFrac is a qualitative measure that calculates the amount of branch length in a phylogenetic tree of ASVs leading to unique members of each microbial community (Lozupone & Knight, 2005). This measure primarily considers species presence and ignores the relative abundance of ASVs. In contrast, Bray–Curtis dissimilarity is a quantitative measure that directly incorporates abundance into its calculations (Bray & Curtis, 1957). By concurrently examining observed ASVs, Pielou's evenness, unweighted UniFrac distances, and Bray–Curtis dissimilarity, we were able to compare microbial species richness, evenness, presence, and abundance across body sites.
We calculated these measures using the core‐metrics‐phylogenetic and alpha‐rarefaction functions in QIIME 2. We employed rarefaction to control for different sequencing depths and calculated unweighted UniFrac distances using a midpoint‐rooted phylogeny constructed using the alignment and phylogeny functions. We used Kruskal–Wallis tests (Kruskal & Wallis, 1952) implemented through the alpha‐group‐significance function to compare observed ASVs and Pielou's evenness across body sites. To assess differences in beta diversity, we implemented PERMANOVA (Anderson, 2001) through the diversity adonis function (Oksanen et al., 2019) and performed principal coordinate analysis (PCoA) using the EMPeror plugin in QIIME 2 (Vázquez‐Baeza et al., 2013).
In order to assign taxonomy to ASVs, we used reference sequences from the Greengenes 13_8 database to train a Naive Bayes classifier (Bokulich et al., 2018; DeSantis et al., 2006). Reference sequences were trimmed to match our target amplicon sequence, clustered at 99% similarity, and compared against representative sequences in our dataset using the classify‐sklearn function in the feature‐classifier plugin for QIIME 2. We subsequently clustered body sites hierarchically using Euclidean distances and the average linkage method. We reported the most abundant orders colonizing each body site to characterize high‐level taxonomy and visualize broad‐scale patterns of taxonomic diversity. We additionally considered lower‐level taxonomy by implementing the linear discriminant analysis (LDA) effect size (LEfSe) method in Galaxy with sequences grouped at the genus level (Segata et al., 2011). This method identifies microbial clades (e.g., genera) that underlie differences between two or more biological groups (e.g., body sites). We used default parameter settings and the one‐against‐all strategy for multigroup analysis. Following LEfSe guidelines, we excluded the two fecal samples due to small within‐group sample size (Segata et al., 2011).
2.5. Assessing environmental, demographic, and genetic drivers of microbiome composition
We created two subsets of the microbiome data to perform body site‐specific analyses. The first subset included perianal samples (n = 22) to represent the gut microbiome (Bassis et al., 2017) and the second subset included dorsal flank samples (n = 17) to represent the skin microbiome (Kong et al., 2017). We then considered potential environmental, demographic, and genetic drivers of microbial community composition. We tested for significant associations with age class, body condition, coat color, field season, sampling pack, and sex using single‐ and multifactor PERMANOVA implemented through the diversity adonis function in QIIME 2 (Anderson, 2001; Oksanen et al., 2019). We note that the variable field season was confounded with sequencing plate; thus, any observed differences may represent true signal of temporal change or artificial signal of technical batch effect.
We additionally tested for correlations between host genetic distance and microbial dissimilarity using full and partial Mantel tests implemented in the R package vegan with 999 permutations (Oksanen et al., 2019). Host genetic distances (Euclidean) were calculated using the dist function in the R package adegenet (Jombart, 2008; Jombart & Ahmed, 2011), and microbial distances were calculated in QIIME 2 using Bray–Curtis dissimilarity and unweighted UniFrac distances. We additionally constructed a dissimilarity matrix for pack membership (where 0 = same pack, 1 = different pack) to implement partial Mantel tests that controlled for shared sampling pack. The test statistic r was based on Spearman's rank correlation rho, and statistical significance was assessed using a threshold of p < .05.
3. RESULTS
3.1. Genomic analyses support multiple pedigree relationships across sampling packs
Pairwise relatedness estimates ranged from 0 between putatively unrelated wolves to 0.484 between first‐order relatives (such as parent‐offspring and full sibling pairs). Although relatedness within packs was significantly higher than between packs (t test, t = 5.95, p < .001; Table S3), numerous outliers represent relatives with different pack membership (Figure S2). Contextualizing these 24 wolves within the larger‐scale YNP wolf pedigree (vonHoldt et al., 2020) further supported the presence of parent‐offspring, full sibling, half sibling, avuncular, and other familial relationships in the dataset (Figure 2; Figure S3), leading to a range of genetic relatedness values across shared and unshared environments. These results matched observational data of wolf dispersal. For example, wolves 1108M and 1107M dispersed from their natal pack (8 Mile) 6–8 weeks before being sampled in their newly formed group (1108M Group), whereas wolf 1047M dispersed from his natal pack (8 Mile) four years prior to being sampled in the Junction Butte pack. In further contrast, wolves 1154F, 1231M, 1232M, and 1233M remained in their natal pack (8 Mile) for the duration of this study.
FIGURE 2.

Pedigree relationships for the 24 wolves included in this study (shaded) and their parents. Colors correspond to sampling pack, and dashed lines connect the same wolf in disparate parts of the pedigree
3.2. Different body sites exhibit distinct microbial communities
Alpha and beta diversity significantly differed between body sites using multiple diversity metrics. Examination of observed ASVs (Kruskal–Wallis test; H = 33.83, df = 6, p < .001) revealed higher species richness at heavily haired body sites and lower species richness at mucosal and fecal sites (Figure 3a). This pattern was largely driven by significantly lower diversity in mucosal nostril and perianal swabs when compared to haired dorsal flank and axilla swabs (Benjamini–Hochberg corrected q‐values < 0.05; Table S5). We also observed significant differences in species equitability between body sites using Pielou's evenness (H = 48.144, df = 6, p < .001), with high equitability observed in fecal and lip communities, moderate equitability at haired sites, and low equitability in the nostril (Figure 3b). Pairwise comparisons returned significant differences between perianal swabs and other body sites (except feces and lip), and nostril swabs and other body sites (except feces; q‐values < 0.05; Table S6).
FIGURE 3.

Alpha and beta diversity significantly differed by body site. Mean and standard error for (a) observed ASVs and (b) Pielou's evenness rarefied to 4,600 sequences. (c) The first two PCs calculated using Bray–Curtis dissimilarity. Asterisks indicate heavily and moderately haired body sites
Regarding beta diversity, we observed significant differences in bacterial species abundance (Bray–Curtis dissimilarity; PERMANOVA, R 2 = .281, df = 6, p = .001) and presence (unweighted UniFrac distances; R 2 = .403, df = 6, p = .001) between body sites. Principal coordinate analysis revealed sample clustering by body site, with differences in centroid position and dispersion evident (Figure 3c; Figure S4). These patterns were supported by hierarchical clustering of body sites using Euclidean distances, where perianal and fecal samples formed one group, mucosal lip and nostril samples formed another, and haired axilla, dorsal flank, and ear canal samples formed the third (Figure S5). This evidence suggests that microbial species richness, evenness, presence, and abundance all contribute to the body site‐specific patterns of diversity observed in YNP wolf microbiomes.
The taxonomic composition of each body site mirrored these patterns (Figure 4). Heavily and moderately haired axilla, dorsal flank, and ear canal samples had high relative abundances of orders Bacteroidales (phylum Bacteroidetes; mean ± SE ranged from 18.1 ± 6.3% to 27.6 ± 4.9%), Actinomycetales (phylum Actinobacteria; ranged from 8.3 ± 2.5% to 18.3 ± 7.7%), Clostridiales (phylum Firmicutes; ranged from 9.0 ± 1.9% to 15.3 ± 3.1%), and Pseudomonadales (phylum Proteobacteria; ranged from 6.5 ± 2.2% to 14.1 ± 5.0%). While these taxa were present at mucosal sites and mucocutaneous junctions, microbial communities inhabiting nonhaired sites proved to be more specialized. Lip commissure samples exhibited high relative abundance of Actinomycetales (18.9 ± 3.5%) and Pseudomonadales (16.0 ± 2.3%), but also had high relative abundances of Flavobacteriales (phylum Bacteroidetes; 13.5 ± 1.6%) and Pasteurellales (phylum Proteobacteria; 12.3 ± 2.5%). In contrast to these fairly even relative abundances, nostril, perianal, and fecal samples exhibited taxonomic skews toward one or more microbial taxa. Nostril samples exhibited high relative abundance of Pseudomonadales (44.9 ± 6.0%), whereas perianal (PA) and fecal (F) communities were dominated by Bacteroidales (PA=34.6 ± 4.2%; F = 50.4 ± 15.9), Clostridiales (PA = 35.4 ± 3.5%; F = 24.7 ± 11.7%), and Fusobacteria (phylum Fusobacteria; PA = 16.2 ± 1.5%; F = 14.9 ± 5.2%).
FIGURE 4.
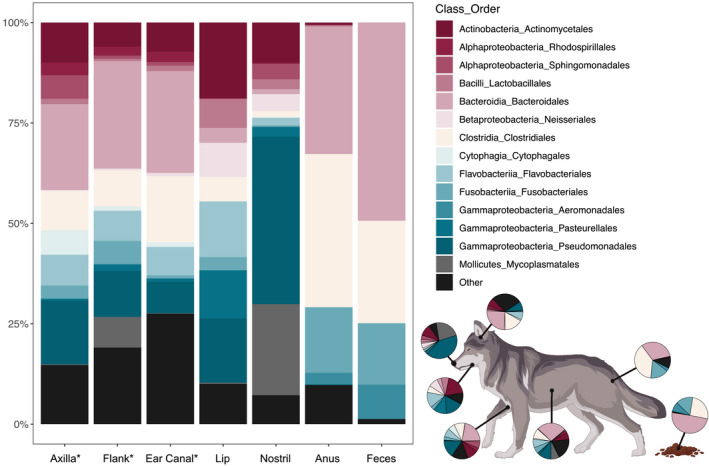
Taxonomic composition of each body site at the order level. Asterisks indicate heavily and moderately haired body sites. Figure created with BioRender
Analyses at the genus level (when known) provided finer‐scale insights into the taxonomic composition of each body site. While the overall pattern remained the same (Figure S6), LEfSe revealed which bacterial players most likely drive differentiation between body sites (Figure 5). This analysis returned 7–14 clades abundant in each of the heavily and moderately haired body sites, with 27 clades abundant in perianal samples, 39 abundant in lip commissure samples, and six abundant in nostril samples (all logarithmic LDA scores >3.290, all p < .006). We annotated each clade as predominantly aerobic or anaerobic to consider the influence on microenvironment on bacterial communities. This revealed a continuum across body sites, where nostril samples hosted exclusively aerobic clades (with one unknown) and an increasing proportion of anaerobic clades were observed in dorsal flank (25.0%), axilla (42.9%), lip commissure (48.7%), ear canal (57.1%), and perianal (100.0%) samples (N.B., the seven clades annotated as “unknown” were combined with aerobic bacteria for these calculations). Dominant clades within the two extremes included aerobic families Moraxellaceae (phylum Proteobacteria), Mycoplasmataceae (phylum Firmicutes), and Neisseriaceae (phylum Proteobacteria) in nostril samples and anaerobic genera Bacteroides (phylum Bacteroidetes), Clostridium (phylum Firmicutes), Prevotella (phylum Bacteroidetes), Phascolarctobacterium (phylum Firmicutes), and Fusobacterium (phylum Fusobacteria) in perianal samples.
FIGURE 5.

Linear discriminant analysis effect sizes for taxa underlying body site differences, where k = kingdom, p = phylum, c = class, o = order, f = family, and g = genus. Asterisks indicate heavily and moderately haired body sites. Open circles denote predominantly anaerobic clades
3.3. Sampling pack and genetic relatedness are consistently associated with gut and skin microbial communities
Single‐factor PERMANOVA of perianal samples (Table S7) consistently returned sampling pack as the variable explaining the most variance within gut microbial communities. This result was statistically significant using both Bray–Curtis dissimilarity (R 2 = .423, df = 5, p = .001) and unweighted UniFrac distances (R 2 = .317, df = 5, p = .015). Body condition (Bray–Curtis, R 2 = .304, df = 4, p = .008) and field season (unweighted UniFrac, R 2 = .154, df = 2, p = .018) similarly explained large proportions of variance, but these results were only significant using one diversity measure each. Multifactor PERMANOVA containing all six explanatory variables (Table 2; Table S8) supported sampling pack as the only variable significantly predictive of gut microbial community composition using either diversity measure (Bray–Curtis, R 2 = .423, df = 5, p = .004; unweighted UniFrac, R 2 = .317, df = 5, p = .030; Figure S7).
TABLE 2.
Results from multifactor PERMANOVA implemented with Bray–Curtis (BC) dissimilarity and unweighted UniFrac (UU) distance matrices for gut and skin microbiota
| Variable | Gut microbiota | Skin microbiota | ||||
|---|---|---|---|---|---|---|
| df | BC | UU | df | BC | UU | |
| Sampling pack | 5 | .423* | .317* | 3 | .208* | .256* |
| Body condition | 4 | .133 | .172 | 2 | .123 | .089 |
| Field season | 2 | .092 | .118 | 2 | .139 | .195* |
| Age class | 2 | .075 | .076 | 2 | .116 | .087 |
| Coat color | 1 | .028 | .031 | 1 | .072* | .063 |
| Sex | 1 | .013 | .026 | 1 | .058 | .062 |
| Residuals | 6 | .237 | .259 | 5 | .284 | .247 |
| Total | 21 | 1.000 | 1.000 | 16 | 1.000 | 1.000 |
Degrees of freedom (df) and R 2 values are provided, with asterisks indicating statistical significance (p < .05).
Single‐factor PERMANOVA of dorsal flank samples (Table S7) similarly returned sampling pack as the variable explaining the most variance within skin microbial communities, although this result was only statistically significant using unweighted UniFrac distances (R 2 = .256, df = 3, p = .007). Field season was also significantly associated with species presence (unweighted UniFrac, R 2 = .202, df = 2, p = .001) in single‐factor analyses. Multifactor PERMANOVA containing all six explanatory variables (Table 2; Table S8) returned sampling pack (Bray–Curtis, R 2 = .208, df = 3, p = .039; unweighted UniFrac, R 2 = .256, df = 3, p = .002), field season (unweighted UniFrac, df = 2, R 2 = .195, p = .002), and coat color (Bray–Curtis, R 2 = .072, df = 1, p = .046) as significant predictors underlying skin microbial communities. As with gut microbiota, sampling pack consistently and significantly explained the greatest proportion of variance in skin microbiota using both distance measures (Figure S7).
We additionally observed significant relationships between host genetic and microbial distance. Perianal swabs exhibited a significantly positive correlation between genetic (517 SNP) and microbial community distance (Mantel test; Bray–Curtis, r = .25, p = .004; unweighted UniFrac, r = .17, p = .018; Figure 6a,b), even when controlling for sampling pack (partial Mantel test; Bray–Curtis, r = .19, p = .010; unweighted UniFrac, r = .12, p = .052; Table S9). In contrast, dorsal flank samples exhibited significant and near‐significant correlations in full Mantel tests (Bray–Curtis, r = .20, p = .062; unweighted UniFrac, r = .25, p = .026; Figure 6c,d), but not in partial Mantel tests that controlled for sampling pack (Bray–Curtis, r = .17, p = .108; unweighted UniFrac, r = .17, p =.091; Table S9). Similar results were obtained with the 86,545 SNP dataset for perianal samples, and no statistically significant results were obtained for dorsal flank samples (Table S9).
FIGURE 6.

Scatter plots and regression lines of pairwise genetic (Euclidean) and microbial (Bray–Curtis and unweighted UniFrac) distances calculated for (a, b) gut and (c, d) skin microbiota
4. DISCUSSION
In the present study, we characterized host‐associated bacterial communities inhabiting haired and mucosal body sites of gray wolves sampled in situ at Yellowstone National Park. Consistent with our hypotheses, we reported distinct microbial communities colonizing each body site, with haired sites hosting high alpha diversity and gut samples harboring the largest proportion of anaerobic bacteria. We additionally contextualized skin and gut microbiota within genetic, demographic, and environmental variables to identify the primary factors underlying microbial community presence and abundance. We found that social environment and host genetics were most consistently associated with microbial composition at both body sites. We additionally reported evidence of body condition influencing gut microbiota, and coat color influencing skin microbiota. These results advance the field of microbial natural history and contribute to our understanding of the evolutionary history, ecology, and conservation of gray wolves and their associated microbes.
Examination of resident phyla enabled high‐level contextualization of wolf‐associated microbiomes within Canidae (Table 3). Across wild and captive gray wolves (Wu et al., 2017), red wolves (Bragg et al., 2020), coyotes (Canis latrans; Colborn et al., 2020; DeCandia et al., 2019; Sugden et al., 2020), red foxes (Vulpes vulpes; DeCandia et al., 2019), gray foxes (Urocyon cinereoargenteus; DeCandia et al., 2019), island foxes (DeCandia et al., 2020), and domestic dogs (Rodrigues Hoffmann et al., 2014), we found the same dominant phyla: Actinobacteria, Bacteroidetes, Firmicutes, Proteobacteria, and Fusobacteria. The first four phyla are considered the core mammalian microbiome and have been documented in humans (Grice & Segre, 2011) and nonhuman mammals (Nishida & Ochman, 2018). Additionally, Fusobacteria has been associated with predatory mammals (Nishida & Ochman, 2018), including marine carnivores and domestic dogs (Nelson et al., 2013). These broad‐scale patterns within Canidae may consequently result from shared evolutionary history or ecology (such as dietary niche; Nishida & Ochman, 2018; Ross et al., 2018).
TABLE 3.
Dominant phyla (ranked 1–5 from highest to lowest relative abundance) inhabiting Canidae species include Actinobacteria (Act.), Bacteroidetes (Bact.), Firmicutes (Firm.), Fusobacteria (Fuso.), and Proteobacteria (Prot.)
| Study | Species | Location | Status a | Site b | N | Act. | Bact. | Firm. | Fuso. | Prot. |
|---|---|---|---|---|---|---|---|---|---|---|
| Present study | Canis lupus | USA | W | A | 13 | 4 | 1 | 3 | — | 2 |
| — | — | — | — | DF | 17 | 4 | 1 | 3 | — | 2 |
| — | — | — | — | EC | 19 | 4 | 1 | 2 | — | 3 |
| — | — | — | — | LC | 22 | 2 | 3 | 4 | 5 | 1 |
| — | — | — | — | N | 18 | 3 | 5 | 4 | — | 1 |
| — | — | — | — | PA | 22 | 5 | 2 | 1 | 3 | 4 |
| — | — | — | — | Scat | 2 | 5 | 1 | 2 | 3 | 4 |
| Wu et al. (2017) | Canis lupus | China | CM | Scat | 14 | 4 | 2 | 1 | 5 | 3 |
| Bragg et al. (2020) | Canis rufus | USA | W | Scat | 2 | 5 | 3 | 1 | 2 | 4 |
| — | — | — | CM | Scat | 3 | 5 | 2 | 3 | 1 | 4 |
| — | — | — | CM,K | Scat | 10 | 4 | 3 | 1 | 2 | 5 |
| — | — | — | CK | Scat | 34 | 5 | 2 | 1 | 3 | 4 |
| Rodrigues Hoffmann et al. (2014) | Canis familiaris | USA | CU | A | 12 | 3 | 2 | 4 | — | 1 |
| — | — | — | — | PA | 12 | 5 | 3 | 2 | 4 | 1 |
| Colborn et al. (2020) c | Canis latrans | USA | W | Scat | 58 | — | 1 | — | 2 | — |
| Sugden et al. (2020) | Canis latrans | Canada | W | IN | 10 | 5 | 4 | 1 | 2 | 3 |
| DeCandia et al. (2019) | Canis latrans | USA | R | Skin | 4 | 2 | 3 | 4 | — | 1 |
| — | Vulpes vulpes | — | — | Skin | 5 | 3 | 4 | 1 | 5 | 2 |
| — | Urocyon cinereoargenteus | — | — | Skin | 1 | 2 | 1 | — | 4 | 3 |
| DeCandia et al. (2020) | Urocyon littoralis | USA | W | A | 9 | 4 | 2 | 1 | 5 | 3 |
| — | — | — | — | EC | 43 | 2 | 4 | 1 | — | 3 |
| — | — | — | — | EE | 31 | 4 | 3 | 1 | — | 2 |
| — | — | — | — | LC | 29 | 5 | 2 | 3 | 4 | 1 |
| — | — | — | — | N | 15 | 5 | 3 | 1 | — | 2 |
| — | — | — | — | PA | 30 | 4 | 1 | 2 | 5 | 3 |
The different gray shades serve as a simplified heat map—the lower the rank (indicating higher abundance), the darker the shade of gray.
Status indicates whether samples were collected in the wild (W), at rehabilitation centers (R), or in captivity with meat (CM), kibble (CK), or unknown (CU) diet.
Body sites include axilla (A), dorsal flank (DF), ear canal (EC), external ear (EE), intestines (IN), lip commissure (LC), nostril (N), perianal area (PA), scat, or skin.
Taxonomic composition provided at genus level.
In addition to high‐level taxonomy, examination of microbial diversity and genera unique to each body site provides finer‐scale insights into the form and function of commensal microbes. As seen in humans (Grice & Segre, 2011; The Human Microbiome Project Consortium, 2012), gray wolves harbor distinct microbiota at different body sites, consistent with differences in microenvironment and local physiological processes. Increased alpha diversity in haired versus mucosal skin mirrored previous studies conducted in domestic cats (Felis catus; Older et al., 2017), domestic dogs (Rodrigues Hoffmann et al., 2014), and Santa Catalina Island foxes (DeCandia et al., 2020), and may result from increased exposure to exogenous environmental factors. In contrast, lower species richness in mucosal sites suggests colonization by microbes specifically adapted to local conditions, as seen in sebaceous human skin (Grice & Segre, 2011). At the genus and family levels, high proportions of aerobic bacteria in wolf nostrils and anaerobic bacteria in wolf guts suggest that oxygen exposure may contribute to differences between respiratory and gastrointestinal microbiota (Dickson & Huffnagle, 2015; Huffnagle et al., 2017; Jalili‐Firoozinezhad et al., 2019; Thursby & Juge, 2017).
These microbes may further function in body site‐specific processes. For example, dominant nostril families Moraxellaceae, Mycoplasmataceae, and Neisseriaceae have been isolated from the noses of domestic dogs and cats, with imbalances associated with nasal disease (Dorn et al., 2017; Tress et al., 2017). Similarly, dominant perianal genera exhibit numerous digestive and health‐promoting properties. For example, Bacteroides and Clostridium spp. function in bile acid metabolism and digestion of animal proteins and saturated fats (Deng & Swanson, 2015). Although associated with gastrointestinal disease in humans (Hussan et al., 2017), Fusobacterium spp. likely contribute to the breakdown of amino acids in healthy dogs and other mammalian carnivores (Pilla & Suchodolski, 2020; Vázquez‐Baeza et al., 2016; Vital et al., 2015). In addition, Prevotella spp. function in glucose metabolism and glycogen storage (Tomova et al., 2019), and Phascolarctobacterium spp. function in lipid metabolism (Yang et al., 2020). The short‐chain fatty acids produced by these genera (e.g., butyrate) further possess anti‐inflammatory properties that may promote overall gut health (Tomova et al., 2019).
Given significant differences between body sites, we independently identified factors underlying skin and gut microbiota, respectively. Sampling pack emerged as the variable most consistently associated with microbial presence and abundance at both body sites, explaining 31.7%–42.3% of the variance in gut samples and 20.8%–25.6% of the variance in skin samples. This result is consistent with social microbiome theory (Grieneisen et al., 2017; Sarkar et al., 2020) and gray wolf social ecology (Mech & Boitani, 2003; Stahler et al., 2020), as pack members cooperatively share territory, prey, social contacts, and microbes. Similar patterns have been observed in cohabitating humans (Dill‐McFarland et al., 2019; Song et al., 2013) and nonhuman mammals (Goodfellow et al., 2019; Leclaire et al., 2014; Wikberg et al., 2020) with varying degrees of relatedness.
To disentangle the role of relatedness in these patterns, we leveraged biobanked samples and the highly resolved YNP wolf pedigree (vonHoldt et al., 2020) to evaluate microbial similarity between first‐order relatives, distant relatives, and unrelated dispersers with short (e.g., 1108M and 1107M) and long (e.g., 1047M) histories of dispersal from their natal packs. We found significantly positive correlations between host genetic and microbial distances at both body sites. However, after controlling for shared sampling pack, this result only remained significant for gut samples. This suggests that host genetics influence gut microbes more than skin microbes, perhaps due to differences in environmental exposure or maintenance of specialized microbiota (Grice & Segre, 2011; Thursby & Juge, 2017). Similar patterns have been observed in humans, where cohabitation exerted a stronger effect on the skin microbiome compared to fecal microbiota (Song et al., 2013), as well as in great spotted cuckoos (Clamator glandarius) and magpies (Pica pica), where shared diet and environment were predictive of esophageal but not cloacal microbiota (Lee et al., 2020).
We observed further differences in the secondary factors underlying gut and skin microbial communities. For example, body condition significantly explained 30.4% of variance in gut microbial species abundance (N.B., this value reduced to 13.3% when controlling for sampling pack). This follows previous studies linking body condition, health, and disease to microbial composition in a variety of contexts, including clinical medicine (Gupta et al., 2020), veterinary medicine (Bradley et al., 2016; Rodrigues Hoffmann et al., 2014), and wildlife rehabilitation and conservation (DeCandia et al., 2019, 2020). We additionally found that coat color significantly explained 7.20% of variance in skin microbial species abundance when controlling for sampling pack. This presented a compelling preliminary result, as the mutation underlying melanism in gray wolves encodes for a beta defensin protein known to regulate microbiota and immune processes at the skin barrier (Anderson et al., 2009; Candille et al., 2007; Meade & O'Farrelly, 2019). Consequently, this mutation may lead to characteristic differences in the skin microbiota of black and gray wolves: an exciting frontier for further study.
Characterizing body site‐specific microbiota and the factors underlying them is an important objective within evolution and ecology. While sampling wildlife populations in situ present logistical challenges, these analyses are critical for informing our understanding of the evolutionary history, ecology, and conservation of hosts and their associated microbes. Regarding evolution and ecology, we found that the core microbiota of YNP wolves mirrors numerous species within Canidae, likely due to shared phylogenetic history and characteristics such as carnivory. We additionally found that different body sites host distinct microbiota, with functions and products directly related to physiological processes (e.g., aiding digestion) and host health (e.g., regulating inflammation). We further found that social environment and host genetics influence skin and gut microbiota, with evidence supporting body condition and coat color as secondary factors influencing body site‐specific microbiota.
Considered together, these results provide important baseline information for the long‐term conservation of gray wolves and related species (Trevelline et al., 2019; West et al., 2019). We can now monitor in situ populations for the emergence of novel pathogens or microbial imbalances that may contribute to morbidity and mortality on the landscape (DeCandia et al., 2018). We can further adjust the diet (e.g., increase meat consumption) and social environment (e.g., enable group living) of captive‐managed gray wolves to promote more natural microbiota. This study represents an important step toward these conservation goals and calls for similar studies to be conducted in additional host–microbe systems in captivity and the wild. Host characteristics such as evolutionary history, genetics, ecology, demography, and environment shape microbiota in innumerable, nuanced ways—and microbiota, in turn, shape their hosts. By characterizing the microbiota inhabiting diverse wildlife systems across body sites and environmental contexts, we can elucidate common patterns and processes that deepen our understanding of these relationships and contribute to successful wildlife conservation efforts.
CONFLICT OF INTEREST
None declared.
AUTHOR CONTRIBUTIONS
Alexandra L. DeCandia: Conceptualization (equal); Data curation (equal); Formal analysis (lead); Funding acquisition (equal); Methodology (equal); Visualization (lead); Writing‐original draft (lead); Writing‐review & editing (lead). Kira A. Cassidy: Data curation (equal); Writing‐review & editing (equal). Daniel R. Stahler: Conceptualization (equal); Data curation (equal); Funding acquisition (equal); Methodology (equal); Supervision (equal); Writing‐review & editing (equal). Erin A. Stahler: Data curation (equal); Writing‐review & editing (equal). Bridgett M. vonHoldt: Conceptualization (equal); Funding acquisition (equal); Methodology (equal); Supervision (equal); Writing‐review & editing (equal).
Supporting information
Appendix S1
Data S1
ACKNOWLEDGMENTS
We would like to thank all of the Yellowstone Wolf Project technicians who collected observational data on YNP wolves. We would also like to thank the Smithsonian Conservation Biology Institute (SCBI) for providing salary support for ALD during data analysis and manuscript preparation, and the SCBI microbiome journal club for insightful conversations. This work was supported by Yellowstone Forever, key donors (especially Annie and Bob Graham and Valerie Gates), the Princeton University Department of Ecology and Evolutionary Biology, the National Science Foundation Graduate Research Fellowship under Grant No. DGE1656466, and the Smithsonian Institution Fellowship Program.
DeCandia, A. L. , Cassidy K. A., Stahler D. R., Stahler E. A., & vonHoldt B. M. (2021). Social environment and genetics underlie body site‐specific microbiomes of Yellowstone National Park gray wolves (Canis lupus). Ecology and Evolution, 11, 9472–9488. 10.1002/ece3.7767
DATA AVAILABILITY STATEMENT
Sequence data are available through NCBI's public Sequence Read Archive (https://www.ncbi.nlm.nih.gov/sra) under BioProject PRJNA732683. Microbiome data are available as demultiplexed forward and reverse FASTQ files (BioSamples SAMN19335927 to SAMN19336039), and RAD sequencing data are available as BAM files mapped to the CanFam3.1 domestic dog genome assembly (BioSamples SAMN19336040 to SAMN19336063).
REFERENCES
- Afgan, E. , Baker, D. , Batut, B. , van den Beek, M. , Bouvier, D. , Ech, M. , Chilton, J. , Clements, D. , Coraor, N. , Grüning, B. A. , Guerler, A. , Hillman‐Jackson, J. , Hiltemann, S. , Jalili, V. , Rasche, H. , Soranzo, N. , Goecks, J. , Taylor, J. , Nekrutenko, A. , & Blankenberg, D. (2018). The Galaxy platform for accessible, reproducible and collaborative biomedical analyses: 2018 update. Nucleic Acids Research, 46(W1), W537–W544. 10.1093/nar/gky379 [DOI] [PMC free article] [PubMed] [Google Scholar]
- Alfano, N. , Courtiol, A. , Vielgrader, H. , Timms, P. , Roca, A. L. , & Greenwood, A. D. (2015). Variation in koala microbiomes within and between individuals: Effect of body region and captivity status. Scientific Reports, 5, 10189. 10.1038/srep10189 [DOI] [PMC free article] [PubMed] [Google Scholar]
- Ali, O. A. , O'Rourke, S. M. , Amish, S. J. , Meek, M. H. , Luikart, G. , Jeffres, C. , & Miller, M. R. (2016). Rad capture (Rapture): Flexible and efficient sequence‐based genotyping. Genetics, 202(2), 389–400. 10.1534/genetics.115.183665 [DOI] [PMC free article] [PubMed] [Google Scholar]
- Al‐Nasiry, S. , Ambrosino, E. , Schlaepfer, M. , Morré, S. A. , Wieten, L. , Voncken, J. W. , Spinelli, M. , Mueller, M. , & Kramer, B. W. (2020). The interplay between reproductive tract microbiota and immunological system in human reproduction. Frontiers in Immunology, 11, 378. 10.3389/fimmu.2020.00378 [DOI] [PMC free article] [PubMed] [Google Scholar]
- Anderson, M. J. (2001). A new method for non parametric multivariate analysis of variance. Austral Ecology, 26(2001), 32–46. [Google Scholar]
- Anderson, T. M. , vonHoldt, B. M. , Candille, S. I. , Musiani, M. , Greco, C. , Stahler, D. R. , Smith, D. W. , Padhukasahasram, B. , Randi, E. , Leonard, J. A. , Bustamante, C. D. , Ostrander, E. A. , Tang, H. , Wayne, R. K. , & Barsh, G. S. (2009). Molecular and evolutionary history of melanism in North American gray wolves. Science, 323(5919), 1339–1343. 10.1126/science.1165448 [DOI] [PMC free article] [PubMed] [Google Scholar]
- Avena, C. V. , Parfrey, L. W. , Leff, J. W. , Archer, H. M. , Frick, W. F. , Langwig, K. E. , Kilpatrick, A. M. , Powers, K. E. , Foster, J. T. , & McKenzie, V. J. (2016). Deconstructing the bat skin microbiome: Influences of the host and the environment. Frontiers in Microbiology, 7, 1753. 10.3389/fmicb.2016.01753 [DOI] [PMC free article] [PubMed] [Google Scholar]
- Bassis, C. M. , Moore, N. M. , Lolans, K. , Seekatz, A. M. , Weinstein, R. A. , Young, V. B. , & Hayden, M. K. (2017). Comparison of stool versus rectal swab samples and storage conditions on bacterial community profiles. BMC Microbiology, 17(1), 78. 10.1186/s12866-017-0983-9 [DOI] [PMC free article] [PubMed] [Google Scholar]
- Bokulich, N. A. , Kaehler, B. D. , Rideout, J. R. , Dillon, M. , Bolyen, E. , Knight, R. , Huttley, G. A. , & Gregory Caporaso, J. (2018). Optimizing taxonomic classification of marker‐gene amplicon sequences with QIIME 2's q2‐feature‐classifier plugin. Microbiome, 6(1), 90. 10.1186/s40168-018-0470-z [DOI] [PMC free article] [PubMed] [Google Scholar]
- Bolyen, E. , Rideout, J. R. , Dillon, M. R. , Bokulich, N. A. , Abnet, C. C. , Al‐Ghalith, G. A. , Alexander, H. , Alm, E. J. , Arumugam, M. , Asnicar, F. , Bai, Y. , Bisanz, J. E. , Bittinger, K. , Brejnrod, A. , Brislawn, C. J. , Brown, C. T. , Callahan, B. J. , Caraballo‐Rodríguez, A. M. , Chase, J. , … Caporaso, J. G. (2019). Reproducible, interactive, scalable and extensible microbiome data science using QIIME 2. Nature Biotechnology, 37, 852–857. 10.1038/s41587-019-0209-9 [DOI] [PMC free article] [PubMed] [Google Scholar]
- Bonder, M. J. , Kurilshikov, A. , Tigchelaar, E. F. , Mujagic, Z. , Imhann, F. , Vila, A. V. , Deelen, P. , Vatanen, T. , Schirmer, M. , Smeekens, S. P. , Zhernakova, D. V. , Jankipersadsing, S. A. , Jaeger, M. , Oosting, M. , Cenit, M. C. , Masclee, A. A. M. , Swertz, M. A. , Li, Y. , Kumar, V. , … Zhernakova, A. (2016). The effect of host genetics on the gut microbiome. Nature Genetics, 48(11), 1407–1412. 10.1038/ng.3663 [DOI] [PubMed] [Google Scholar]
- Bradley, C. W. , Morris, D. O. , Rankin, S. C. , Cain, C. L. , Misic, A. M. , Houser, T. , Mauldin, E. A. , & Grice, E. A. (2016). Longitudinal evaluation of the skin microbiome and association with microenvironment and treatment in canine atopic dermatitis. Journal of Investigative Dermatology, 136(6), 1182–1190. 10.1016/j.jid.2016.01.023 [DOI] [PMC free article] [PubMed] [Google Scholar]
- Bragg, M. , Freeman, E. W. , Lim, H. C. , Songsasen, N. , & Muletz‐Wolz, C. R. (2020). Gut microbiomes differ among dietary types and stool consistency in the captive red wolf (Canis rufus). Frontiers in Microbiology, 11, 2777. 10.3389/fmicb.2020.590212 [DOI] [PMC free article] [PubMed] [Google Scholar]
- Bray, J. R. , & Curtis, J. T. (1957). An ordination of the upland forest communities of southern Wisconsin. Ecological Monographs, 27(4), 326–349. 10.2307/1942268 [DOI] [Google Scholar]
- Brooks, A. W. , Kohl, K. D. , Brucker, R. M. , van Opstal, E. J. , & Bordenstein, S. R. (2016). Phylosymbiosis: Relationships and functional effects of microbial communities across host evolutionary history. PLoS Biology, 14(11), e2000225. 10.1371/journal.pbio.2000225 [DOI] [PMC free article] [PubMed] [Google Scholar]
- Byrd, A. L. , Belkaid, Y. , & Segre, J. A. (2018). The human skin microbiome. Nature Reviews Microbiology, 16(3), 143–155. 10.1038/nrmicro.2017.157 [DOI] [PubMed] [Google Scholar]
- Callahan, B. J. , McMurdie, P. J. , Rosen, M. J. , Han, A. W. , Johnson, A. J. A. , & Holmes, S. P. (2016). DADA2: High‐resolution sample inference from Illumina amplicon data. Nature Methods, 13(7), 581–583. 10.1038/nmeth.3869 [DOI] [PMC free article] [PubMed] [Google Scholar]
- Candille, S. I. , Kaelin, C. B. , Cattanach, B. M. , Yu, B. , Thompson, D. A. , Nix, M. A. , Kerns, J. A. , Schmutz, S. M. , Millhauser, G. L. , & Barsh, G. S. (2007). A B‐defensin mutation causes black coat color in domestic dogs. Science, 318, 1418–1424. [DOI] [PMC free article] [PubMed] [Google Scholar]
- Caporaso, J. G. , Lauber, C. L. , Walters, W. A. , Berg‐Lyons, D. , Lozupone, C. A. , Turnbaugh, P. J. , Fierer, N. , & Knight, R. (2011). Global patterns of 16S rRNA diversity at a depth of millions of sequences per sample. Proceedings of the National Academy of Sciences USA, 108(Supplement 1), 4516–4522. 10.1073/pnas.1000080107 [DOI] [PMC free article] [PubMed] [Google Scholar]
- Catchen, J. , Hohenlohe, P. A. , Bassham, S. , Amores, A. , & Cresko, W. A. (2013). Stacks: An analysis tool set for population genomics. Molecular Ecology, 22(11), 3124–3140. 10.1111/mec.12354 [DOI] [PMC free article] [PubMed] [Google Scholar]
- Ceja‐Navarro, J. A. , Vega, F. E. , Karaoz, U. , Hao, Z. , Jenkins, S. , Lim, H. C. , Kosina, P. , Infante, F. , Northen, T. R. , & Brodie, E. L. (2015). Gut microbiota mediate caffeine detoxification in the primary insect pest of coffee. Nature Communications, 6, 7618. 10.1038/ncomms8618 [DOI] [PMC free article] [PubMed] [Google Scholar]
- Cheng, Y. , Fox, S. , Pemberton, D. , Hogg, C. , Papenfuss, A. T. , & Belov, K. (2015). The Tasmanian devil microbiome—Implications for conservation and management. Microbiome, 3(1), 76. 10.1186/s40168-015-0143-0 [DOI] [PMC free article] [PubMed] [Google Scholar]
- Clayton, D. G. (2009). Sex chromosomes and genetic association studies. Genome Medicine, 1, 110. 10.1186/gm110 [DOI] [PMC free article] [PubMed] [Google Scholar]
- Clayton, J. B. , Vangay, P. , Huang, H. , Ward, T. , Hillmann, B. M. , Al‐Ghalith, G. A. , Travis, D. A. , Long, H. T. , van Tuan, B. , van Minh, V. , Cabana, F. , Nadler, T. , Toddes, B. , Murphy, T. , Glander, K. E. , Johnson, T. J. , & Knights, D. (2016). Captivity humanizes the primate microbiome. Proceedings of the National Academy of Sciences USA, 113(37), 201521835. 10.1073/pnas.1521835113 [DOI] [PMC free article] [PubMed] [Google Scholar]
- Coates, M. , Lee, M. J. , Norton, D. , & MacLeod, A. S. (2019). The skin and intestinal microbiota and their specific innate immune systems. Frontiers in Immunology, 10, 2950. 10.3389/fimmu.2019.02950 [DOI] [PMC free article] [PubMed] [Google Scholar]
- Colborn, A. S. , Kuntze, C. C. , Gadsden, G. I. , & Harris, N. C. (2020). Spatial variation in diet‐microbe associations across populations of a generalist North American carnivore. Journal of Animal Ecology, 89, 1952–1960. 10.1111/1365-2656.13266 [DOI] [PubMed] [Google Scholar]
- Danecek, P. , Auton, A. , Abecasis, G. , Albers, C. A. , Banks, E. , DePristo, M. A. , Handsaker, R. E. , Lunter, G. , Marth, G. T. , Sherry, S. T. , McVean, G. , & Durbin, R. (2011). The variant call format and VCFtools. Bioinformatics, 27(15), 2156–2158. 10.1093/bioinformatics/btr330 [DOI] [PMC free article] [PubMed] [Google Scholar]
- DeCandia, A. L. , Brenner, L. J. , King, J. L. , & vonHoldt, B. M. (2020). Ear mite infection is associated with altered microbial communities in genetically depauperate Santa Catalina Island foxes (Urocyon littoralis catalinae). Molecular Ecology, 29, 1463–1475. 10.1111/mec.15325 [DOI] [PubMed] [Google Scholar]
- DeCandia, A. L. , Dobson, A. P. , & vonHoldt, B. M. (2018). Toward an integrative molecular approach to wildlife disease. Conservation Biology, 32(4), 798–807. 10.1111/cobi.13083 [DOI] [PMC free article] [PubMed] [Google Scholar]
- DeCandia, A. L. , Leverett, K. N. , & vonHoldt, B. M. (2019). Of microbes and mange: Consistent changes in the skin microbiome of three canid species infected with Sarcoptes scabiei mites. Parasites & Vectors, 12(1), 488. 10.1186/s13071-019-3724-0 [DOI] [PMC free article] [PubMed] [Google Scholar]
- DeCandia, A. L. , Schrom, E. C. , Brandell, E. E. , Stahler, D. R. , & vonHoldt, B. M. (2021). Sarcoptic mange severity is associated with reduced genomic variation and evidence of selection in Yellowstone National Park wolves (Canis lupus). Evolutionary Applications, 14(2), 429–445. 10.1111/eva.13127 [DOI] [PMC free article] [PubMed] [Google Scholar]
- Deng, P. , & Swanson, K. S. (2015). Gut microbiota of humans, dogs and cats: Current knowledge and future opportunities and challenges. British Journal of Nutrition, 113(S1), S6–S17. 10.1017/S0007114514002943 [DOI] [PubMed] [Google Scholar]
- DeSantis, T. Z. , Hugenholtz, P. , Larsen, N. , Rojas, M. , Brodie, E. L. , Keller, K. , Huber, T. , Dalevi, D. , Hu, P. , & Andersen, G. L. (2006). Greengenes, a chimera‐checked 16S rRNA gene database and workbench compatible with ARB. Applied and Environmental Microbiology, 72(7), 5069–5072. 10.1128/AEM.03006-05 [DOI] [PMC free article] [PubMed] [Google Scholar]
- Dickson, R. P. , & Huffnagle, G. B. (2015). The lung microbiome: New principles for respiratory bacteriology in health and disease. PLoS Pathogens, 11(7), e1004923. 10.1371/journal.ppat.1004923 [DOI] [PMC free article] [PubMed] [Google Scholar]
- Dill‐McFarland, K. A. , Tang, Z. Z. , Kemis, J. H. , Kerby, R. L. , Chen, G. , Palloni, A. , Sorenson, T. , Rey, F. E. , & Herd, P. (2019). Close social relationships correlate with human gut microbiota composition. Scientific Reports, 9, 703. 10.1038/s41598-018-37298-9 [DOI] [PMC free article] [PubMed] [Google Scholar]
- Dominguez‐Bello, M. G. , Godoy‐Vitorino, F. , Knight, R. , & Blaser, M. J. (2019). Role of the microbiome in human development. Gut, 68(6), 1108–1114. 10.1136/gutjnl-2018-317503 [DOI] [PMC free article] [PubMed] [Google Scholar]
- Dorn, E. S. , Tress, B. , Suchodolski, J. S. , Nisar, T. , Ravindran, P. , Weber, K. , Hartmann, K. , & Schulz, B. S. (2017). Bacterial microbiome in the nose of healthy cats and in cats with nasal disease. PLoS One, 12(6), e0180299. 10.1371/journal.pone.0180299 [DOI] [PMC free article] [PubMed] [Google Scholar]
- Eisenhofer, R. , Minich, J. J. , Marotz, C. , Cooper, A. , Knight, R. , & Weyrich, L. S. (2019). Contamination in low microbial biomass microbiome studies: Issues and recommendations. Trends in Microbiology, 27(2), 105–117. 10.1016/j.tim.2018.11.003 [DOI] [PubMed] [Google Scholar]
- Ezenwa, V. O. , Gerardo, N. M. , Inouye, D. W. , Medina, M. , & Xavier, J. B. (2012). Animal behavior and the microbiome. Science, 338(6104), 198–199. 10.1126/science.1227412 [DOI] [PubMed] [Google Scholar]
- Gibson, K. M. , Nguyen, B. N. , Neumann, L. M. , Miller, M. , Buss, P. , Daniels, S. , Ahn, M. J. , Crandall, K. A. , & Pukazhenthi, B. (2019). Gut microbiome differences between wild and captive black rhinoceros – Implications for rhino health. Scientific Reports, 9(1), 7570. 10.1038/s41598-019-43875-3 [DOI] [PMC free article] [PubMed] [Google Scholar]
- Gomez, A. , Petrzelkova, K. , Yeoman, C. J. , Vlckova, K. , Mrázek, J. , Koppova, I. , Carbonero, F. , Ulanov, A. , Modry, D. , Todd, A. , Torralba, M. , Nelson, K. E. , Gaskins, H. R. , Wilson, B. , Stumpf, R. M. , White, B. A. , & Leigh, S. R. (2015). Gut microbiome composition and metabolomic profiles of wild western lowland gorillas (Gorilla gorilla gorilla) reflect host ecology. Molecular Ecology, 24(10), 2551–2565. 10.1111/mec.13181 [DOI] [PubMed] [Google Scholar]
- Goodfellow, C. K. , Whitney, T. , Christie, D. M. , Sicotte, P. , Wikberg, E. C. , & Ting, N. (2019). Divergence in gut microbial communities mirrors a social group fission event in a black‐and‐white colobus monkey (Colobus vellerosus). American Journal of Primatology, 81(10–11), e22966. [DOI] [PMC free article] [PubMed] [Google Scholar]
- Goodrich, J. K. , Waters, J. L. , Poole, A. C. , Sutter, J. L. , Koren, O. , Blekhman, R. , Beaumont, M. , van Treuren, W. , Knight, R. , Bell, J. T. , Spector, T. D. , Clark, A. G. , & Ley, R. E. (2014). Human genetics shape the gut microbiome. Cell, 159(4), 789–799. 10.1016/j.cell.2014.09.053 [DOI] [PMC free article] [PubMed] [Google Scholar]
- Greene, L. K. , Clayton, J. B. , Rothman, R. S. , Semel, B. P. , Semel, M. A. , Gillespie, T. R. , Wright, P. C. , & Drea, C. M. (2019). Local habitat, not phylogenetic relatedness, predicts gut microbiota better within folivorous than frugivorous lemur lineages. Biology Letters, 15(6), 20190028. 10.1098/rsbl.2019.0028 [DOI] [PMC free article] [PubMed] [Google Scholar]
- Grice, E. A. , & Segre, J. A. (2011). The skin microbiome. Nature Reviews Microbiology, 9(4), 244–253. 10.1038/nrmicro2537 [DOI] [PMC free article] [PubMed] [Google Scholar]
- Grieneisen, L. E. , Livermore, J. , Alberts, S. , Tung, J. , & Archie, E. A. (2017). Group living and male dispersal predict the core gut microbiome in wild baboons. Integrative and Comparative Biology, 57(4), 770–785. 10.1093/icb/icx046 [DOI] [PMC free article] [PubMed] [Google Scholar]
- Grond, K. , Bell, K. C. , Demboski, J. R. , Santos, M. , Sullivan, J. M. , & Hird, S. M. (2020). No evidence for phylosymbiosis in western chipmunk species. FEMS Microbiology Ecology, 96(1), fiz182. 10.1093/femsec/fiz182 [DOI] [PubMed] [Google Scholar]
- Guo, W. , Mishra, S. , Zhao, J. , Tang, J. , Zeng, B. O. , Kong, F. , Ning, R. , Li, M. , Zhang, H. , Zeng, Y. , Tian, Y. , Zhong, Y. , Luo, H. , Liu, Y. , Yang, J. , Yang, M. , Zhang, M. , Li, Y. , Ni, Q. , … Li, Y. (2018). Metagenomic study suggests that the gut microbiota of the giant panda (Ailuropoda melanoleuca) may not be specialized for fiber fermentation. Frontiers in Microbiology, 9, 229. 10.3389/fmicb.2018.00229 [DOI] [PMC free article] [PubMed] [Google Scholar]
- Gupta, V. K. , Kim, M. , Bakshi, U. , Cunningham, K. Y. , Davis, J. M. , Lazaridis, K. N. , Nelson, H. , Chia, N. , & Sung, J. (2020). A predictive index for health status using species‐level gut microbiome profiling. Nature Communications, 11, 4635. [DOI] [PMC free article] [PubMed] [Google Scholar]
- Hagerty, S. L. , Hutchison, K. E. , Lowry, C. A. , & Bryan, A. D. (2020). An empirically derived method for measuring human gut microbiome alpha diversity: Demonstrated utility in predicting health‐related outcomes among a human clinical sample. PLoS One, 15(3), e0229204. 10.1371/journal.pone.0229204 [DOI] [PMC free article] [PubMed] [Google Scholar]
- Hauffe, H. C. , & Barelli, C. (2019). Conserve the germs: The gut microbiota and adaptive potential. Conservation Genetics, 20, 19–27. 10.1007/s10592-019-01150-y [DOI] [Google Scholar]
- He, F. , Liu, D. , Zhang, L. , Zhai, J. , Ma, Y. , Xu, Y. , Jiang, G. , Rong, K. , & Ma, J. (2018). Metagenomic analysis of captive Amur tiger faecal microbiome. BMC Veterinary Research, 14, 379. 10.1186/s12917-018-1696-5 [DOI] [PMC free article] [PubMed] [Google Scholar]
- Honda, K. , & Littman, D. R. (2012). The microbiome in infectious disease and inflammation. Annual Review of Immunology, 30, 759–795. 10.1146/annurev-immunol-020711-074937 [DOI] [PMC free article] [PubMed] [Google Scholar]
- Hooper, R. , Brealey, J. C. , van der Valk, T. , Alberdi, A. , Durban, J. W. , Fearnbach, H. , Robertson, K. M. , Baird, R. W. , Bradley Hanson, M. , Wade, P. , Gilbert, M. T. P. , Morin, P. A. , Wolf, J. B. W. , Foote, A. D. , & Guschanski, K. (2019). Host‐derived population genomics data provides insights into bacterial and diatom composition of the killer whale skin. Molecular Ecology, 28(2), 484–502. 10.1111/mec.14860 [DOI] [PMC free article] [PubMed] [Google Scholar]
- Huffnagle, G. B. , Dickson, R. P. , & Lukacs, N. W. (2017). The respiratory tract microbiome and lung inflammation: A two‐way street. Mucosal Immunology, 10(2), 299–306. 10.1038/mi.2016.108 [DOI] [PMC free article] [PubMed] [Google Scholar]
- Huisman, J. (2017). Pedigree reconstruction from SNP data: Parentage assignment, sibship clustering and beyond. Molecular Ecology Resources, 17(5), 1009–1024. 10.1111/1755-0998.12665 [DOI] [PMC free article] [PubMed] [Google Scholar]
- Hussan, H. , Clinton, S. K. , Roberts, K. , & Bailey, M. T. (2017). Fusobacterium's link to colorectal neoplasia sequenced: A systematic review and future insights. World Journal of Gastroenterology, 23(48), 8626–8650. 10.3748/wjg.v23.i48.8626 [DOI] [PMC free article] [PubMed] [Google Scholar]
- Ingala, M. R. , Becker, D. J. , Bak Holm, J. , Kristiansen, K. , & Simmons, N. B. (2019). Habitat fragmentation is associated with dietary shifts and microbiota variability in common vampire bats. Ecology and Evolution, 9(11), 6508–6523. 10.1002/ece3.5228 [DOI] [PMC free article] [PubMed] [Google Scholar]
- Jalili‐Firoozinezhad, S. , Gazzaniga, F. S. , Calamari, E. L. , Camacho, D. M. , Fadel, C. W. , Bein, A. , Swenor, B. , Nestor, B. , Cronce, M. J. , Tovaglieri, A. , Levy, O. , Gregory, K. E. , Breault, D. T. , Cabral, J. M. S. , Kasper, D. L. , Novak, R. , & Ingber, D. E. (2019). A complex human gut microbiome cultured in an anaerobic intestine‐on‐a‐chip. Nature Biomedical Engineering, 3(7), 520–531. 10.1038/s41551-019-0397-0 [DOI] [PMC free article] [PubMed] [Google Scholar]
- Jombart, T. (2008). adegenet: A R package for the multivariate analysis of genetic markers. Bioinformatics, 24(11), 1403–1405. 10.1093/bioinformatics/btn129 [DOI] [PubMed] [Google Scholar]
- Jombart, T. , & Ahmed, I. (2011). adegenet 1.3‐1: New tools for the analysis of genome‐wide SNP data. Bioinformatics, 27(21), 3070–3071. 10.1093/bioinformatics/btr521 [DOI] [PMC free article] [PubMed] [Google Scholar]
- Knight, R. , Vrbanac, A. , Taylor, B. C. , Aksenov, A. , Callewaert, C. , Debelius, J. , Gonzalez, A. , Kosciolek, T. , McCall, L.‐I. , McDonald, D. , Melnik, A. V. , Morton, J. T. , Navas, J. , Quinn, R. A. , Sanders, J. G. , Swafford, A. D. , Thompson, L. R. , Tripathi, A. , Xu, Z. Z. , … Dorrestein, P. C. (2018). Best practices for analysing microbiomes. Nature Reviews Microbiology, 16(7), 410–422. 10.1038/s41579-018-0029-9 [DOI] [PubMed] [Google Scholar]
- Kong, H. H. , Andersson, B. , Clavel, T. , Common, J. E. , Jackson, S. A. , Olson, N. D. , Segre, J. A. , & Traidl‐Hoffmann, C. (2017). Performing skin microbiome research: A method to the madness. Journal of Investigative Dermatology, 137(3), 561–568. 10.1016/j.jid.2016.10.033 [DOI] [PMC free article] [PubMed] [Google Scholar]
- Kruskal, W. H. , & Wallis, W. A. (1952). Use of ranks in one‐criterion variance analysis. Journal of the American Statistical Association, 47(260), 583–621. 10.1080/01621459.1952.10483441 [DOI] [Google Scholar]
- Kurilshikov, A. , Wijmenga, C. , Fu, J. , & Zhernakova, A. (2017). Host genetics and gut microbiome: Challenges and perspectives. Trends in Immunology, 38(9), 633–647. 10.1016/J.IT.2017.06.003 [DOI] [PubMed] [Google Scholar]
- Lavrinienko, A. , Tukalenko, E. , Mappes, T. , & Watts, P. C. (2018). Skin and gut microbiomes of a wild mammal respond to different environmental cues. Microbiome, 6(1), 209. 10.1186/s40168-018-0595-0 [DOI] [PMC free article] [PubMed] [Google Scholar]
- Leclaire, S. , Nielson, J. F. , & Drea, C. M. (2014). Bacterial communities in meerkat anal scent secretions vary with host sex, age, and group membership. Behavioral Ecology, 25(4), 996–1004. 10.1093/beheco/aru074 [DOI] [Google Scholar]
- Lee, C. Y. , Peralta‐Sánchez, J. M. , Martínez‐Bueno, M. , Møller, A. P. , Rabelo‐Ruiz, M. , Zamora‐Muñoz, C. , & Soler, J. J. (2020). The gut microbiota of brood parasite and host nestlings reared within the same environment: Disentangling genetic and environmental effects. ISME Journal, 14(11), 2691–2702. 10.1038/s41396-020-0719-y [DOI] [PMC free article] [PubMed] [Google Scholar]
- Levin, D. , Raab, N. , Pinto, Y. , Rothschild, D. , Zanir, G. , Godneva, A. , Mellul, N. , Futorian, D. , Gal, D. , Leviatan, S. , Zeevi, D. , Bachelet, I. , & Segal, E. (2021). Diversity and functional landscapes in the microbiota of animals in the wild. Science, 372, eabb5352. 10.1126/science.abb5352 [DOI] [PubMed] [Google Scholar]
- Li, H. , Handsaker, B. , Wysoker, A. , Fennell, T. , Ruan, J. , Homer, N. , Marth, G. , Abecasis, G. , & Durbin, R. (2009). The sequence alignment/map format and SAMtools. Bioinformatics, 25(16), 2078–2079. 10.1093/bioinformatics/btp352 [DOI] [PMC free article] [PubMed] [Google Scholar]
- Lindblad‐Toh, K. , Wade, C. M. , Mikkelsen, T. S. , Karlsson, E. K. , Jaffe, D. B. , Kamal, M. , Clamp, M. , Chang, J. L. , Kulbokas, E. J. , Zody, M. C. , Mauceli, E. , Xie, X. , Breen, M. , Wayne, R. K. , Ostrander, E. A. , Ponting, C. P. , Galibert, F. , Smith, D. R. , deJong, P. J. , … Lander, E. S. (2005). Genome sequence, comparative analysis and haplotype structure of the domestic dog. Nature, 438(7069), 803–819. 10.1038/nature04338 [DOI] [PubMed] [Google Scholar]
- Lozupone, C. A. , Hamady, M. , Kelley, S. T. , & Knight, R. (2007). Quantitative and qualitative β diversity measures lead to different insights into factors that structure microbial communities. Applied and Environmental Microbiology, 73(5), 1576–1585. 10.1128/AEM.01996-06 [DOI] [PMC free article] [PubMed] [Google Scholar]
- Lozupone, C. , & Knight, R. (2005). UniFrac: A new phylogenetic method for comparing microbial communities. Applied and Environmental Microbiology, 71(12), 8228–8235. 10.1128/AEM.71.12.8228-8235.2005 [DOI] [PMC free article] [PubMed] [Google Scholar]
- Lunter, G. , & Goodson, M. (2011). Stampy: A statistical algorithm for sensitive and fast mapping of Illumina sequence reads. Genome Research, 21(6), 936–939. 10.1101/gr.111120.110 [DOI] [PMC free article] [PubMed] [Google Scholar]
- Martin, A. M. , Sun, E. W. , Rogers, G. B. , & Keating, D. J. (2019). The influence of the gut microbiome on host metabolism through the regulation of gut hormone release. Frontiers in Physiology, 10, 428. 10.3389/fphys.2019.00428 [DOI] [PMC free article] [PubMed] [Google Scholar]
- Maruki, T. , & Lynch, M. (2017). Genotype calling from population‐genomic sequencing data. G3 Genes, Genomes, Genetics, 7, 1393–1404. 10.1534/g3.117.039008 [DOI] [PMC free article] [PubMed] [Google Scholar]
- Meade, K. G. , & O'Farrelly, C. (2019). Β‐Defensins: Farming the microbiome for homeostasis and health. Frontiers in Immunology, 9, 3072. 10.3389/fimmu.2018.03072 [DOI] [PMC free article] [PubMed] [Google Scholar]
- Mech, L. D. , & Boitani, L. (2003). Wolf social ecology. In Mech L. D., & Boitani L. (Eds.), Wolves: Behavior, ecology, and conservation. University of Chicago Press. [Google Scholar]
- Metz, M. C. , Hebblewhite, M. , Smith, D. W. , Stahler, D. R. , MacNulty, D. R. , Tallian, A. , & Vucetich, J. A. (2020). What wolves eat and why. In Smith D. W., Stahler D. R., & MacNulty D. R. (Eds.), Yellowstone wolves: Science, and discovery in the world's first national park (pp. 157–168). University of Chicago Press. [Google Scholar]
- Milligan, B. G. (2003). Maximum‐likelihood estimation of relatedness. Genetics, 163, 1153–1167. 10.1093/genetics/163.3.1153 [DOI] [PMC free article] [PubMed] [Google Scholar]
- Nelson, T. M. , Rogers, T. L. , & Brown, M. V. (2013). The gut bacterial community of mammals from marine and terrestrial habitats. PLoS One, 8(12), e83655. 10.1371/journal.pone.0083655 [DOI] [PMC free article] [PubMed] [Google Scholar]
- Nishida, A. H. , & Ochman, H. (2018). Rates of gut microbiome divergence in mammals. Molecular Ecology, 27(8), 1884–1897. 10.1111/mec.14473 [DOI] [PMC free article] [PubMed] [Google Scholar]
- Oksanen, J. , Blanchet, F. G. , Friendly, M. , Kindt, R. , Legendre, P. , McGlinn, D. , Minchin, P. R. , O'Hara, R. B. , Simpson, G. L. , Solymos, P. , Stevens, H. H. , Szoecs, E. , & Wagner, H. (2019). vegan: Community ecology package (R package version 2.5‐6). https://cran.r‐project.org/package=vegan [Google Scholar]
- Older, C. E. , Diesel, A. , Patterson, A. P. , Meason‐Smith, C. , Johnson, T. J. , Mansell, J. , Suchodolski, J. S. , & Rodrigues Hoffmann, A. (2017). The feline skin microbiota: The bacteria inhabiting the skin of healthy and allergic cats. PLoS One, 12(6), e0178555. 10.1371/journal.pone.0178555 [DOI] [PMC free article] [PubMed] [Google Scholar]
- Petersen, J. M. , & Osvatic, J. (2018). Microbiomes In Natura: Importance of invertebrates in understanding the natural variety of animal‐microbe interactions. Msystems, 3(2), e00179–17. 10.1128/mSystems.00179-17 [DOI] [PMC free article] [PubMed] [Google Scholar]
- Peterson, J. , Garges, S. , Giovanni, M. , McInnes, P. , Wang, L. , Schloss, J. A. , Bonazzi, V. , McEwen, J. E. , Wetterstrand, K. A. , Deal, C. , Baker, C. C. , Di Francesco, V. , Howcroft, T. K. , Karp, R. W. , Lunsford, R. D. , Wellington, C. R. , Belachew, T. , Wright, M. , Giblin, C. , … Guyer, M. (2009). The NIH Human Microbiome Project. Genome Research, 19(12), 2317–2323. 10.1101/gr.096651.109 [DOI] [PMC free article] [PubMed] [Google Scholar]
- Pew, J. , Muir, P. H. , Wang, J. , & Frasier, T. R. (2015). related: An R package for analysing pairwise relatedness from codominant molecular markers. Molecular Ecology Resources, 15(3), 557–561. 10.1111/1755-0998.12323 [DOI] [PubMed] [Google Scholar]
- Pielou, E. C. (1966). The measurement of diversity in different types of biological collections. Journal of Theoretical Biology, 13, 131–144. 10.1016/0022-5193(66)90013-0 [DOI] [Google Scholar]
- Pilla, R. , & Suchodolski, J. S. (2020). The role of the canine gut microbiome and metabolome in health and gastrointestinal disease. Frontiers in Veterinary Science, 6, 498. 10.3389/fvets.2019.00498 [DOI] [PMC free article] [PubMed] [Google Scholar]
- Purcell, S. , Neale, B. , Todd‐Brown, K. , Thomas, L. , Ferreira, M. A. R. , Bender, D. , Maller, J. , Sklar, P. , de Bakker, P. I. W. , Daly, M. J. , & Sham, P. C. (2007). PLINK: A tool set for whole‐genome association and population‐based linkage analyses. American Journal of Human Genetics, 81(3), 559–575. 10.1086/519795 [DOI] [PMC free article] [PubMed] [Google Scholar]
- Rochette, N. C. , Rivera‐Colón, A. G. , & Catchen, J. M. (2019). Stacks 2: Analytical methods for paired‐end sequencing improve RADseq‐based population genomics. Molecular Ecology, 28(21), 4737–4754. 10.1111/mec.15253 [DOI] [PubMed] [Google Scholar]
- Rodrigues Hoffmann, A. , Patterson, A. P. , Diesel, A. , Lawhon, S. D. , Ly, H. J. , Stephenson, C. E. , Mansell, J. , Steiner, J. M. , Dowd, S. E. , Olivry, T. , & Suchodolski, J. S. (2014). The skin microbiome in healthy and allergic dogs. PLoS One, 9(1), e83197. 10.1371/journal.pone.003197 [DOI] [PMC free article] [PubMed] [Google Scholar]
- Ross, A. A. , Müller, K. M. , Scott Weese, J. , & Neufeld, J. D. (2018). Comprehensive skin microbiome analysis reveals the uniqueness of human skin and evidence for phylosymbiosis within the class Mammalia. Proceedings of the National Academy of Sciences USA, 115(25), E5786–E5795. 10.1073/pnas.1801302115 [DOI] [PMC free article] [PubMed] [Google Scholar]
- Rothschild, D. , Weissbrod, O. , Barkan, E. , Kurilshikov, A. , Korem, T. , Zeevi, D. , Costea, P. I. , Godneva, A. , Kalka, I. N. , Bar, N. , Shilo, S. , Lador, D. , Vila, A. V. , Zmora, N. , Pevsner‐Fischer, M. , Israeli, D. , Kosower, N. , Malka, G. , Wolf, B. C. , … Segal, E. (2018). Environment dominates over host genetics in shaping human gut microbiota. Nature, 555(7695), 210–215. [DOI] [PubMed] [Google Scholar]
- Salter, S. J. , Cox, M. J. , Turek, E. M. , Calus, S. T. , Cookson, W. O. , Moffatt, M. F. , Turner, P. , Parkhill, J. , Loman, N. J. , & Walker, A. W. (2014). Reagent contamination can critically impact sequence‐based microbiome analyses. BMC Biology, 12, 87. [DOI] [PMC free article] [PubMed] [Google Scholar]
- Sanders, J. G. , Beichman, A. C. , Roman, J. , Scott, J. J. , Emerson, D. , McCarthy, J. J. , & Girguis, P. R. (2015). Baleen whales host a unique gut microbiome with similarities to both carnivores and herbivores. Nature Communications, 6, 8285. 10.1038/ncomms9285 [DOI] [PMC free article] [PubMed] [Google Scholar]
- Sarkar, A. , Harty, S. , Johnson, K.‐V.‐A. , Moeller, A. H. , Archie, E. A. , Schell, L. D. , Carmody, R. N. , Clutton‐Brock, T. H. , Dunbar, R. I. M. , & Burnet, P. W. J. (2020). Microbial transmission in animal social networks and the social microbiome. Nature Ecology & Evolution, 4(8), 1020–1035. 10.1038/s41559-020-1220-8 [DOI] [PubMed] [Google Scholar]
- Segata, N. , Izard, J. , Waldron, L. , Gevers, D. , Miropolsky, L. , Garrett, W. S. , & Huttenhower, C. (2011). Metagenomic biomarker discovery and explanation. Genome Biology, 12(6), R60. 10.1186/gb-2011-12-6-r60 [DOI] [PMC free article] [PubMed] [Google Scholar]
- Song, S. J. , Lauber, C. , Costello, E. K. , Lozupone, C. A. , Humphrey, G. , Berg‐Lyons, D. , Gregory Caporaso, J. , Knights, D. , Clemente, J. C. , Nakielny, S. , Gordon, J. I. , Fierer, N. , & Knight, R. (2013). Cohabiting family members share microbiota with one another and with their dogs. Elife, 2, e00458. 10.7554/eLife.00458 [DOI] [PMC free article] [PubMed] [Google Scholar]
- Spor, A. , Koren, O. , & Ley, R. (2011). Unravelling the effects of the environment and host genotype on the gut microbiome. Nature Reviews Microbiology, 9(4), 279–290. 10.1038/nrmicro2540 [DOI] [PubMed] [Google Scholar]
- Stahler, D. R. , Smith, D. W. , Cassidy, K. A. , Stahler, E. E. , Metz, M. C. , McIntyre, R. , & MacNulty, D. R. (2020). Ecology of family dynamics in Yellowstone wolf packs. In Smith D. W., Stahler D. R., & MacNulty D. R. (Eds.), Yellowstone wolves: Science, and discovery in the world's first national park (pp. 42–60). University of Chicago Press. [Google Scholar]
- Stothart, M. R. , Bobbie, C. B. , Schulte‐hostedde, A. I. , Boonstra, R. , Palme, R. , Mykytczuk, N. C. S. , & Newman, A. E. M. (2016). Stress and the microbiome: Linking glucocorticoids to bacterial community dynamics in wild red squirrels. Biology Letters, 12(1), 14–17. 10.1098/rsbl.2015.0875 [DOI] [PMC free article] [PubMed] [Google Scholar]
- Sugden, S. , St. Clair, C. C. , & Stein, L. Y. (2020). Individual and site‐specific variation in a biogeographical profile of the coyote gastrointestinal microbiota. Microbial Ecology, 81, 240–252. 10.1007/s00248-020-01547-0 [DOI] [PubMed] [Google Scholar]
- Sun, C.‐H. , Liu, H.‐Y. , Liu, B. , Yuan, B.‐D. , & Lu, C.‐H. (2019). Analysis of the gut microbiome of wild and captive Père David's deer. Frontiers in Microbiology, 10, 2331. 10.3389/fmicb.2019.02331 [DOI] [PMC free article] [PubMed] [Google Scholar]
- Suzuki, T. A. , Phifer‐Rixey, M. , Mack, K. L. , Sheehan, M. J. , Lin, D. , Bi, K. , & Nachman, M. W. (2019). Host genetic determinants of the gut microbiota of wild mice. Molecular Ecology, 28(13), 3197–3207. 10.1111/mec.15139 [DOI] [PMC free article] [PubMed] [Google Scholar]
- Thaiss, C. A. , Zmora, N. , Levy, M. , & Elinav, E. (2016). The microbiome and innate immunity. Nature, 535(7610), 65–74. 10.1038/nature18847 [DOI] [PubMed] [Google Scholar]
- The Human Microbiome Project Consortium . (2012). Structure, function and diversity of the healthy human microbiome. Nature, 486(7402), 207–214. 10.1038/nature11234 [DOI] [PMC free article] [PubMed] [Google Scholar]
- Thursby, E. , & Juge, N. (2017). Introduction to the human gut microbiota. The Biochemical Journal, 474(11), 1823–1836. 10.1042/BCJ20160510 [DOI] [PMC free article] [PubMed] [Google Scholar]
- Tomova, A. , Bukovsky, I. , Rembert, E. , Yonas, W. , Alwarith, J. , Barnard, N. D. , & Kahleova, H. (2019). The effects of vegetarian and vegan diets on gut microbiota. Frontiers in Nutrition, 6, 47. 10.3389/fnut.2019.00047 [DOI] [PMC free article] [PubMed] [Google Scholar]
- Tress, B. , Dorn, E. S. , Suchodolski, J. S. , Nisar, T. , Ravindran, P. , Weber, K. , Hartmann, K. , & Schulz, B. S. (2017). Bacterial microbiome of the nose of healthy dogs and dogs with nasal disease. PLoS One, 12(5), e0176736. 10.1371/journal.pone.0176736 [DOI] [PMC free article] [PubMed] [Google Scholar]
- Trevelline, B. K. , Fontaine, S. S. , Hartup, B. K. , & Kohl, K. D. (2019). Conservation biology needs a microbial renaissance: A call for the consideration of host‐associated microbiota in wildlife management practices. Proceedings of the Royal Society B: Biological Sciences, 286, 20182448. 10.1098/rspb.2018.2448 [DOI] [PMC free article] [PubMed] [Google Scholar]
- Vázquez‐Baeza, Y. , Hyde, E. R. , Suchodolski, J. S. , & Knight, R. (2016). Dog and human inflammatory bowel disease rely on overlapping yet distinct dysbiosis networks. Nature Microbiology, 1(12), 16177. 10.1038/nmicrobiol.2016.177 [DOI] [PubMed] [Google Scholar]
- Vázquez‐Baeza, Y. , Pirrung, M. , Gonzalez, A. , & Knight, R. (2013). EMPeror: A tool for visualizing high‐throughput microbial community data. GigaScience, 2(1), 2–5. 10.1186/2047-217X-2-16 [DOI] [PMC free article] [PubMed] [Google Scholar]
- Vital, M. , Gao, J. , Rizzo, M. , Harrison, T. , & Tiedje, J. M. (2015). Diet is a major factor governing the fecal butyrate‐producing community structure across Mammalia, Aves and Reptilia. The ISME Journal, 9(4), 832–843. 10.1038/ismej.2014.179 [DOI] [PMC free article] [PubMed] [Google Scholar]
- vonHoldt, B. M. , DeCandia, A. L. , Heppenheimer, E. , Janowitz‐Koch, I. , Shi, R. , Zhou, H. , German, C. A. , Brzeski, K. E. , Cassidy, K. A. , Stahler, D. R. , & Sinsheimer, J. S. (2020). Heritability of interpack aggression in a wild pedigreed population of North American grey wolves. Molecular Ecology, 19, 1764–1775. 10.1111/mec.15349 [DOI] [PMC free article] [PubMed] [Google Scholar]
- Vonholdt, B. M. , Stahler, D. R. , Smith, D. W. , Earl, D. A. , Pollinger, J. P. , & Wayne, R. K. (2008). The genealogy and genetic viability of reintroduced Yellowstone grey wolves. Molecular Ecology, 17(1), 252–274. 10.1111/j.1365-294X.2007.03468.x [DOI] [PubMed] [Google Scholar]
- West, A. G. , Waite, D. W. , Deines, P. , Bourne, D. G. , Digby, A. , McKenzie, V. J. , & Taylor, M. W. (2019). The microbiome in threatened species conservation. Biological Conservation, 229, 85–98. 10.1016/j.biocon.2018.11.016 [DOI] [Google Scholar]
- Wikberg, E. C. , Christie, D. , Sicotte, P. , & Ting, N. (2020). Interactions between social groups of colobus monkeys (Colobus vellerosus) explain similarities in their gut microbiomes. Animal Behaviour, 163, 17–31. 10.1016/j.anbehav.2020.02.011 [DOI] [Google Scholar]
- Williams, C. L. , Ybarra, A. R. , Meredith, A. N. , Durrant, B. S. , & Tubbs, C. W. (2019). Gut microbiota and phytoestrogen‐associated infertility in southern white rhinoceros. MBio, 10(2), e00311‐19. 10.1128/mBio.00311-19 [DOI] [PMC free article] [PubMed] [Google Scholar]
- Wu, X. , Zhang, H. , Chen, J. , Shang, S. , Yan, J. , Chen, Y. , Tang, X. , & Zhang, H. (2017). Analysis and comparison of the wolf microbiome under different environmental factors using three different data of Next Generation Sequencing. Scientific Reports, 7(1), 11332. 10.1038/s41598-017-11770-4 [DOI] [PMC free article] [PubMed] [Google Scholar]
- Yang, F. , Zhang, S. , Tian, M. , Chen, J. , Chen, F. , & Guan, W. (2020). Different sources of high fat diet induces marked changes in gut microbiota of nursery pigs. Frontiers in Microbiology, 11, 859. 10.3389/fmicb.2020.00859 [DOI] [PMC free article] [PubMed] [Google Scholar]
- Youngblut, N. D. , Reischer, G. H. , Walters, W. , Schuster, N. , Walzer, C. , Stalder, G. , Ley, R. E. , & Farnleitner, A. H. (2019). Host diet and evolutionary history explain different aspects of gut microbiome diversity among vertebrate clades. Nature Communications, 10, 2200. 10.1038/s41467-019-10191-3 [DOI] [PMC free article] [PubMed] [Google Scholar]
Associated Data
This section collects any data citations, data availability statements, or supplementary materials included in this article.
Supplementary Materials
Appendix S1
Data S1
Data Availability Statement
Sequence data are available through NCBI's public Sequence Read Archive (https://www.ncbi.nlm.nih.gov/sra) under BioProject PRJNA732683. Microbiome data are available as demultiplexed forward and reverse FASTQ files (BioSamples SAMN19335927 to SAMN19336039), and RAD sequencing data are available as BAM files mapped to the CanFam3.1 domestic dog genome assembly (BioSamples SAMN19336040 to SAMN19336063).