Abstract
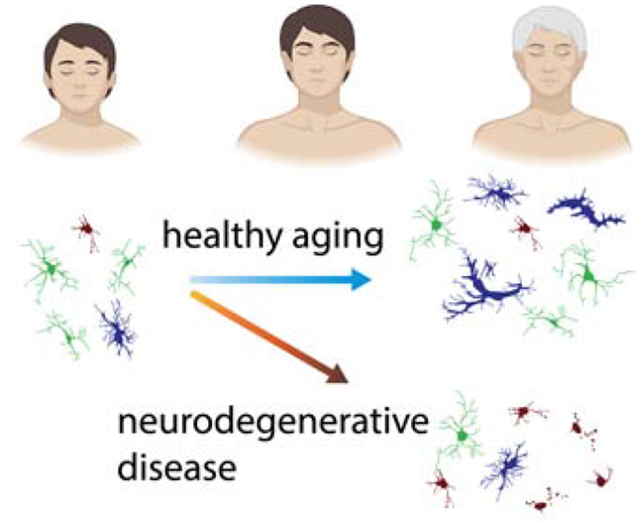
Loss of physiological microglial function may increase the propagation of neurodegenerative diseases. Cellular senescence is a hallmark of aging; thus, we hypothesized age could be a cause of dystrophic microglia. Stereological counts were done for total microglia, two microglia morphologies (hypertrophic, and dystrophic) across the human lifespan. An age-associated increase in the number of dystrophic microglia was found in the hippocampus and frontal cortex. However, the increase in dystrophic microglia was proportional to the age-related increase in the total number of microglia. Thus, aging alone does not explain the presence of dystrophic microglia. We next tested if dystrophic microglia could be a disease-associated microglia morphology. Compared to controls, the number of dystrophic microglia was greater in cases with either Alzheimer’s disease, dementia with Lewy bodies, or limbic-predominant age-related TDP-43 encephalopathy (LATE). These results demonstrate that microglia dystrophy, and not hypertrophic microglia, are the disease-associated microglia morphology. Finally, we found strong evidence for iron homeostasis changes in dystrophic microglia, providing a possible molecular mechanism driving the degeneration of microglia in neurodegenerative disease.
Keywords: Aging, microglia morphology, senescence, neurodegeneration, neuroinflammation, neuropathology
Graphical Abstract
1.1. Introduction
Inflammation and cellular senescence are hallmarks of aging (Kennedy et al., 2014; Lopez-Otin et al., 2013). Almost two decades ago, dystrophic microglia were described with beading and fragmentation of the branches of the microglia (Streit et al., 2004). While the cellular processes appear to be fragmented, they are actually intact, with the bead-like portions connected by thin (0.18 μm) channels (Tischer et al., 2016). In contrast to the hypertrophic microglia often seen following CNS injury, the dystrophic microglia were proposed to be a form of microglia senescence (Streit et al., 2004).
While there is no single specific marker of cellular senescence, a handful of markers, such as p16INK4a, and p21WAF1/Cip1, have some affinity for identifying senescent cells (Gorgoulis et al., 2019). Using a p16INK4a approach to target the removal of senescent cells in a mouse model of tauopathy resulted in reduced tau pathology, neuronal degeneration, and cognitive deficits (Bussian et al., 2018). Given the necessary cellular stressors, microglia can become senescent/dystrophic, as recently reported following a TBI in aged mice, where an increase in the senescent markers p16INK4a and p21WAF1/Cip1 were seen in microglia (Ritzel et al., 2019).
Throughout the body, cellular senescence is associated with the secretion of inflammatory mediators, defined as the senescence-associated secretory phenotype (SASP). The SASP includes the production of matrix metalloproteinases, cytokines, chemokines, nitric oxide, and reactive oxygen species (ROS) (Gorgoulis et al., 2019). Intriguingly, these findings suggest that the senescent/dystrophic microglia, and not the hypertrophic microglia, could produce the chronic inflammatory mediators associated with neuroinflammation and inflammaging. Even a small number of senescent cells in any organ can contribute to disease and by the spread of the senescence phenotype to neighboring healthy cells (Hoare and Narita, 2013).
The hypothesis that dystrophic microglia is an age-associated microglia morphology has not been experimentally tested. While cellular senescence generally increases with age, it can occur at any stage of life in response to stressors (Gorgoulis et al., 2019). This led our first question: are dystrophic microglia associated with chronological age in people? We hypothesized that with increasing years, there would be an increasing proportion of dystrophic microglia. Previous work, including our own, has found dystrophic microglia in aged humans without neurodegenerative pathology (Bachstetter et al., 2015; Lopes et al., 2008; Streit et al., 2004).
In contrast to the view that dystrophic microglia are purely an age-related change in microglial morphology, there is compelling evidence that dystrophic microglia are more closely associated with neurodegenerative disease. Previous studies identified dystrophic microglia in people with age-related neurodegenerative disease, including Alzheimer’s disease (AD) (Bachstetter et al., 2015; Lopes et al., 2008; Sanchez-Mejias et al., 2016; Streit et al., 2009; Tischer et al., 2016), Down syndrome (Streit et al., 2009; Xue and Streit, 2011), Huntington disease (Simmons et al., 2007), dementia with Lewy bodies (Bachstetter et al., 2015; Streit and Xue, 2016), limbic-predominant age-related TDP-43 encephalopathy (LATE) (Bachstetter et al., 2015), and multiple sclerosis (Hametner et al., 2013). These findings lead to our second question: is increased dystrophic microglia a disease associated phenomenon? We hypothesized that the absolute numbers, and/or percentage of dystrophic microglia, would be greater in people with neurodegenerative disease than age-matched controls.
To address these questions, we studied brains from the University of Kentucky departments of Pathology and the UK-ADRC biobank, covering the adult lifespan from 10–90+ years of age. Stereological counts of the total number of microglia, number of hypertrophic microglia, and the number of dystrophic microglia were conducted in three brain regions: hippocampal CA1, frontal cortex gray matter, and white matter. We found that in the absence of neurodegenerative disease, there was only a modest increase in dystrophic microglia with age. However, with neurodegenerative pathology the percentage of microglia observed to be dystrophic was much greater than aged-matched controls. Previous studies have suggested dysfunctional iron metabolism could lead to increased oxidative stress contributing to the degeneration of microglia (Streit et al., 2020). In brains with neurodegenerative pathology, we found a strong association of ferritin light chain (FTL), a protein responsible for storing intracellular iron, with dystrophic microglia compared to other microglia morphologies.
2.1. Materials and Methods
2.1.1. Human subjects:
Tissue samples that contained the hippocampus or frontal cortex were acquired from the University of Kentucky biobank, and from the University of Kentucky Department of Pathology and Laboratory Medicine. The reason for using these latter cases was to incorporate data from younger subjects. Cases were selected by the investigators (JHN and PTN), with the exclusion criteria of pathologically confirmed neurodegenerative disease: specifically, but not limited to, advanced disease pathology associated with Alzheimer’s disease neuropathological change (AD-NC), Lewy body pathology (LBP), LATE neuropathological change (LATE-NC) and vascular dementia. Demographic data are presented in Table 1. The matching hippocampus and frontal cortex were not available for all cases. Three additional cases of LATE-NC, not part of the original cohort where used for the IBA1/FTL analysis.
Table 1:
Aging case series characteristics
| Number of cases | 51 |
|---|---|
| Age | |
| 10–20 | 2 (4%) |
| 20–29 | 5 (10%) |
| 30–39 | 7 (14%) |
| 40–49 | 7 (14%) |
| 50–59 | 5 (10%) |
| 60–69 | 6 (12%) |
| 70–79 | 4 (8%) |
| 80–89 | 13 (25%) |
| 90–99 | 2 (4%) |
| 100+ | 0 (0%) |
| Sex | |
| Male | 17 (36%) |
| Female | 24 (51%) |
| Not available | 6 (13%) |
| Braak NFT stage | |
| 0/I/II | 51 (100%) |
| III/IV | 0 (0%) |
| V/VI | 0 (0%) |
| CERAD rating | |
| None | 51 (100%) |
| Sparse | 0 (0%) |
| Moderate | 0 (0%) |
| Frequent | 0 (0%) |
2.1.2. Immunostaining:
Immunohistochemical (IHC) staining for IBA1 was completed as previously described (Bachstetter et al., 2015). Briefly, microwave antigen retrieval (6 min (power 8, 500 Watts) using citrate buffer (Declare buffer, Cell Marque; Rocklin, CA) was done following de-paraffinization on 8 μm-thick tissue sections. Endogenous peroxidases were quenched in 3% H2O2 in methanol for 30 min. Sections were blocked in 5% normal goat serum at room temperature for 1 hour. Sections were incubated in primary antibodies IBA1 (rabbit polyclonal, 1:1,000, Wako Catalog no. 019–19741, AB_839504); 20–24 hours at 4°C. A biotinylated secondary antibody (Vector Laboratories 1:200) was amplified using avidin-biotin substrate (ABC solution, Vector Laboratories, catalog no. PK-6100), followed by color development in Nova Red, or DAB (Vector Laboratories). The double-label immunofluorescence was completed as previously described (Gal et al., 2018). Briefly, microwave antigen retrieval (6 min (power 8, 500 Watts) using citrate buffer (Declare buffer, Cell Marque; Rocklin, CA) was done following de-paraffinization on 8 μm-thick tissue sections. Sections were incubated for 45 sec at room temperature in a 1x solution of TrueBlack (Cat. #23007, Biotium, Fremont, CA) prepared in 70% ethanol, to reduce auto-fluorescence. Following blocking in 5% normal goat serum, the sections were incubated in IBA1 (rabbit polyclonal, 1:1,000, Wako Catalog no. 019–19741, AB_839504), and ferritin light chain (mouse clone D9, 1:100, Santa Cruz, Catalog no sc-74513, AB_1122837) for 20–24 hours at 4°C. Sections were incubated in secondary antibodies conjugated to Alexa Fluor probes (Life Technologies, 1:200) at room temperature for 1 hour. Control sections were included for each case that omitted one or both of the primary antibodies.
2.1.3. Quantitative image analysis:
Briefly, the Zeiss Axio Scan Z.1 digital slidescanner was used to image the entire stained slide at 40x magnification to create a single high-resolution digital image. Halo software (version 2.3; Indica labs) was used to view the images. Following the fractionator method of stereology, we used the Halo software to generate counting frames 250 × 250 μm, with a 150 μm gap between counting frames using systematic random sampling. A total of 10–20 counting frames were quantified to estimate the number of microglia per unit area in the three brain regions. Classification of microglia as either hypertrophic or dystrophic followed our previously described criteria (Bachstetter et al., 2015). Example photomicrographs of representative cells defined as either hypertrophic or dystrophic microglia is shown in Figure 1. Results were confirmed by two independent observers (REH, and NGC) blind to experimental conditions. Data presented is from REH’s quantification. Numbers of dystrophic microglia in cases with neurodegenerative disease were generated as part of our prior published study (Bachstetter et al., 2015), and follow comparable methods to those described above.
Figure 1: Representative examples of the microglia morphological appearances seen in the cases.
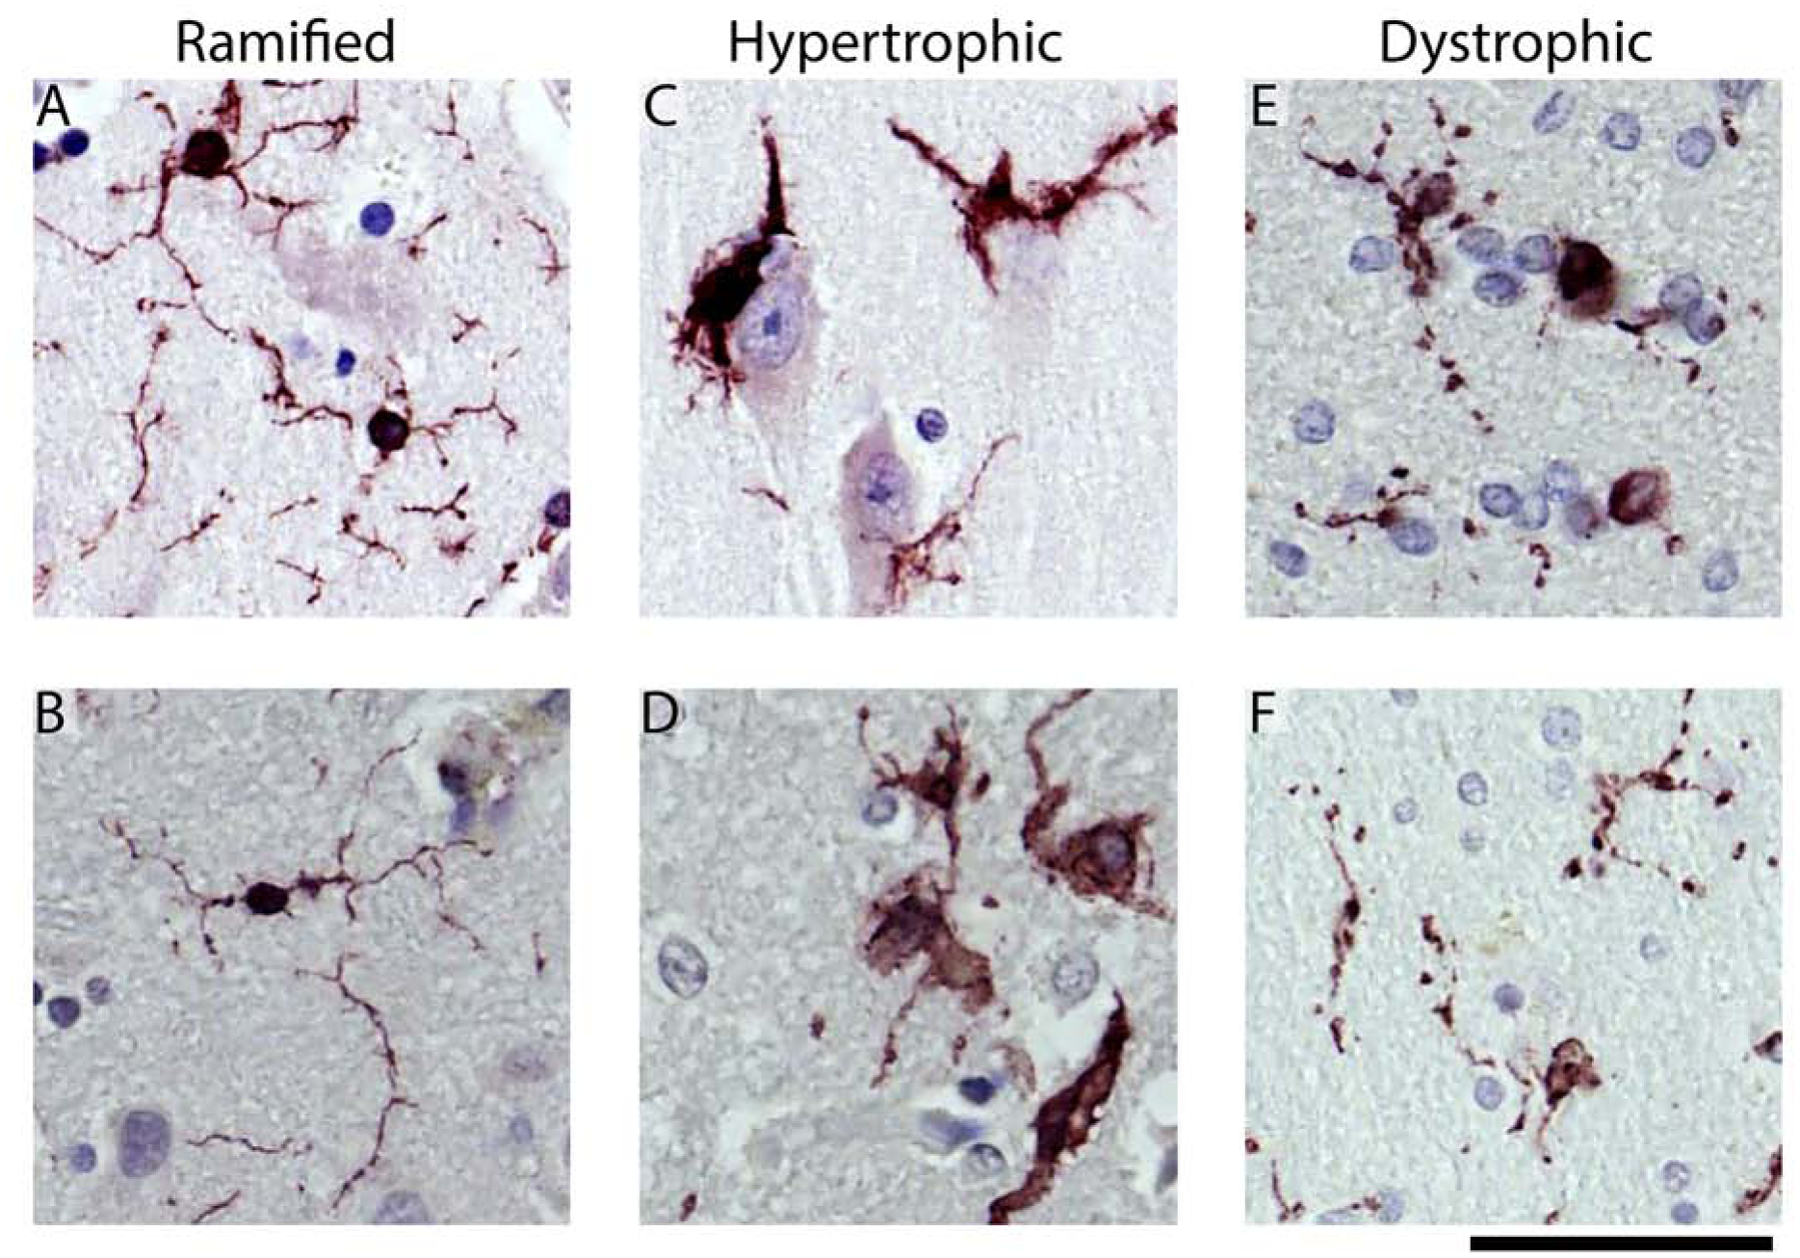
(A, B) Shows examples of the ramified microglia. Hypertrophic microglia are shown in (C, D). In (C), microglia can be seen surrounding the soma of a pyramidal neuron. (E) shows dystrophic microglia with swellings, beaded, and discontinuous processes. (F) shows an example of dystrophic microglia that are small and de-ramified, with beaded processes. The scale bar is 50 μm.
For the IBA1 and FTL colocalization analysis a Zeiss Axio Scan Z.1 digital slidescanner was used to image the entire stained slide at 40x magnification to create a single high-resolution digital image. Halo software (version 2.3; Indica labs) was used to view the images. Using HALO imaging software and viewing only the IBA1 channel when counting and determining the morphology of the cells, we generated an ROI around each microglia, and define it as ramified, hypertrophic or dystrophic. We identified at random 10 microglia from each morphology for each of three cases of LATE-NC. We then used the area colocalization FL algorithm (Halo software, version 2.3; Indica labs) on the ROIs to determine the area of colocalization of IBA1 and FTL for the three microglia morphologies.
2.1.4. Statistics:
JMP Pro software version 14.0 (SAS institute, Cary, NC, USA) or GraphPad Prism software version 8.0 was used to generate graphs and for statistical analysis. Linear regression and Spearman r were used to compare the effect of age on microglia morphological state. Mean ± 95% confidence interval are shown for the regressions, as well the data point for each case. The standard least squares model used to compare hypertrophic and dystrophic microglia was corrected for age. Source data is available in supplemental tables 1–3.
3.1. Results
Microglia can be classified into distinct morphologies using IBA1 immunohistochemistry. As previously described (Bachstetter et al., 2015), the morphologies include ramified microglia, which are thought to be a healthy, or homeostatic morphology (Fig 1 A, B). In contrast, the hypertrophic microglia morphology has historically been associated with a reactive microglia response. This morphology is typically observed following acute neuronal injury and surrounding amyloid plaques (Fig 1 C, D). As previously described, dystrophic microglia morphology refers to a number of morphological changes affecting the cytoplasmic processes such as spheroidal swelling, de-ramified, beaded, discontinuous, or tortuous processes (Fig 1 E, F) (Streit et al., 2004). A trained scientist can quantify these three distinct microglia morphologies. Thus far, we have been unsuccessful in training computer algorithms, including neural network algorithms, in detecting these morphologies accurately. Therefore, we adopted a design-based stereological approach and replicated the quantification using two observers blind to the experimental conditions (R.E.H and N.G.C).
3.1.1. Age affects microglial morphology in hippocampal subregions of the human brain.
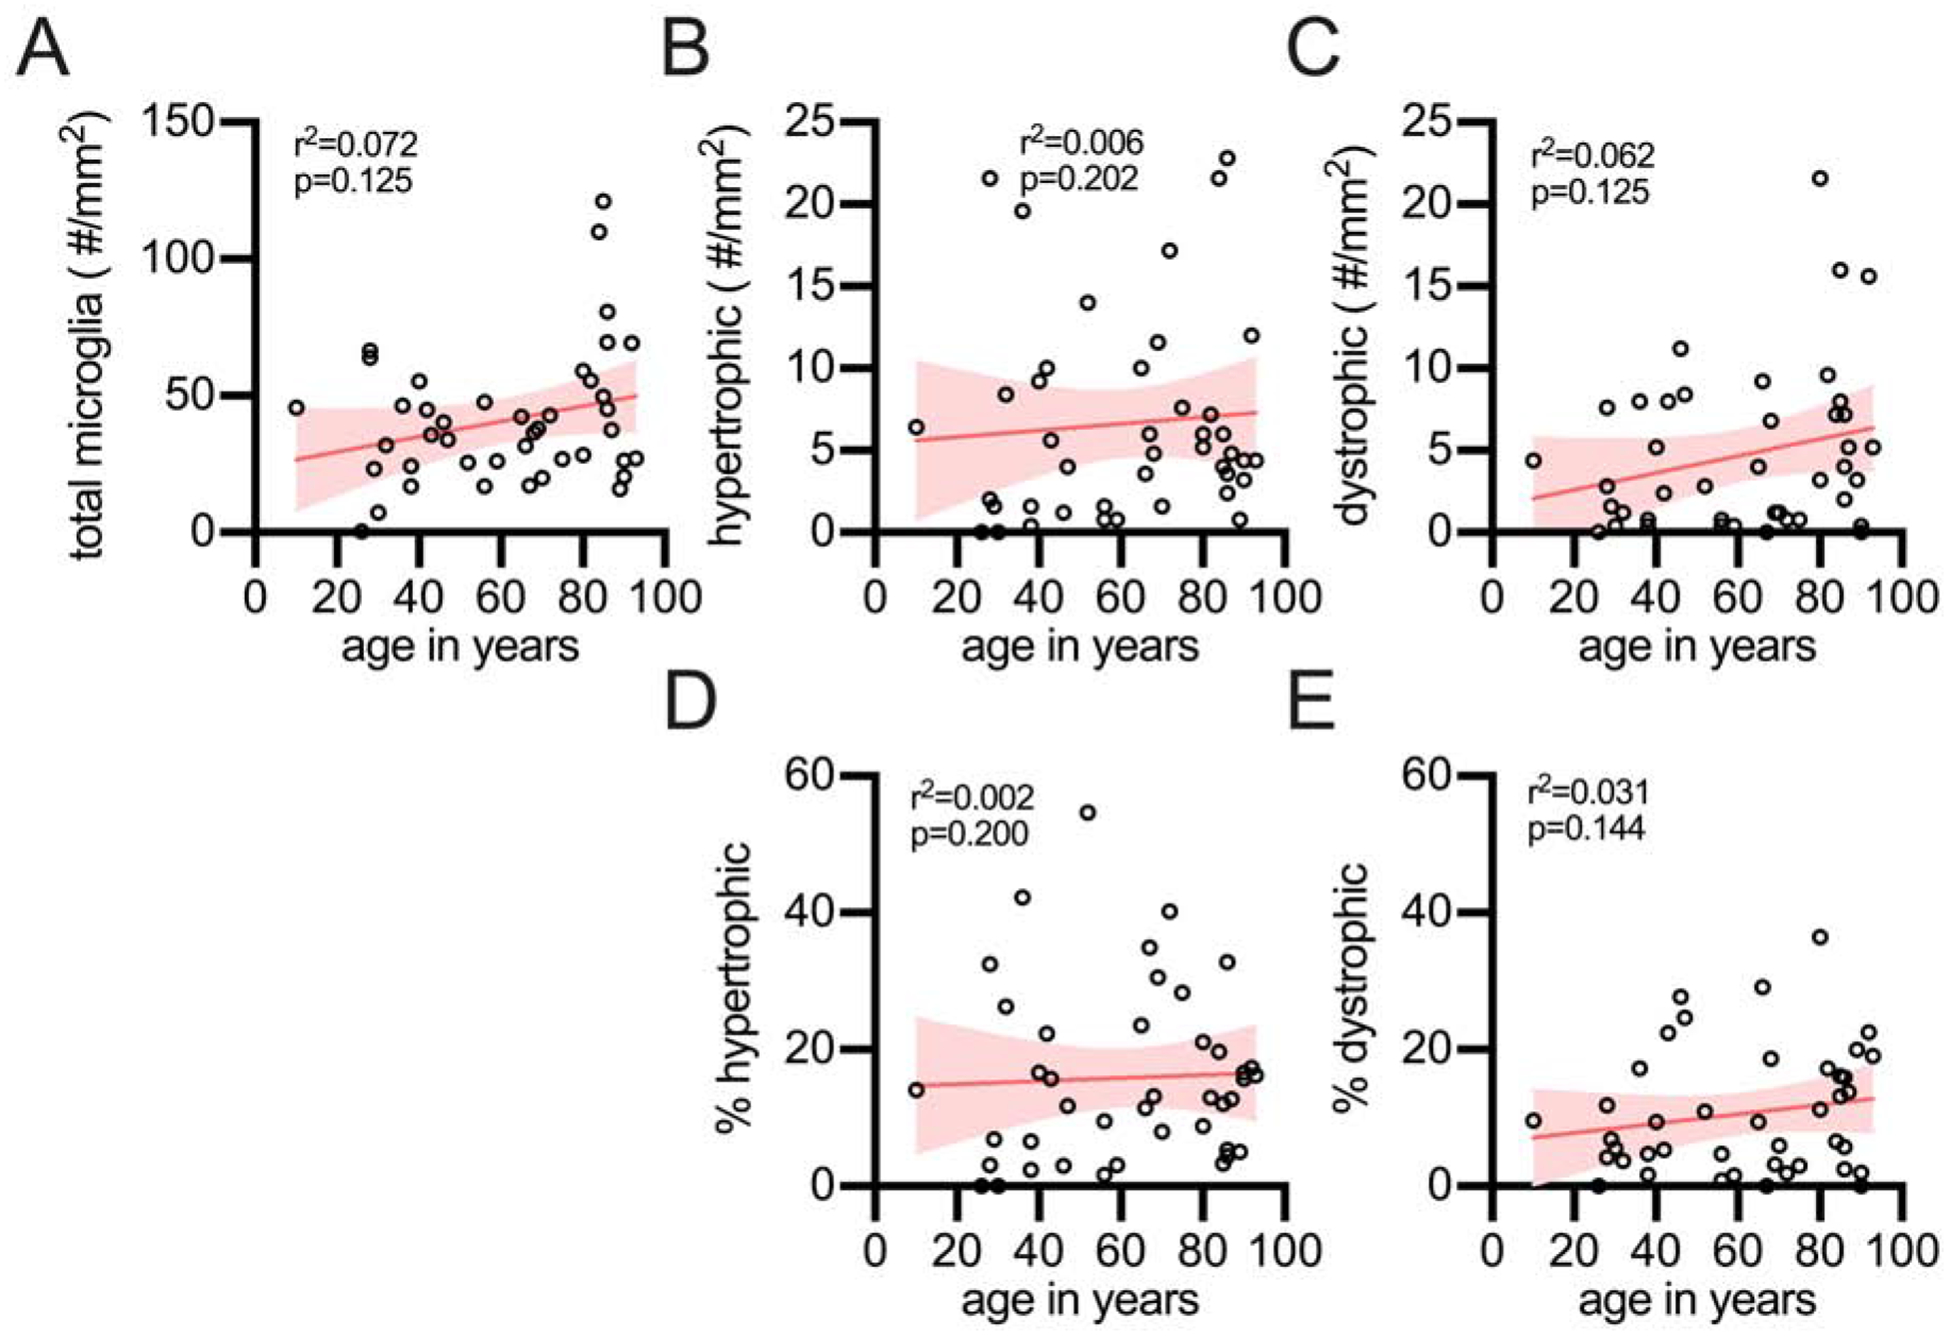
To better understand the link between dystrophic microglia and age, we began examining the CA1 region of the hippocampus. Regardless of microglia morphology, we found a strong correlation for an increase in the number of microglia with greater age (Fig 2A). Similarly, we also observed a rise in the number of hypertrophic microglia (Fig 2B) and dystrophic microglia (Fig 2C) with age. We next tested if there was a change in the proportion of microglia that were hypertrophic or dystrophic as a function of age. We found that when the hypertrophic microglia were compared as a percentage of the total microglia there was a strong positive correlation for an increased percentage of hypertrophic microglia with age (Fig 2D). We did not find evidence in support of our hypothesis that dystrophic microglia were associated with age, as there was a lack of a correlation for the percentage of dystrophic microglia to total microglia with age (Fig 2E). That is, while the total number of dystrophic microglia increases with age in the CA1 region of the hippocampus (Fig 2C), this change can be accounted for by the age-related increase in the total number of microglia (Fig 2A). The lack of an association with age and dystrophic microglia is in contrast to the hypertrophic microglia, which are increasing with age (Fig 2D).
Figure 2: Effect of age on microglial morphology in the CA1 region of the hippocampus.
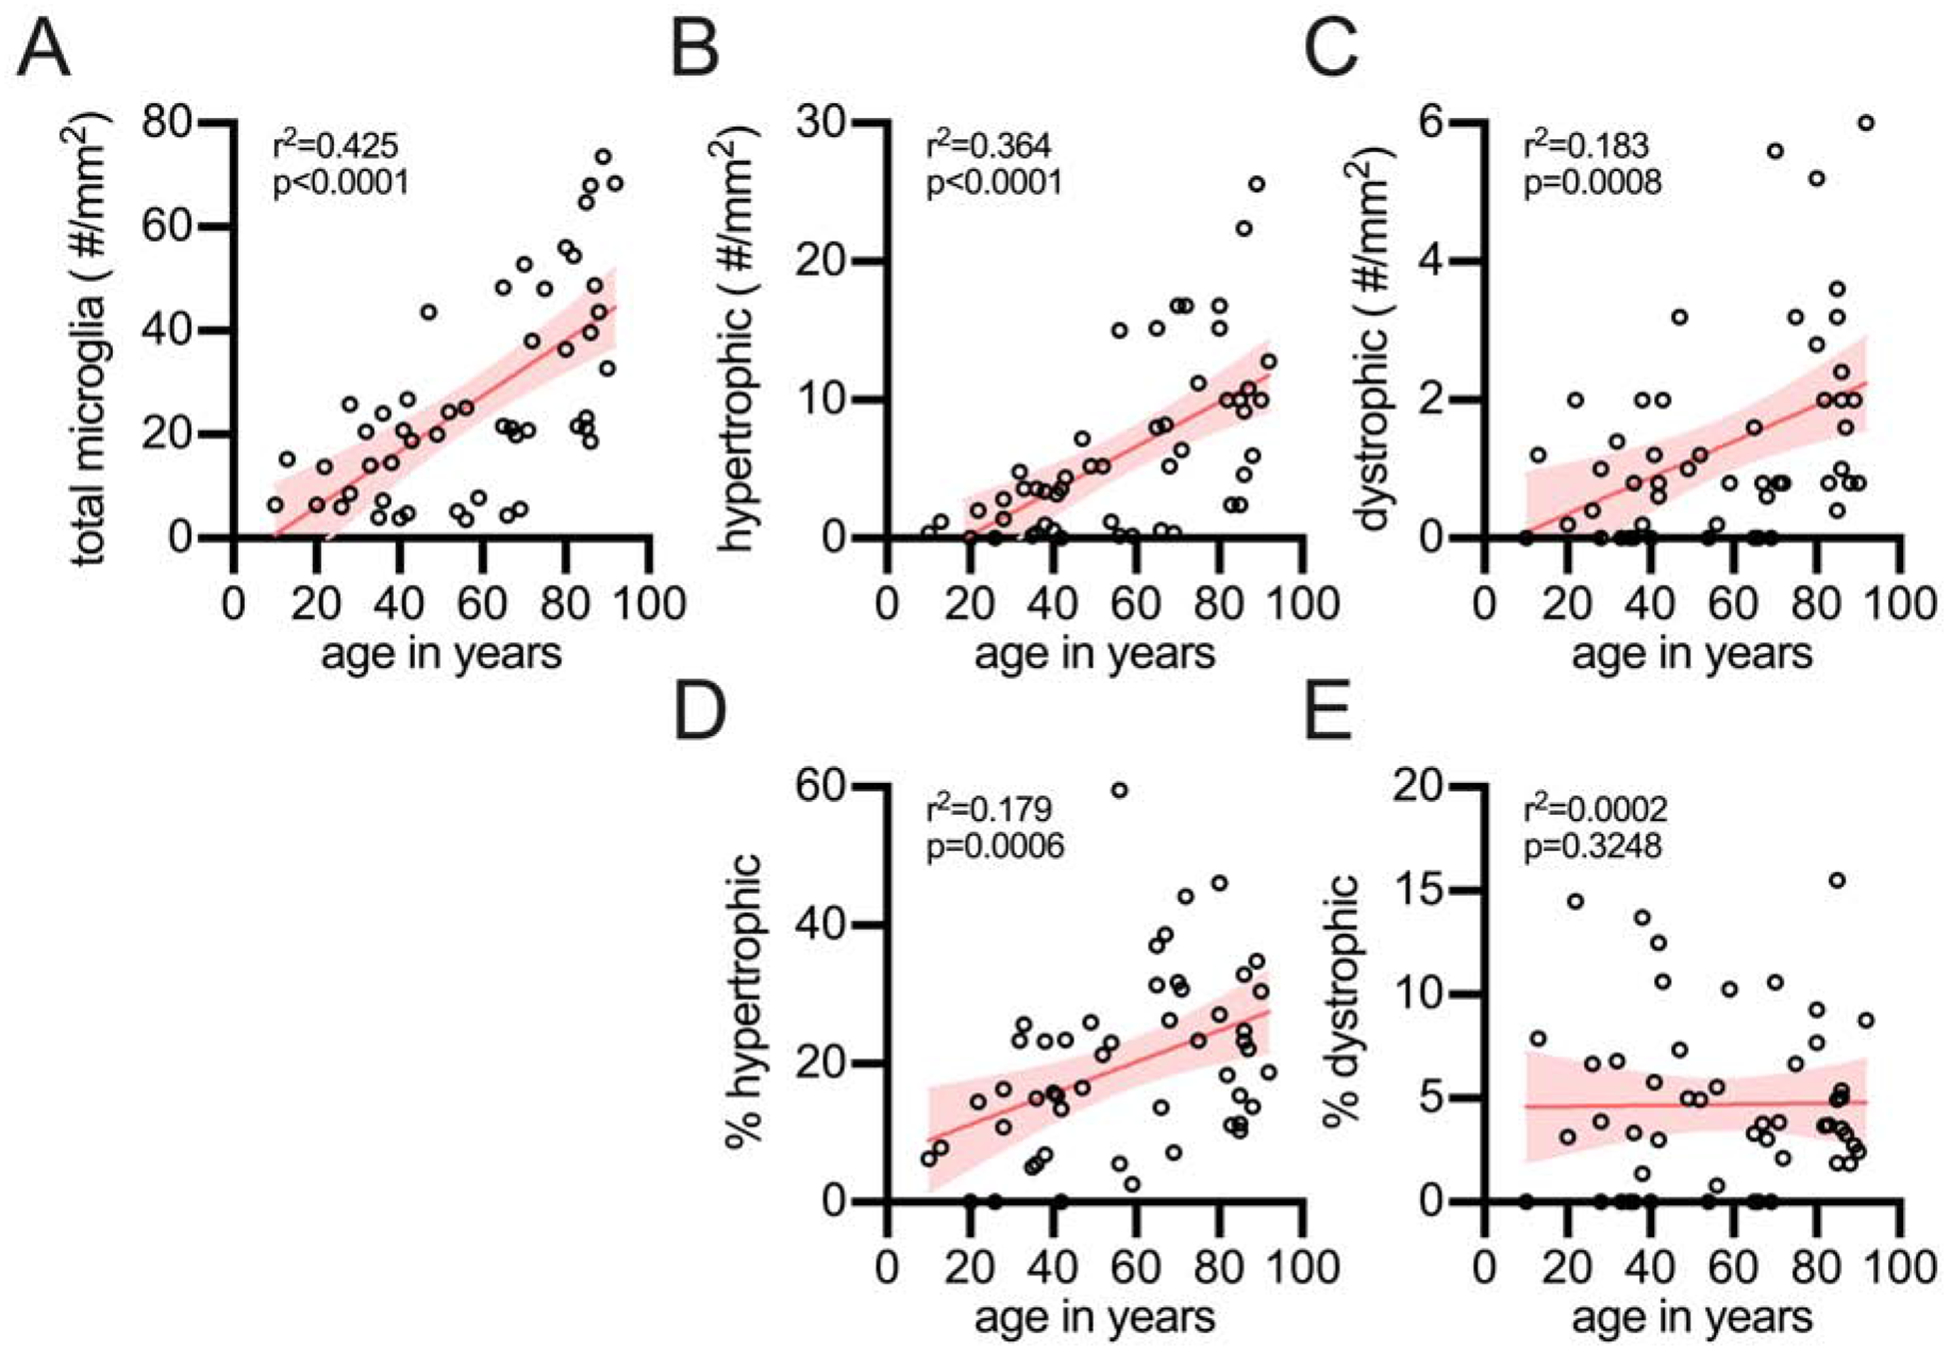
(A) The total number of microglia, regardless of morphology, were found to increase with age in the hippocampus. The total number of hypertrophic (B), as well as dystrophic microglia (C), were also found to increase in the hippocampus with age. The percentage of the total microglia which are hypertrophic was found to increase with age (D), while the increase in percentage of microglia that were dystrophic (E) was proportional to the total number of microglia, and thus did not increase with age. Each circle is a unique person
3.1.2. Changes in microglial morphology in neocortical gray matter regions of the brain
Next, we evaluated changes in the spatial distribution of dystrophic microglia in the neocortical grey matter of the frontal cortex. Investigation of microglia in frontal lobe gray matter demonstrated several striking differences in comparison to the hippocampus. While the total number of microglia was found to increase with age (Fig 3A), there was no age-related increase in the number of hypertrophic microglia in the frontal cortex (Fig 3B). Counts of the number of dystrophic microglia were correlated with age (Fig 3C). As a proportion of the total microglia, hypertrophic microglia did not increase with age (Fig 3D), while there was an increase in the percentage of dystrophic microglia with age (Fig 3E).
Figure 3: Stereological quantification of microglia morphology in the frontal cortex gray matter as a function of age.
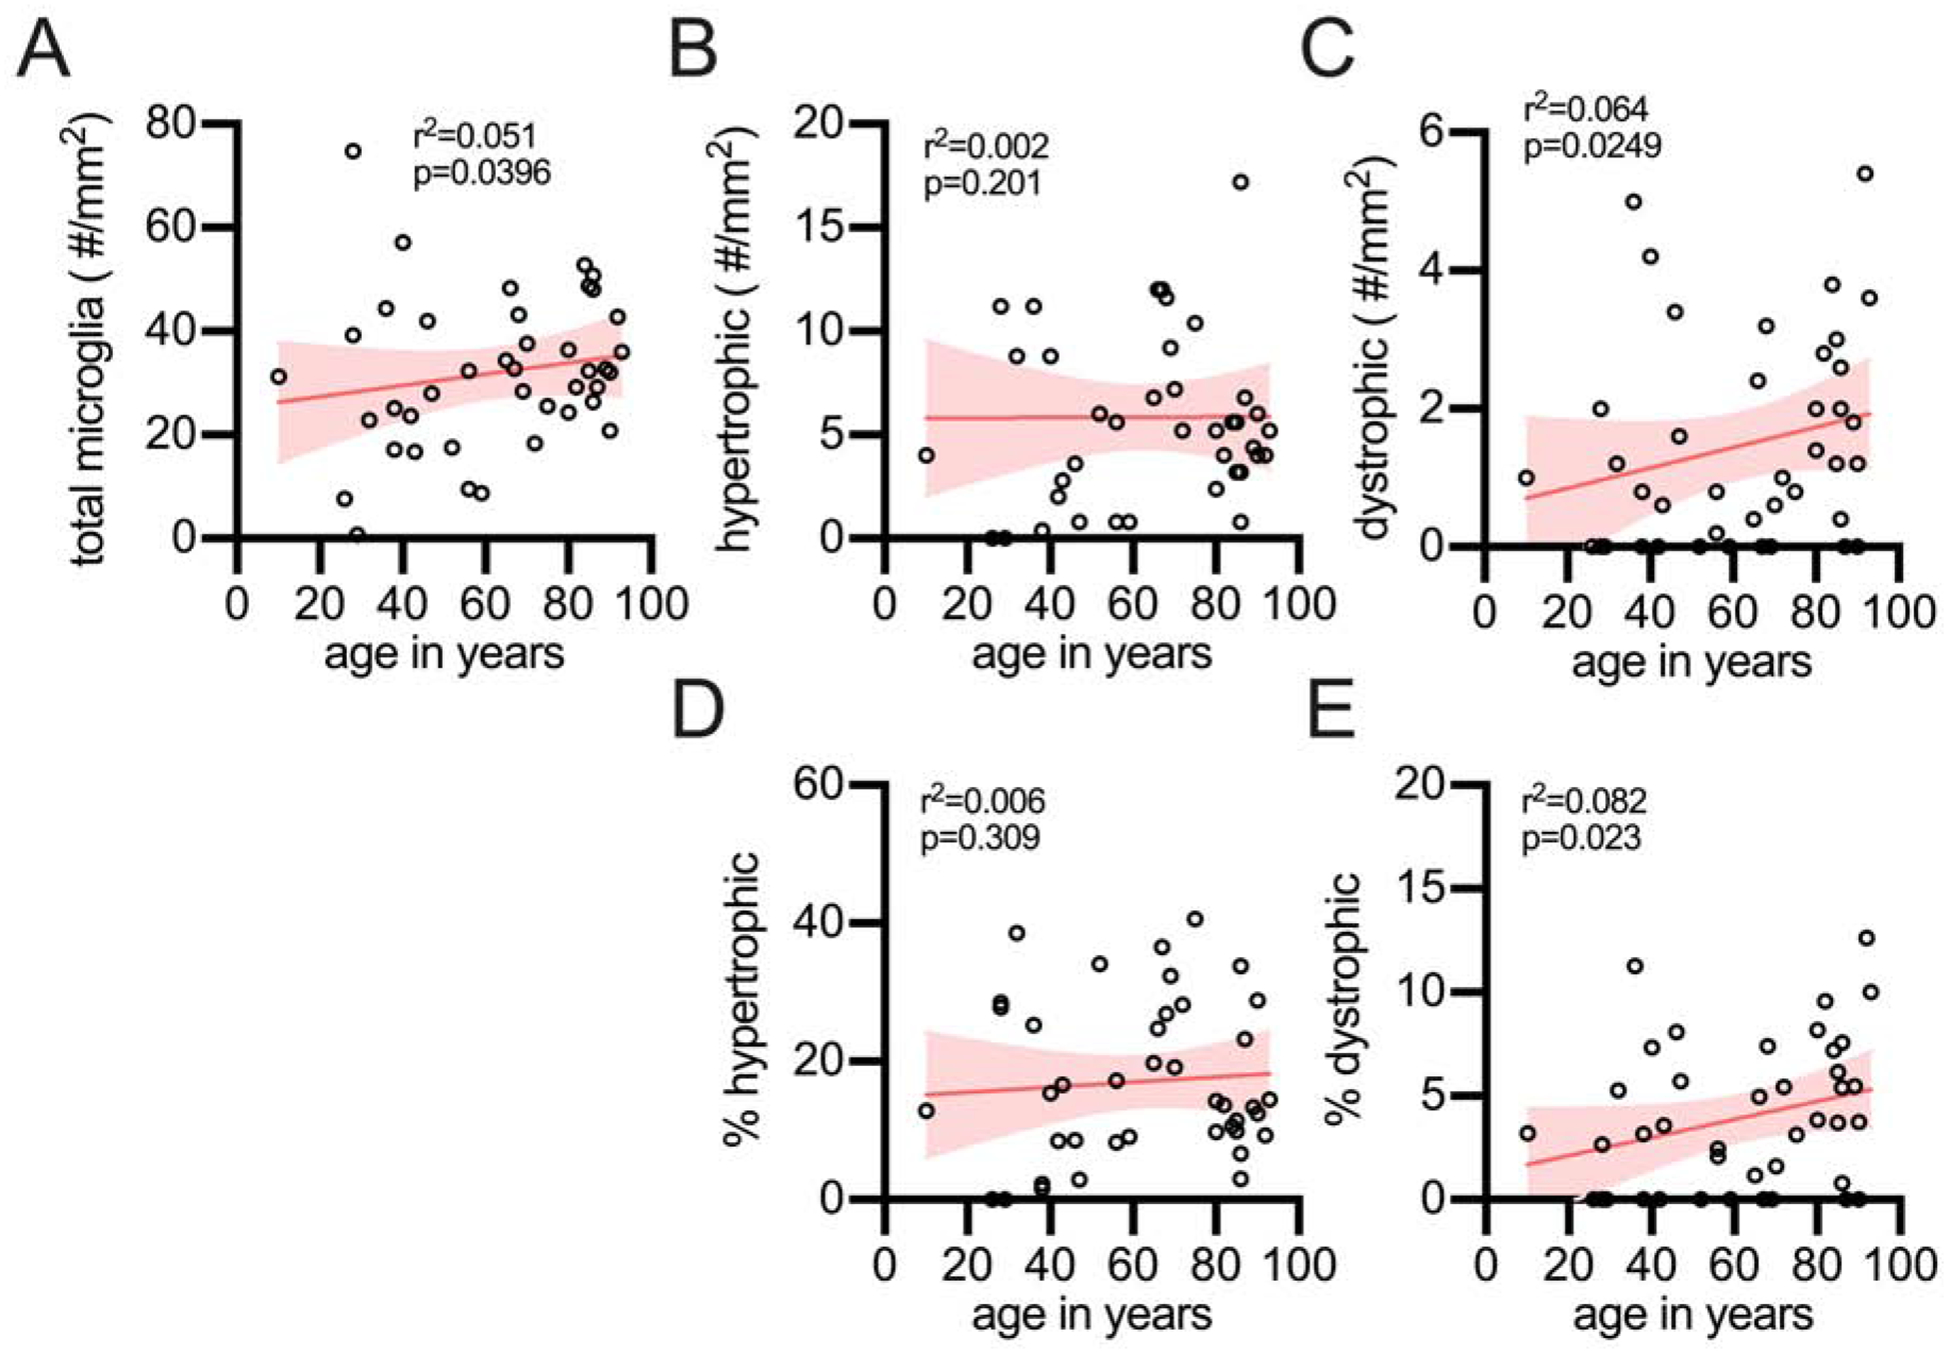
(A) The total number of microglia were found to increase with age. (B) However, hypertrophic microglia showed no age-related increase. (C) Dystrophic microglia were found to increase with age. (D) The percentage of total microglia that were hypertrophic did not increase with age; whereas, (E) dystrophic did increase with age in the frontal cortex gray matter. Each circle is a unique person.
3.1.3. Changes in microglial morphology in white matter regions of the brain
In addition to the limbic and neocortical gray matter, we also quantified microglia in the white matter of the frontal cortex. We found that the total number of microglia (Fig 4A), the number of hypertrophic microglia (Fig 4B), and the number of dystrophic microglia (Fig 4C) did not increase with age in the white matter. Also, the percentage of hypertrophic microglia (Fig 4D), or dystrophic cells (Fig 4E) were unchanged with age.
Figure 4: Effect of age on microglial morphology in the frontal cortex white matter.
The number of total microglia (A), as well as the number of hypertrophic (B) and dystrophic (C) microglia did not increase in the white matter of the frontal cortex. Similarly, there was no change in the percentage of hypertrophic (D) or dystrophic microglia (E).
3.1.4. Dystrophic microglia are a disease-associated microglia morphology.
Given that we found no evidence of dystrophic microglia increasing with age in the hippocampal CA1, we next asked if dystrophic microglia could be characteristic of a disease-associated microglia morphology. To address this hypothesis we compared changes in dystrophic microglia in the hippocampal CA1 region from people that were greater than 65+ years old without neurodegenerative pathology, to 65+ years old people with either AD-NC, LATE-NC, or LBP from a preexisting data set (Bachstetter et al., 2015) (Table 2). Our results were contrary to common assumptions. In the hippocampal CA1 region, people with neurodegenerative pathology had the same or fewer hypertrophic microglia compared to age-matched controls (Fig 5A). These results are in contrast to what was found for dystrophic microglia. In the cases with neurodegenerative pathology, on average, 45% of the microglia were found to be dystrophic. This is in comparison to the cases without neurodegenerative pathology, where on average, only 9% of the microglia were dystrophic (Fig 5B). While the range of dystrophic microglia were broad (0–100%) for the people in the neurodegenerative group level, there was no statistical difference between the different neurodegenerative disease. These results suggest that the dystrophic microglia represent a disease-associated microglia morphology.
Table 2:
Neurodegenerative series characteristics
| Experimental group | Number of cases | Sex | Age range | |
|---|---|---|---|---|
| female | male | |||
| healthy control | 34 | 16 | 13 | 65–93 |
| AD-NC | 8 | 3 | 5 | 65–85 |
| LBP | 11 | 2 | 9 | 65–97 |
| LATE-NC | 9 | 5 | 4 | 65–93 |
Figure 5: Association of dystrophic microglia with neurodegenerative disease.
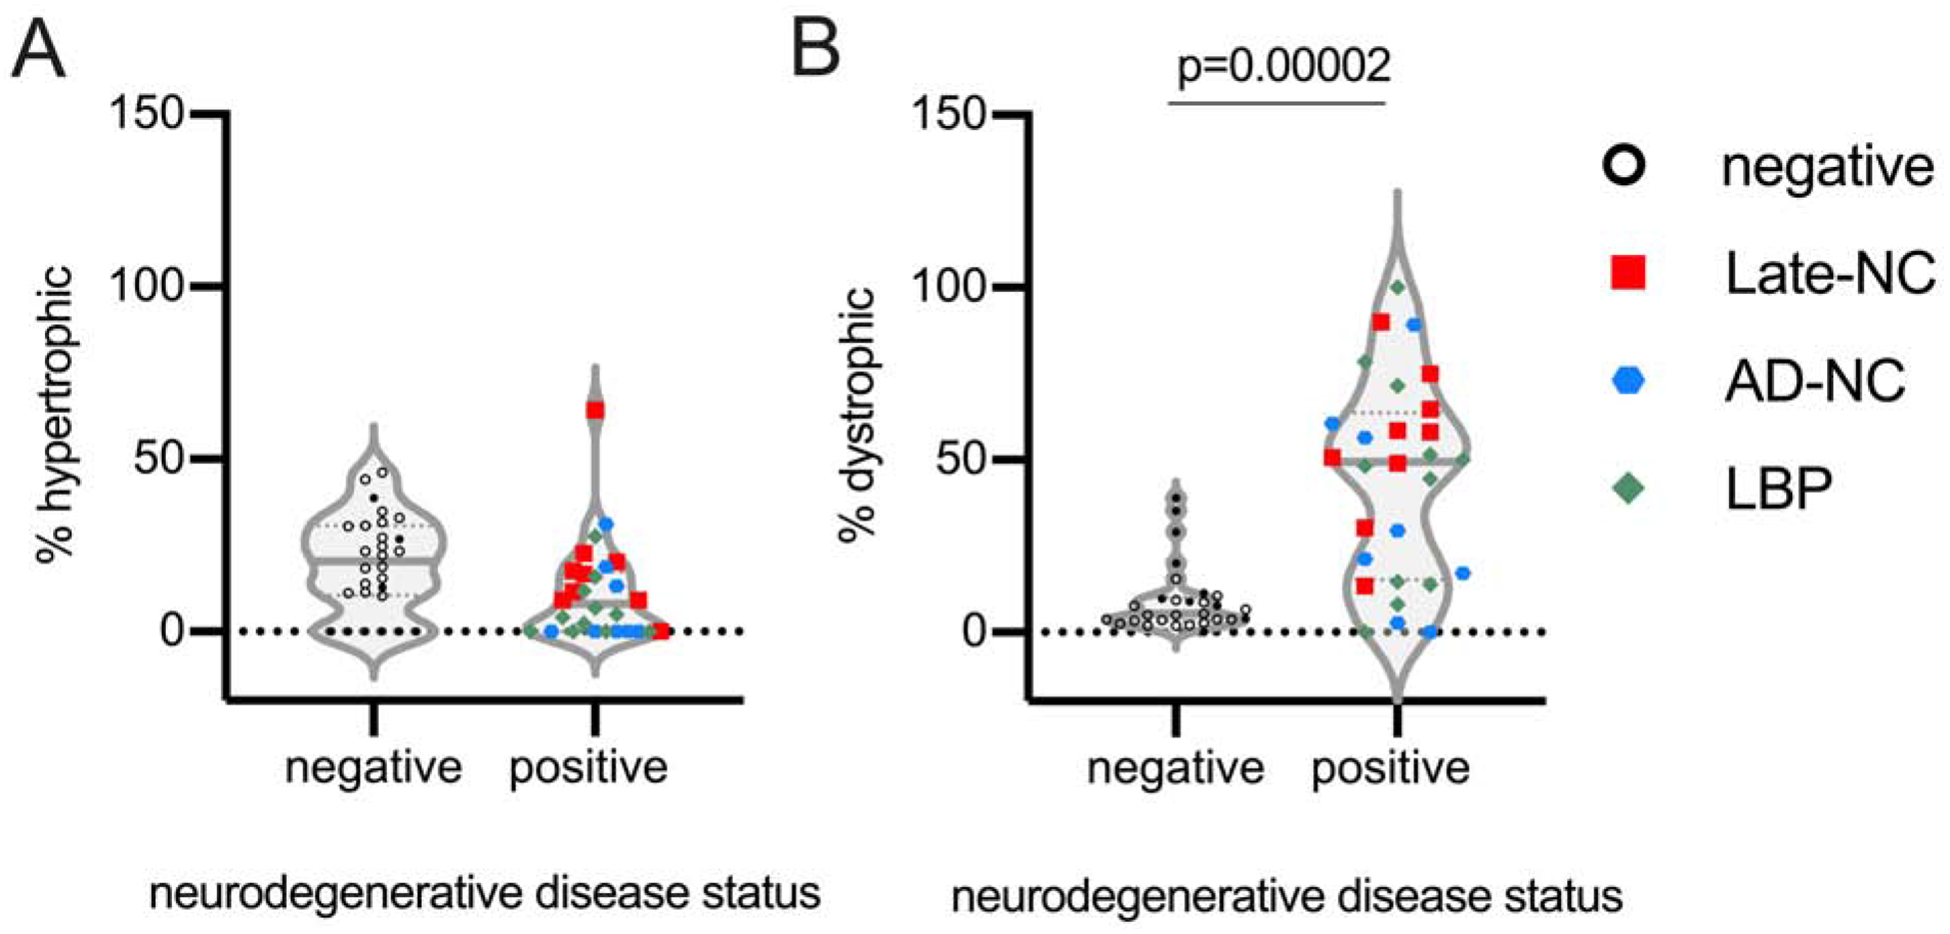
Comparing the percentage of hypertrophic and dystrophic microglia in the CA1 region in the 65+ year old cases free of advanced neurodegenerative disease pathology (negative) to those cases with advanced stage neurodegenerative disease pathology (positive) (A) showed a decrease in the number hypertrophic microglia (p=0.0998), and a (B) significant increase in dystrophic microglia (p=0.00002) in the cases with advanced stage neurodegenerative disease. Open symbols are from cases from the current study. Closed symbols are from our prior study (Bachstetter et al., 2015). Alzheimer’s disease neuropathological change (AD-NC), Lewy body pathology (LBP), LATE neuropathological change (LATE-NC).
3.1.5. Iron metabolism as a molecular mechanism for the dystrophic disease associated microglia morphology.
Single-cell and single-nuclei transcriptomic approaches have defined a gene signature in microglia associated with neurodegenerative pathology (Butovsky et al., 2014; Galatro et al., 2017; Keren-Shaul et al., 2017; Mathys et al., 2019; Orre et al., 2014). Exploring these datasets, we identified genes associated with the iron homeostasis enriched in aging and disease-associated microglia. While several gene members of the iron homeostatic pathway were differentially expressed in the aging and disease associated microglia, FTL was one of the iron pathway genes found to be increased across multiple datasets. In addition, prior studies have observed dystrophic microglia labeled by FTL (Hametner et al., 2013; Lopes et al., 2008). Therefore, we next hypothesized that dystrophic microglia in the aged brain with neurodegenerative disease pathology would be FTL positive. To test this, we used three LATE-NC cases and double labeled those cases using IBA1 and FTL (Fig 6A). Using the IBA1 channel alone, we identified 10 ramified microglia, 10 hypertrophic microglia, and 10 dystrophic microglia per case. Using HALO imaging software, we determined the area of colocalization of IBA1 and FTL for each microglia (Fig 6B). In support of our approach, we found that the intensity of the IBA1 staining in the cells classified as hypertrophic was greater than the cells classified as ramified or dystrophic microglia (Fig 6C; p<0.0001 Tukey’s test). We then asked, do the cells we defined as dystrophic have greater amounts of FTL. Comparing the area of IBA1+FTL+ colocalization, we found that the dystrophic microglia had much more FTL as a proportion of the overall cell than the ramified or hypertrophic microglia (Fig 6D p<0.0001 Tukey’s test).
Figure 6: Dystrophic microglia have a strong tendency to be double labeled for FTL in the hippocampus of aged humans with LATE-NC.
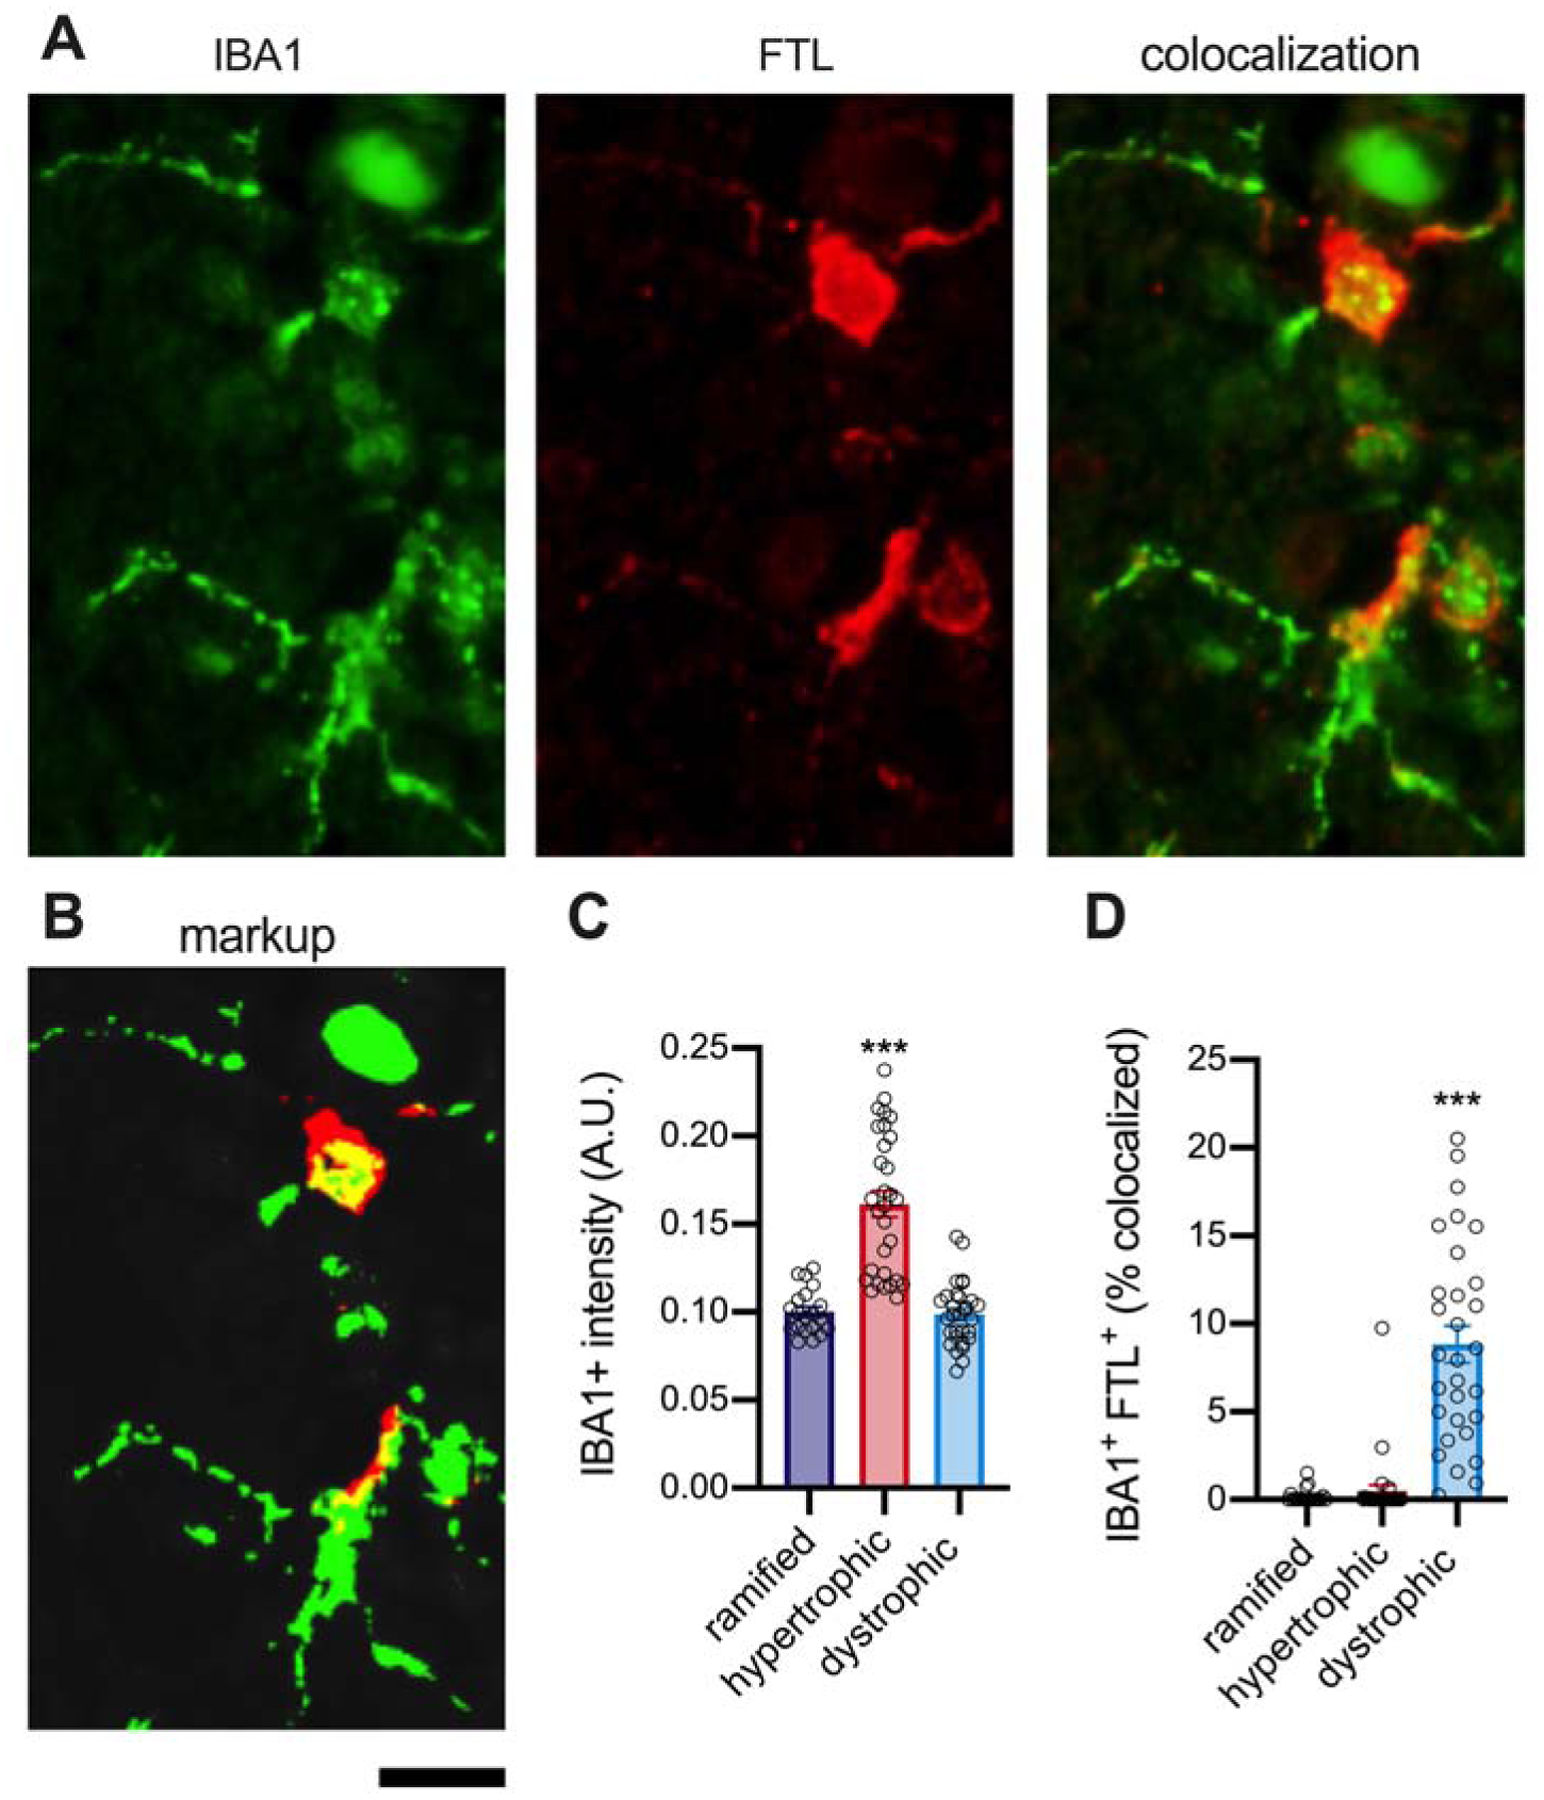
A quantitative cellular localization of FTL found colocalization FTL with microglia. FTL did not appear to be staining all microglia; therefore, we sought to see if there was any association of FTL with the different microglia morphologies we recently characterized. (A) Shows an example of the IBA1+FTL+ staining. (B) Shows the HALO generated markup, where green is IBA1, red is FTL, and yellow is the area where the two proteins are colocalized. (C) Shows that there was greater IBA1 staining intensity in the hypertrophic microglia compared to the two different morphologies for the IBA1 markup area (p<0.0001, Tukey Test). (D) A high degree of IBA1+FTL+ area of colocalization in the dystrophic microglia compared to the ramified or hypertrophic morphologies (p<0.0001, Tukey Test). Circles are individual microglia, from 3 different aged brains.) The scale bar is 20 μm.
4.1. Discussion
In the nearly two decades since dystrophic microglia were first described (Streit et al., 2004), the causes and consequences of this unique cellular morphology remains undefined (for review see: (Streit et al., 2020)). Like other types of cellular senescence that occur with age, we asked if aging was sufficient to drive microglia towards a dystrophic microglia morphology in the absence of disease. To begin to address these critical knowledge gaps, we used a series of autopsy cases covering the human lifespan to define the association of dystrophic microglia with age. We found only limited evidence that dystrophic microglia increased with age in the absence of neurodegenerative pathology. We saw in the hippocampal CA1 region a robust age-related increase in the total number of microglia, as well as the total number of hypertrophic and dystrophic microglia. However, as a percentage of the total number of microglia, only the hypertrophic microglia morphology was found to increase with age. At the same time, there was no relationship between age and the percentage of dystrophic microglia. In the gray matter of the neocortex, a modest increase in the percentage of dystrophic microglia was seen with age, suggesting a possible regional vulnerability in the presence of dystrophic microglia, which will warrant future studies. After observing a general lack of an association with age and dystrophic microglia, we next asked if dystrophic microglia are a disease associated microglia morphology. In contrast to the aged brain without neurodegenerative disease, we found strong evidence that dystrophic microglia are a disease associated microglia morphology. While there is likely more than one mechanism that push microglia into a dystrophic morphology, we identified iron metabolism as a potential molecular mechanism warranting future study.
We used a two-dimensional stereological approach to quantify the number of microglia by their morphological appearance. In the scarce tissue samples used in our study, it was not feasible to use three-dimensional stereological approaches, such as the optical fractionator, which would account for changes with tissue shrinkage caused by fixation (Gundersen et al., 1988; Sterio, 1984). There is also subjectivity associated with our methods as the observers – who were blind to the experimental groups – needed to classify a cell as hypertrophic, dystrophic, or other. We used a number of approaches to limit the subjectivity. For example, we repeated the assay using two independent scientists. We also tested intra-observer variability by having the same scientist replicate a subset of their microglia counts. Our results are comparable to those of Davies et al., which used morphometric approaches to quantify microglia arborization and microglia coverage and found a decrease in microglia complexity and area of the brain covered by microglia in the AD brain compared to the matching control brains (Davies et al., 2017). Also, an age-related decrease in the microglia markers CD68 and MHCII were seen in AD brains, while there was no change in the control cases with age (Hoozemans et al., 2011), which is in agreement with our results. While we acknowledge the limitations associated with our approach, our study provides a quantitative assessment of microglia number by morphology across the human lifespan, which has not been previously reported.
Our results that dystrophic microglia are the dominant disease-associated microglia morphology may appear counter to the current assumptions that neurodegenerative disease is associated with microglia activation. Indeed, as thoroughly reviewed by Hopperton et al., the vast majority of studies do find that microglia/macrophages are increased in AD brains compared to control (Hopperton et al., 2018). However, the likelihood that the study will report an increase in microglia/macrophages AD brains compared to control is greater when activation marker (e.g., IL-1α) or a marker of macrophages (e.g. CD163) is used (Hopperton et al., 2018). Our results are not in disagreement with these findings. We hypothesize that there may be a loss of homeostatic microglia in the neurodegenerative disease brain, with a compensatory increase in monocytes/macrophages.
We did find with age in the current study, and with neurodegenerative disease in our previous study (Bachstetter et al., 2015) the total number of IBA1+ cells in the CA1 region of the hippocampus was increased in the brain with neurodegenerative pathology compared to the control brains. The increase in total number of microglia/macrophages may be compensatory for the loss of homeostatic coverage of the brain parenchyma by microglia. Studies using depletion approaches to eliminate microglia in animal models have clearly shown that the brain will quickly repopulate microglia to maintain a tiling of microglia across the brain (Najafi et al., 2018). However, the rate of repopulation slows following multiple rounds of depletion (Najafi et al., 2018).
Comparative studies of dystrophic microglia provide important insights into the biology of this cellular morphology. In marmosets, it was found that the number of dystrophic microglia increased with age in both the limbic cortex and neocortex. However, they found this increase peaked in late middle age marmosets and declines in the oldest aged marmosets (Rodriguez-Callejas et al., 2019). These results are in contrast to our current study, where we saw the total number of dystrophic microglia increase linearly with age. In aged chimpanzees, dystrophic microglia were found primarily in the neocortical gray matter of layer II-III (Edler et al., 2018). While amyloid and tau neuropathological changes were found in a subset of the aged chimpanzees used in the study, quantification of dystrophic microglia was not completed, so it remains to be determined if there is an association between dystrophic microglia and amyloid and tau in the chimpanzees (Edler et al., 2018). In Cynomolgus macaques exposed to chronic manganese to model Parkinson’s disease-related pathology, dystrophic microglia were found to have intracellular ferric iron (Verina et al., 2011), which is in agreement with our findings that FTL is highly expressed in dystrophic microglia. Also, in tree shrews (Tupaia belangeri) dystrophic microglia have been shown to increase with age (Rodriguez-Callejas et al., 2020). Interestingly, ferritin labeled microglia was high in oxidative stress markers and had internalized hyperphosphorylated tau (Rodriguez-Callejas et al., 2020). In mice, dystrophic microglia are seldom reported; however, a recent study did find in a mouse model of P301S tauopathy, a decrease in microglia complexity in the tau mouse with age, which could be contributed to a dystrophic microglia morphology (van Olst et al., 2020).
Studies of dystrophic microglia and their role in disease are faced with several limiting factors that have slowed progress in the field. One of the most prominent limitations is the lack of distinct cell markers delineating dystrophic microglia. For this reason, future studies must attempt to find novel cellular markers of dystrophic microglia, as well as identifying specific changes in cells that contribute to disease progression. Our study was not the first to identify FTL as a marker enriched in dystrophic microglia. Previous studies have reported that microglia increase FTL in neurodegenerative disease (Hopperton et al., 2018; Streit et al., 2020). However, our work, along with Lopes et al., (Lopes et al., 2008) has demonstrated that the increase in FTL may be more than a marker of a reactive microglia morphology and could suggest a mechanism in iron dyshomeostasis that is leading to the degeneration of microglia. Single-nuclei and single-cell data sets support the hypothesis that iron pathway is differentially expressed in disease-associated microglia (Galatro et al., 2017; Keren-Shaul et al., 2017; Mathys et al., 2019; Orre et al., 2014). Our quantitative methods to measure FTL in LATE-NC cases found that a greater amount of the dystrophic microglia was labeled with FTL in comparison to hypertrophic microglia. Recent work in aged marmosets found that FTL labeled both activated and dystrophic microglia morphology (Rodriguez-Callejas et al., 2019). These findings are consistent with our work as we too can identify FTL labeled hypertrophic microglia. We propose that these hypertrophic microglia could represent a point of inflection in the course of disease pathology, when microglia lose their ability to safely maintain iron homeostasis and become dystrophic. Alternatively, we previously showed that FTL was found to be colocalized with TDP-43 and Tau inclusions bodies (Gal et al., 2018). The increase in FTL could be part of a proteinopathy – including TDP-43 and Tau – leading to the degeneration of microglia and neuronal cells. More work is needed to directly measure iron burden in FTL positive microglia from brains with and without neurodegenerative pathology. For instance, Fe(II) and Fe(III) could be measured on FACS sorted microglia from the postmortem tissue using capillary electrophoresis coupled-to-inductively-coupled plasma mass spectrometry (CE-ICP-MS)(Michalke et al., 2019).
Recent studies have shown alterations in microglial morphology in the cortical white matter of subjects with neurodegeneration related to age (Hopperton et al., 2018). However, the relation between dystrophic microglia and white matter degradation is still unknown. It has traditionally been held that morphological changes in white matter microglia is related to neuroinflammation characterized by an increased expression of MHCII and complement receptor C3bi (Hopperton et al., 2018). Conversely, more recent studies posit that the breakdown of myelin associated with age places an increased burden on white matter microglia and that observed increases may be related to cell senescence rather than inflammation (Streit et al., 2020). In our experiments, we did not find any changes in microglia morphology in the white matter of frontal cortex associated with healthy aging.
Future studies are needed to define the link between genetic predispositions and specific changes to glial microenvironment and function, to uncover the role of dystrophic microglia in other progressive neurodegenerative diseases. The presence of dystrophic microglia in diseases with varying etiology and pathology suggests that dystrophic microglia are critically involved in the shift from normal aging to disease states. Dystrophic microglia have decreased neuroprotective abilities and increased secretion of pro-inflammatory molecules (Streit et al., 2020). To date, the role that dystrophic microglia play in normal aging and neurodegeneration is still unknown. However, based on our findings, a loss of microglia function caused by dystrophy could be involved in the pathogenesis of neurodegenerative disorders.
Supplementary Material
Highlights.
Dystrophic microglia are not increased in hippocampus of healthy human aging.
Dystrophic microglia are the most common morphology in neurodegenerative disease.
Dystrophic microglia had high FTL staining, suggesting altered iron homeostasis
Acknowledgements:
We are profoundly grateful to all of the study participants who make this research possible. Research reported in this publication was supported by National Institutes of Health under award numbers P30 AG028383, R35 GM124977, R21AG066865. The content is solely the responsibility of the authors and does not represent the official views of the National Institutes of Health. The corresponding author, Adam Bachstetter, PhD, had full access to all of the data in the study and takes responsibility for the integrity of the data and the accuracy of the data analysis. Graphical abstract was created with BioRender.com
Abbreviations:
- SASP
Senescence-associated secretory phenotype
- AD
Alzheimer’s disease
- AD-NC
AD neuropathological change
- LATE
limbic-predominant age-related TDP-43 encephalopathy
- FTL
ferritin light chain
- LATE-NC
LATE neuropathological change
- DLB
dementia with Lewy bodies
- LBP
Lewy body pathology
- CE-ICP-MS
capillary electrophoresis coupled-to-inductively-coupled plasma mass spectrometry
Footnotes
Publisher's Disclaimer: This is a PDF file of an unedited manuscript that has been accepted for publication. As a service to our customers we are providing this early version of the manuscript. The manuscript will undergo copyediting, typesetting, and review of the resulting proof before it is published in its final form. Please note that during the production process errors may be discovered which could affect the content, and all legal disclaimers that apply to the journal pertain.
Data Availability Statement: The data that supports the findings of this study are available in the supplementary material of this article
Disclosure Statement: No competing interests.
Conflict of Interest: None
We confirm that data contained in the manuscript being submitted have not been previously published, have not been submitted elsewhere and will not be submitted elsewhere while under consideration at Neurobiology of Aging.
Not applicable
All authors have reviewed the manuscript and approve of its contents and validate the accuracy of the data.
References:
- Bachstetter AD, Van Eldik LJ, Schmitt FA, Neltner JH, Ighodaro ET, Webster SJ, Patel E, Abner EL, Kryscio RJ, Nelson PT, 2015. Disease-related microglia heterogeneity in the hippocampus of Alzheimer’s disease, dementia with Lewy bodies, and hippocampal sclerosis of aging. Acta Neuropathol Commun 3, 32. [DOI] [PMC free article] [PubMed] [Google Scholar]
- Bussian TJ, Aziz A, Meyer CF, Swenson BL, van Deursen JM, Baker DJ, 2018. Clearance of senescent glial cells prevents tau-dependent pathology and cognitive decline. Nature 562(7728), 578–582. [DOI] [PMC free article] [PubMed] [Google Scholar]
- Butovsky O, Jedrychowski MP, Moore CS, Cialic R, Lanser AJ, Gabriely G, Koeglsperger T, Dake B, Wu PM, Doykan CE, Fanek Z, Liu LP, Chen ZX, Rothstein JD, Ransohoffl RM, Gygi SP, Antel JP, Weiner HL, 2014. Identification of a unique TGF-beta dependent molecular and functional signature in microglia. Nat Neurosci 17(1), 131–143. [DOI] [PMC free article] [PubMed] [Google Scholar]
- Davies DS, Ma J, Jegathees T, Goldsbury C, 2017. Microglia show altered morphology and reduced arborization in human brain during aging and Alzheimer’s disease. Brain Pathol 27(6), 795–808. [DOI] [PMC free article] [PubMed] [Google Scholar]
- Edler MK, Sherwood CC, Meindl RS, Munger EL, Hopkins WD, Ely JJ, Erwin JM, Perl DP, Mufson EJ, Hof PR, Raghanti MA, 2018. Microglia changes associated to Alzheimer’s disease pathology in aged chimpanzees. J Comp Neurol 526(18), 2921–2936. [DOI] [PMC free article] [PubMed] [Google Scholar]
- Gal J, Chen J, Katsumata Y, Fardo DW, Wang WX, Artiushin S, Price D, Anderson S, Patel E, Zhu H, Nelson PT, 2018. Detergent Insoluble Proteins and Inclusion Body-Like Structures Immunoreactive for PRKDC/DNA-PK/DNA-PKcs, FTL, NNT, and AIFM1 in the Amygdala of Cognitively Impaired Elderly Persons. J Neuropathol Exp Neurol 77(1), 21–39. [DOI] [PMC free article] [PubMed] [Google Scholar]
- Galatro TF, Holtman IR, Lerario AM, Vainchtein ID, Brouwer N, Sola PR, Veras MM, Pereira TF, Leite REP, Moller T, Wes PD, Sogayar MC, Laman JD, den Dunnen W, Pasqualucci CA, Oba-Shinjo SM, Boddeke E, Marie SKN, Eggen BJL, 2017. Transcriptomic analysis of purified human cortical microglia reveals age-associated changes. Nat Neurosci 20(8), 1162.-+. [DOI] [PubMed] [Google Scholar]
- Gorgoulis V, Adams PD, Alimonti A, Bennett DC, Bischof O, Bishop C, Campisi J, Collado M, Evangelou K, Ferbeyre G, Gil J, Hara E, Krizhanovsky V, Jurk D, Maier AB, Narita M, Niedernhofer L, Passos JF, Robbins PD, Schmitt CA, Sedivy J, Vougas K, von Zglinicki T, Zhou D, Serrano M, Demaria M, 2019. Cellular Senescence: Defining a Path Forward. Cell 179(4), 813–827. [DOI] [PubMed] [Google Scholar]
- Gundersen HJ, Bendtsen TF, Korbo L, Marcussen N, Moller A, Nielsen K, Nyengaard JR, Pakkenberg B, Sorensen FB, Vesterby A, et al. , 1988. Some new, simple and efficient stereological methods and their use in pathological research and diagnosis. APMIS 96(5), 379–394. [DOI] [PubMed] [Google Scholar]
- Hametner S, Wimmer I, Haider L, Pfeifenbring S, Bruck W, Lassmann H, 2013. Iron and neurodegeneration in the multiple sclerosis brain. Ann Neurol 74(6), 848–861. [DOI] [PMC free article] [PubMed] [Google Scholar]
- Hoare M, Narita M, 2013. Transmitting senescence to the cell neighbourhood. Nat Cell Biol 15(8), 887–889. [DOI] [PubMed] [Google Scholar]
- Hoozemans JJ, Rozemuller AJ, van Haastert ES, Eikelenboom P, van Gool WA, 2011. Neuroinflammation in Alzheimer’s disease wanes with age. J Neuroinflammation 8, 171. [DOI] [PMC free article] [PubMed] [Google Scholar]
- Hopperton KE, Mohammad D, Trepanier MO, Giuliano V, Bazinet RP, 2018. Markers of microglia in post-mortem brain samples from patients with Alzheimer’s disease: a systematic review. Mol Psychiatry 23(2), 177–198. [DOI] [PMC free article] [PubMed] [Google Scholar]
- Kennedy BK, Berger SL, Brunet A, Campisi J, Cuervo AM, Epel ES, Franceschi C, Lithgow GJ, Morimoto RI, Pessin JE, Rando TA, Richardson A, Schadt EE, Wyss-Coray T, Sierra F, 2014. Geroscience: linking aging to chronic disease. Cell 159(4), 709–713. [DOI] [PMC free article] [PubMed] [Google Scholar]
- Keren-Shaul H, Spinrad A, Weiner A, Matcovitch-Natan O, Dvir-Szternfeld R, Ulland TK, David E, Baruch K, Lara-Astaiso D, Toth B, Itzkovitz S, Colonna M, Schwartz M, Amit I, 2017. A Unique Microglia Type Associated with Restricting Development of Alzheimer’s Disease. Cell 169(7), 1276–1290 e1217. [DOI] [PubMed] [Google Scholar]
- Lopes KO, Sparks DL, Streit WJ, 2008. Microglial dystrophy in the aged and Alzheimer’s disease brain is associated with ferritin immunoreactivity. Glia 56(10), 1048–1060. [DOI] [PubMed] [Google Scholar]
- Lopez-Otin C, Blasco MA, Partridge L, Serrano M, Kroemer G, 2013. The hallmarks of aging. Cell 153(6), 1194–1217. [DOI] [PMC free article] [PubMed] [Google Scholar]
- Mathys H, Davila-Velderrain J, Peng Z, Gao F, Mohammadi S, Young JZ, Menon M, He L, Abdurrob F, Jiang X, Martorell AJ, Ransohoff RM, Hafler BP, Bennett DA, Kellis M, Tsai LH, 2019. Single-cell transcriptomic analysis of Alzheimer’s disease. Nature 570(7761), 332–337. [DOI] [PMC free article] [PubMed] [Google Scholar]
- Michalke B, Willkommen D, Venkataramani V, 2019. Iron Redox Speciation Analysis Using Capillary Electrophoresis Coupled to Inductively Coupled Plasma Mass Spectrometry (CE-ICP-MS). Front Chem 7, 136. [DOI] [PMC free article] [PubMed] [Google Scholar]
- Najafi AR, Crapser J, Jiang S, Ng W, Mortazavi A, West BL, Green KN, 2018. A limited capacity for microglial repopulation in the adult brain. Glia 66(11), 2385–2396. [DOI] [PMC free article] [PubMed] [Google Scholar]
- Orre M, Kamphuis W, Osborn LM, Melief J, Kooijman L, Huitinga I, Klooster J, Bossers K, Hol EM, 2014. Acute isolation and transcriptome characterization of cortical astrocytes and microglia from young and aged mice. Neurobiol Aging 35(1), 1–14. [DOI] [PubMed] [Google Scholar]
- Ritzel RM, Doran SJ, Glaser EP, Meadows VE, Faden AI, Stoica BA, Loane DJ, 2019. Old age increases microglial senescence, exacerbates secondary neuroinflammation, and worsens neurological outcomes after acute traumatic brain injury in mice. Neurobiol Aging 77, 194–206. [DOI] [PMC free article] [PubMed] [Google Scholar]
- Rodriguez-Callejas JD, Cuervo-Zanatta D, Rosas-Arellano A, Fonta C, Fuchs E, Perez-Cruz C, 2019. Loss of ferritin-positive microglia relates to increased iron, RNA oxidation, and dystrophic microglia in the brains of aged male marmosets. Am J Primatol 81(2), e22956. [DOI] [PubMed] [Google Scholar]
- Rodriguez-Callejas JD, Fuchs E, Perez-Cruz C, 2020. Increased oxidative stress, hyperphosphorylation of tau, and dystrophic microglia in the hippocampus of aged Tupaia belangeri. Glia. [DOI] [PubMed] [Google Scholar]
- Sanchez-Mejias E, Navarro V, Jimenez S, Sanchez-Mico M, Sanchez-Varo R, Nunez-Diaz C, Trujillo-Estrada L, Davila JC, Vizuete M, Gutierrez A, Vitorica J, 2016. Soluble phospho-tau from Alzheimer’s disease hippocampus drives microglial degeneration. Acta Neuropathol 132(6), 897–916. [DOI] [PMC free article] [PubMed] [Google Scholar]
- Simmons DA, Casale M, Alcon B, Pham N, Narayan N, Lynch G, 2007. Ferritin accumulation in dystrophic microglia is an early event in the development of Huntington’s disease. Glia 55(10), 1074–1084. [DOI] [PubMed] [Google Scholar]
- Sterio DC, 1984. The unbiased estimation of number and sizes of arbitrary particles using the disector. J Microsc 134(Pt 2), 127–136. [DOI] [PubMed] [Google Scholar]
- Streit WJ, Braak H, Xue QS, Bechmann I, 2009. Dystrophic (senescent) rather than activated microglial cells are associated with tau pathology and likely precede neurodegeneration in Alzheimer’s disease. Acta Neuropathol 118(4), 475–485. [DOI] [PMC free article] [PubMed] [Google Scholar]
- Streit WJ, Khoshbouei H, Bechmann I, 2020. Dystrophic microglia in late-onset Alzheimer’s disease. Glia 68(4), 845–854. [DOI] [PubMed] [Google Scholar]
- Streit WJ, Sammons NW, Kuhns AJ, Sparks DL, 2004. Dystrophic microglia in the aging human brain. Glia 45(2), 208–212. [DOI] [PubMed] [Google Scholar]
- Streit WJ, Xue QS, 2016. Microglia in dementia with Lewy bodies. Brain Behav Immun 55, 191–201. [DOI] [PubMed] [Google Scholar]
- Tischer J, Krueger M, Mueller W, Staszewski O, Prinz M, Streit WJ, Bechmann I, 2016. Inhomogeneous distribution of Iba-1 characterizes microglial pathology in Alzheimer’s disease. Glia 64(9), 1562–1572. [DOI] [PubMed] [Google Scholar]
- van Olst L, Verhaege D, Franssen M, Kamermans A, Roucourt B, Carmans S, Ytebrouck E, van der Pol SMA, Wever D, Popovic M, Vandenbroucke RE, Sobrino T, Schouten M, de Vries HE, 2020. Microglial activation arises after aggregation of phosphorylated-tau in a neuron-specific P301S tauopathy mouse model. Neurobiol Aging 89, 89–98. [DOI] [PubMed] [Google Scholar]
- Verina T, Kiihl SF, Schneider JS, Guilarte TR, 2011. Manganese exposure induces microglia activation and dystrophy in the substantia nigra of non-human primates. Neurotoxicology 32(2), 215–226. [DOI] [PMC free article] [PubMed] [Google Scholar]
- Xue QS, Streit WJ, 2011. Microglial pathology in Down syndrome. Acta Neuropathol 122(4), 455–466. [DOI] [PubMed] [Google Scholar]
Associated Data
This section collects any data citations, data availability statements, or supplementary materials included in this article.


