

Abstract
BACKGROUND
Historical change in the availability of kin beyond the household has long interested scholars, but there has been little comparable evidence on long-run change. While generally accepted that individuals lived near kin historically, no systematic measures have been available to assess historical kin propinquity at the national level.
METHODS
With the release of historical complete count United States census data from the Integrated Public Use Microdata Series (IPUMS), a robust estimate of patrilineal kin propinquity for the United States nationally from 1790 to 1940 is calculated. Defined as the probability of non-random isonymy within an enumeration district, the estimate of patrilineal kin propinquity relies on the sequential ordering of households in the census.
RESULTS
The United States experienced a long-run decline in patrilineal kin propinquity from nearly 50% of households in 1790 to 17% of households in 1940. The age patterns of kin propinquity show substantial variation across the life course, and regional differences demonstrate the impact of economic and demographic conditions. The decline in kin propinquity reflected urbanization and the decline of agriculture, declining kin availability, growing distance between potential kin links, and a change in preferences of living near kin.
CONTRIBUTION
This is the first study to produce a systematic estimate of patrilineal kin propinquity at the national level for the United States between 1790 and 1940. Researchers can use this meaningful measure of patrilineal kin propinquity to better explain its relationships with other demographic behaviors and outcomes such as fertility, mortality, and migration choices.
1. Introduction
Historians have established that families often settled near other kin in the long 19th century (Gjerde 1985; McQuillan 1990; Ostergren 1998; Wall 2010). Furthermore, nationally representative survey results in the mid-20th century found around 40% of elderly persons lived 10 minutes or less from children (Crimmins and Ingegneri 1990; Leigh 1982; Lin and Rogerson 1995; Shanas 1961, 1967, 1973; Wolf 1994). However, it is unknown precisely how many individuals lived near kin at a national scale in the 19th and early 20th centuries other than an estimate of next-door kin for 1790 and 1900 (Smith 1989). With the emergence of new complete count census data from the Integrated Public Use Microdata Series (IPUMS), we can measure potential patrilineal kin propinquity for the United States over 150 years.
I define kin propinquity as the probability of non-random isonymic (same surname) families living within the same census enumeration district. By this measure, the United States experienced a long-run decline in patrilineal kin propinquity between 1790 and 1940. Young children, young adults, and especially the elderly experienced the highest kin propinquity rates, suggesting a family life cycle pattern to kin propinquity. Given the potential relationship between kin propinquity and other demographic behavior and outcomes such as fertility, mortality, and migration patterns, describing the long-run trend of kin propinquity can contextualize behavior of families that cannot be measured with within-household measures.
2. Literature review
Kinship consists of socially significant ties between individuals, which can be fictive or familial kinship. Familial kinship can be further divided between consanguineous kinship (blood ties) and affinal kinship (in-laws). For consanguineous kin, the household of procreation represents the parental household and the household of orientation represents an individual’s nuclear family (spouse and children). Parents, siblings, grandparents, and other kin can live in the household of orientation of the individual ego or in their own household of orientation (Bras and Tilburg 2007; Litwak 1965; Parsons 1943; Wetherell, Plakans, and Welman 1994). Kinship is also defined by the importance and frequency of kin interaction. Second cousins who see one another once every five years would be an example of familiar kin. Alternatively, effective kin have increased interaction with one another, and ties tend to be more socially significant, such as a parent, sibling, spouse, or child. While geographic proximity is not the primary determinant of effective kin, propinquitous kinship can be an indicator of effective kinship, especially in the case of next-door propinquity (Billingsley 2004; Leigh 1982). Kin propinquity, or kin proximity in the previous literature, is generally defined as kin who live near one another, though the distance defined as propinquitous varies across studies.
Using a sample of the 1790 Census and a sample of elderly persons from the 1900 Census, Smith (1989) argues that kin propinquity (same surnames within five households) declined from approximately 29% of all household heads in 1790 to approximately 14% of elderly persons by 1900. Using two different demographic groups – households heads and elderly persons – makes it difficult to assess change over time, but Smith argues declining kin propinquity was associated with declining fertility, increased population density, lower male to female sex ratios, and a change in the preferences of living near kin. New England in particular experienced the largest decline, which had the highest rates of kin propinquity in 1790, but some of the lowest rates by 1900. Smith calculates surnames randomly appearing within five households to the same surname by state was less than 4%, arguing that the distribution of surnames does not explain the decline of kin propinquity (Preston 1976; Smith 1979, 1989).
Given the length of time to travel between places prior to the automobile and extensive infrastructure investments in roads, railroads, and canals, kin propinquity would be even more important for effective kin in 1790 than today. Studies of Connecticut, Arkansas, North Carolina, and Wisconsin in the 19th century show most effective kinship was based on intergenerational relationships. Further, when local land availability became limited, in some cases families migrated to frontier areas and settled together. This family migratory process strengthened families’ economic and political positions, especially in frontier areas with few institutions and opportunities to amass economic and political power (Billingsley 2004; Curti 1959; Ditz 1986; Gjerde 1985; Kenzer 1987).
Smith’s estimate of kin propinquity is conservative, as it does not capture matrilineal kin due to marriages and used a small distance threshold. This suggests that at least in terms of proximity, kin relations were very powerful. Some historians and economists argued in favor of a ‘modern’ America in 1790 based on the accumulation of property as capital, maximizing profits and an emphasis on conjugal families established separately from the previous generation (Demos 2000; Lemon 1972; Rothenberg 1992). High kin propinquity in 1790 suggests families were more interested in establishing kin nearby rather than accumulating land, which would have been cheaper in new western lands than locally and does not support the argument of the modern family that travels to the best available economic opportunities (Gjerde 1997).
Intergenerational coresidence of the elderly and adult children coincided with kin propinquity patterns. While declining between 1850 and 1940, most elderly persons lived with an adult child during this time period, serving as a form of old age security for the elderly before social security (Cohen, Ball, and Myers 1954; Hareven 1994; Laslett 1965; Ruggles 2015). Given most heads of household tended to be elderly parents rather than the children and the title ‘head of household’ indicated the power relations within families, it suggests children were living with elderly parents rather than the other way around. Additionally, these intergenerational families were better off economically than elderly persons with no adult children in the household, suggesting intergenerational coresidence prior to 1940 was not economically need-based for most elderly persons. Inheritance practices and a lack of outside economic opportunities for younger generations contributed to high intergenerational coresidence. With the rise of industrial labor, children had better wage opportunities elsewhere and slowly abandoned the intergenerational household through and beyond World War II (Gratton and Gutmann 2010; Ruggles 2007).
Theorists from the 1930s and 1940s argued that previous emphasis of neolocal separate nuclear households falsely suggested most families were not attached to extended kin networks (Wirth 1938). Rather, they argued, extended kin connections via the family of procreation, the family of orientation, and affinal families was higher than previously thought. These modified kin networks persisted through the 1950s and were not antithetical towards urbanization, geographic mobility, and occupational mobility (Litwak 1960; Parsons 1943). Survey evidence from Cleveland in 1956 suggests kin aided and were in contact with each other regularly, regardless of propinquity distance (undefined by the author). Most families received aid from related kin (help during illness, financial aid, care of children, personal advice, business advice, and valuable gifts), most aid was reciprocal between generations, and most intergenerational assistance went from older generations to younger generations. The data show 54% of individuals from the survey lived near kin, but this estimate is unreliable because of the small sample size, the specific community under study, and not using a formal distance metric to define kin propinquity. In a similar study of Hough, Ohio, 78% of the sample (N = 401) had kin living in the Cleveland metropolitan area, and 49% of individuals had kin living within the city of Hough. These surveys were not nationally representative, which limits how we can interpret these surveys beyond their respective urban populations and time frame (Sussman 1953, 1959, 1965).
The National Surveys of the Aged in 1962 and 1975, the National Health Interview Supplement on Aging in 1984, and the 1987 National Survey of Families and Households suggest a kin propinquity rate of around 40% for elderly persons with little to no change during this time period (Crimmins and Ingegneri 1990; Lin and Rogerson 1995; Shanas 1961, 1967, 1973; Wolf 1994). The units of propinquity vary by distance in miles and time of travel in minutes, but the surveys primarily used measures of one mile and less than ten minutes. In the Panel Study of Income Dynamics 32% of the observed person periods lived within one mile of nuclear or extended kin between 1980 and 2013 (Hofferth and Iceland 1998; Spring et al. 2017).
Families strategically utilized kinship for property devolution, marital alliances, hierarchical enforcement of social mores, and reciprocal labor (Nelson 2019). Regarding inheritance, children settling new families nearby exhibited inheritance practices focused less on intergenerational accumulation and more on establishing as many surviving children and their families as possible within the community. Historically, this common form of inheritance was practiced in New England and among ‘German’ families in the Midwest (Ditz 1986; Gjerde 1997). Inheritance represents the power structure between generations, and measures of propinquitous kin can provide insight into intergenerational relations during a period of significant changes for generational negotiation (Pitts 2013). While surveys and community studies provide in-depth analyses of kinship and how families used kinship toward different social, economic, and political goals, these approaches cannot provide consistent representative information on long-run trends in kin propinquity. With the advent of complete-count census data, basic measures of kin propinquity on a national scale are now feasible.
3. Data and methods
The release of IPUMS census microdata samples in 1993 allowed consistent long-run analysis of national changes in family and household composition (Ruggles 1994). While IPUMS provides a powerful source to analyze population dynamics at the national level since 1850, the sample design made it difficult to study kinship beyond the household. IPUMS produced the first complete count census dataset with the 1880 Census in 2003. Since 2014, IPUMS has released complete count data for most census years from 1790 to 1940 except for the 1890 Census, which was destroyed in a fire (Blake 1996). Enumerators ordinarily went door to door to collect information, so most individuals and households were enumerated sequentially, allowing for comparison of surnames. The restricted version of the complete count census database includes full information on names, allowing simple measures of kin propinquity based on an egocentric isonymic matching approach (Minnesota Population Center and Ancestry.com 2013; Ruggles et al. 2020). This approach is similar to propinquity methods used to measure kinship (Smith 1989) and segregation (Grigoryeva and Ruef 2015; Logan and Parman 2017). Due to changing surnames after marriage for women, we can only capture patrilineal links for ever-married women, and kin propinquity links are significantly understated for women (Ruggles 2016). GIS boundary files come from IPUMS-NHGIS (Manson et al. 2019).
Sequential household analysis is limited to those who reside in the same enumeration district. Because enumerators went from house to house, proximity on the enumeration form correlates with geographic proximity, but the association is imperfect. Enumerator paths were not consistent within census years, nor consistent across decades (Kenzer 1987; Owsley 1949). Because of this, neighbors in one census may not be neighbors in the next. Some analysts use plat maps or property records to identify exact spatial location in historical communities, but the necessary sources are only sporadically available before the late 19th century (Clarke 1991; Logan et al. 2011).
This kin propinquity method identifies the closest isonymic match of the same race, accounting for the likelihood that the surname match occurred by chance and does not reflect kinship.2 Equation (1) describes the probability of non-random isonymy (P(Krsi)) assuming a random sorting of surnames within an enumeration district
| (1) |
where Frsi is the number of households of the same race (r) in the district (s) that share the same surname (i), Trs is the total number of households of the same race in the district, and Di is the number of non-isonymic households that are as close as the nearest isonymic household. This measure is based on the calculation of the probability of common surnames randomly appearing from Smith (1989). The measure from Equation 1 differs from Smith in three ways. First, Equation 1 calculates the probability of the same surname non-randomly occurring, whereas Smith was interested in the probability of surnames randomly occurring. This is because Smith measured this probability for aggregated data at the state and national levels while Equation 1 is applied to each household at the enumeration district level. Finally, because Frsi and Trs include the ego’s household of orientation, that family must be subtracted from Frsi and Trs, something Smith does not do because he does not apply his measure to households.
Consider the example in Table 1. The first household head is named Nelson, and there is a matching Nelson household of the same race listed three households away. Di is ordinarily the distance between isonymic households multiplied by 2, since a surname match looks in both directions from the household. However, households toward the beginning or end of an enumeration district will have fewer households to search (e.g., the first household in an enumeration district is only looking below it, not above it). In this example, the first Nelson listed is the first case in the enumeration district, so the household distance for household 1 is only 3 compared to the six households searched for the Nelson household in household 4. For the Smith family in household 3, the close Smith family match is in household 7 because they also need to share the same race. This kin propinquity measure only captures a subset of kin relations. Parents-in-law, married daughters or sisters, and other kin affected by women changing surnames upon marriage are systematically excluded. Accordingly, this analysis focuses on patrilineal kinship, and the trends and differentials may differ for kin types that are excluded.
Table 1:
Example kin propinquity calculation for first 7 households of an enumeration district of 500 households
| SERIAL | Surname (F) | Race (r) | Distance | Di | Frsi | Trs | P(Krsi) |
|---|---|---|---|---|---|---|---|
| 1 | NELSON | White | 3 | 3 | 4 | 479 | 98.1% |
| 2 | ANDERSON | White | - | - | 1 | 479 | - |
| 3 | SMITH | Black | 4 | 6 | 3 | 21 | 53.1% |
| 4 | NELSON | White | 3 | 6 | 4 | 479 | 96.3% |
| 5 | YOUNG | White | 25 | 50 | 6 | 479 | 59.1% |
| 6 | SMITH | White | 11 | 22 | 17 | 479 | 47.3% |
| 7 | SMITH | Black | 4 | 8 | 3 | 21 | 43.0% |
The probability of non-random isonymy acts as a proxy measure for kin propinquity, and the two terms will be used interchangeably for the rest of the article. For example, the result from Table 1 for the first Nelson household can be interpreted as a 98.1% chance the Nelson family in the first household non-randomly lived near the closest Nelson family in the same enumeration district, or a 98.1% chance the Nelson family in the first household had potential patrilineal kin living within the same enumeration district. There is no formal limitation on the number of households between same surname families as in Smith (1989), except that the match must occur within the same enumeration district/area to maintain the assumption of sequential ordering of households. This method is applied to all years (1790–1940) and referred to as the household method. The individual method for 1850–1940 uses this same method but applies to reference persons of families rather than heads of household.3 Results in 1790–1940 use the household method, and tables and figures that consist of only 1850– 1940 results use the individual method unless labeled. Results referring to households or heads use the household method while results referring to individuals or reference persons indicate the individual method.
Calculating the average and median distance between same surname households and weighting by the probability of non-random isonymy for heads of household, Figure 1 summarizes the average and median distance between isonymic matches from 1790 to 1940.4 In 1790, 50% of households that lived near a same surname family lived within three households. The median distance between same surname households increased steadily from three households in 1790 to seven households in 1940. The distances in 1790–1840 may be biased downwards due to missing data and enumerators who alphabetized the enumeration area, which cannot be analyzed for kin propinquity. Average distances between same surname families declined in 1880, the first census to institute the enumeration district concept. Figure 1 median results reinforce that most of the matches occurred in small distances, while the average results show the effect of outliers on distance between isonymic matches.
Figure 1:

Median and average distance between isonymic households, 1790–1940
Measurement of kin propinquity is complicated by the changing distribution of surnames. For example, higher immigration increased surname diversity, which could lead to lower kin propinquity. The kin propinquity measures proposed above are independent of surname diversity. For example, the kin propinquity probability of the Nelson family does not depend on whether there are 100 unique surnames or 490 unique surnames in the enumeration district. Regardless of the number of unique surnames, the probability measure comes out the same.
Table 2 provides additional evidence that surname diversity does not affect the kin propinquity calculations overall. The C-Mean, or the number of same surname families an average family had in a particular enumeration district based on Smith (1989) and the percentage of persons with the most common surname within an enumeration district both show low correlation with the percentage of individuals living near kin within an enumeration district, with a moderate correlation in a couple of census years. Finally, there is a small negative correlation between the surname distribution (Frsi/Trs from Equation 1) and the probability of kin propinquity (P(Krsi)). Surname diversity does not affect the kin propinquity calculations.
Table 2:
Correlation coefficients between surname diversity and kin propinquity measures, 1850–1940
| ED C-Mean1 | ED % Most Common Surname1 | Individual Frsi/Trs2 | |
|---|---|---|---|
| 1850 | 0.234 | −0.245 | −0.123 |
| 1860 | 0.008 | −0.184 | −0.120 |
| 1870 | 0.205 | −0.072 | −0.147 |
| 1880 | 0.151 | 0.232 | −0.181 |
| 1900 | 0.034 | 0.276 | −0.185 |
| 1910 | 0.252 | 0.340 | −0.204 |
| 1920 | 0.328 | 0.312 | −0.198 |
| 1930 | 0.400 | 0.104 | −0.183 |
| 1940 | 0.374 | 0.157 | −0.139 |
Compared to the percentage of persons within enumeration district (ED) with nearby potential kin
Compared to the probability of nearby potential kin (P(Krsi)) for each individual
4. Results
Figure 2 presents the estimated national kin propinquity rates for heads of household (1790–1940) and individuals (1850–1940). The method for heads is based on same surname propinquity of household heads, but beginning in 1850 we also have information of the surnames of individuals within households. Since households often include multiple surnames, the availability of individual-level name information provides additional opportunities to identify nearby kin. The analyses exclude persons in group quarters such as rooming houses, correctional institutions, and schools. The pre-1850 censuses also required significant data cleaning to account for irregularities in data quality (Nelson 2018). The national rates are calculated by weighting the results by the estimated probability of non-random isonymy. For example, if 10 million persons lived in the United States, and 5 million persons each had a 99% chance of non-random isonymy, the estimated national patrilineal kin propinquity rate would be 49.5% ([5,000,000*0.99]/10,000,000).
Figure 2:

Percentage kin propinquity by method, 1790–1940
The United States experienced a long-run decline of patrilineal kin propinquity between 1790 and 1940. As shown in Figure 2, both measures show dramatic declines in propinquitous kin. When looking at the heads of household, kin propinquity declined from 50% in 1790 to 17% in 1940. The individual results show a similar decline. This decline of kin propinquity closely mirrored other demographic patterns, including the long-run decline in intergenerational coresidence in the United States, the long-run decline in agricultural employment, and the fertility decline in the United States (Hacker 2003; Hacker and Roberts 2017; Ruggles 2007).
Persons with kin nearby exhibited a life cycle pattern, consisting of a ‘wave’ as seen in Figure 3. In all census years, kinship peaked among persons aged 0–4, 20–24, and especially 55–80. This supports a multigenerational interpretation as peaks occur at the periods of life when generational overlap was greatest. Young children had living grandparents, young adults had living parents, and the elderly had children old enough to establish independent households. Children of the current generation ages 20–34 were likely to move out of the parental household. Between ages 30–45, mortality for older generations and mobility doubtless contributed to lower kin propinquity. At ages over 45, children from the next generation moved out of the current generation’s household, continuing the family life cycle. The differential in kin propinquity between the elderly and younger generations flattened substantially over time and largely disappeared by 1940.
Figure 3:

Percentage kin propinquity by age group, 1850–1940
The differences between the ages of potential kin and the household of orientation further support the life-cycle interpretation. Figures 4 through 6 show these age differential patterns for 20–24-year-old, 40–44-year-old, and 60–64-year-old persons. The figures show the difference in age between persons in the specific age group and the age of the reference person they linked to. Ages to the right of the vertical line indicate the reference person the 20–24-year-old person linked to is older. At age 20– 24, most persons lived near potential older siblings (or same-generation kin), since the majority of the links occur with people less than 15 years older than the 20–24-year-old persons. A small spike for potential kin in the 20–40 years older group indicate likely parents (or older generation kin). Persons aged 40–44 showed a similar pattern, although the potential siblings were a combination of older and younger, and small spikes in potential children and potential parents for this age group formed. Finally, elderly persons between the ages 60 to 64 primarily linked with individuals at least 20 years younger, indicating potential children (or younger generation kin).
Figure 4:
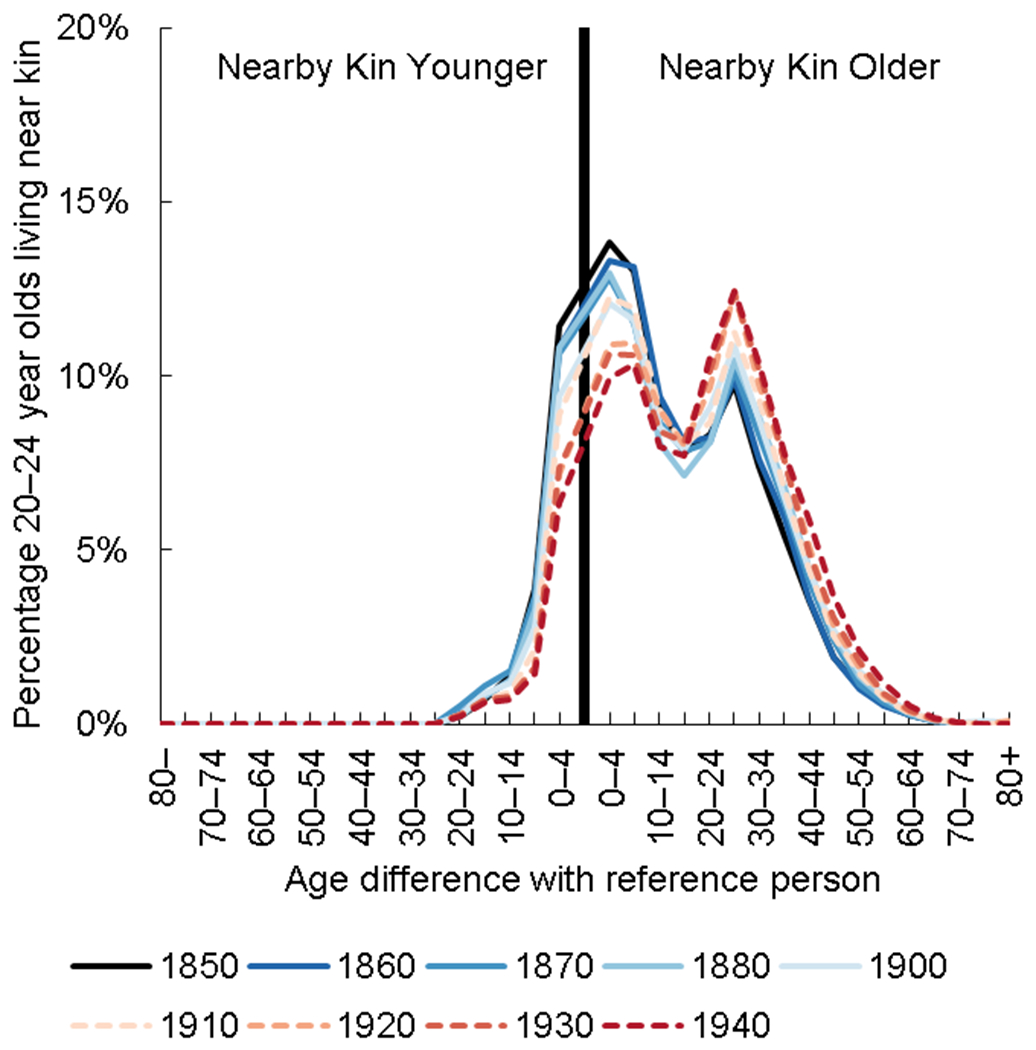
Age difference between nearby kin and 20-24 year old individuals, 1850–1940
Figure 6:

Age difference between nearby kin and 60-64 year old individuals, 1850–1940
These results strongly support a life cycle interpretation. Not only do the potential kin increase and decrease over the life course due to generational overlap, but the potential proximate kin matched within age groups we expect to see from this interpretation. The distribution of age differences describes largely consistent yet nuanced changes in Figures 4 through 6. In general, the percentage of older kin increased over time while the percentage of same-age or younger kin declined. For example, kin propinquity rates for 40–44-year-olds living near siblings were higher in 1850 than 1940 (higher fertility/sibling availability), with the reverse pattern for parents (declining mortality/fewer siblings over time) between 1850 and 1940 (Hacker and Roberts 2017).
A breakdown of kin propinquity by nativity, race, and urban/rural status shows several revealing patterns (Table 3). For nativity, first generation immigrants experienced far lower rates of kin propinquity when compared to second generation immigrants and families who had lived in the United States for three or more generations. This difference described the availability of kin, since many immigrants in the 19th century had family members who did not migrate to the United States. All categories of immigrants/migrants and native-born individuals experienced declining kin propinquity through this time period. Black persons and later American Indian persons experienced higher patrilineal kin propinquity rates than white persons nationally. Chinese persons had lower kin propinquity nationally than white persons, but their rates of kin propinquity did not follow the same consistent decline. While various policies such as segregation and Jim Crow laws, Indian Reservations, and the Chinese Exclusion Act of 1882 potentially affected kin propinquity, these demographic groups also have more complex family structures than white persons (Kamo 2000; Kamo and Zhou 1994; Ruggles 1994). Table 4 reinforces that these demographic groups had more complex family structures.
Table 3:
Kin propinquity rate by immigration, race, and urban/rural status, 1850–1940
| 1850 | 1880 | 1910 | 1940 | |
|---|---|---|---|---|
| First Generation Immigrant | 29.7% | 24.5% | 17.5% | 12.4% |
| U.S. Born | 45.2% | 37.3% | 28.6% | 20.4% |
| Second Generation Immigrant1 | - | 26.8% | 21.6% | - |
| Native-born | - | 40.1% | 30.9% | - |
| White | 44.0% | 35.4% | 26.6% | 19.1% |
| Black2 | 20.8% | 37.7% | 31.5% | 25.0% |
| American Indian | - | 6.3% | 22.2% | 20.3% |
| Chinese | - | 9.5% | 20.8% | 14.8% |
| Japanese | - | - | 10.5% | 1.9% |
| Rural | 44.8% | 40.1% | 33.8% | 26.6% |
| Farm | 47.8% | 42.3% | 36.6% | 29.9% |
| Nonfarm | 39.3% | 35.4% | 28.9% | 23.7% |
| Urban | 36.1% | 23.3% | 18.7% | 14.1% |
Second-Generation Immigrant defined as persons born in U.S. with at least one foreign-born parent
Black population in 1850 only includes Free Black population.
Table 4:
Kin propinquity and family living arrangements by race for persons age 65+, 1850-1940
| 1850 | 1880 | 1910 | 1940 | |
|---|---|---|---|---|
| Kin Propinquity | 52.2% | 41.3% | 29.6% | 22.8% |
| White | 53.2% | 41.7% | 29.6% | 20.0% |
| Black1 | 18.4% | 37.9% | 30.3% | 23.9% |
| American Indian | - | 10.9% | 20.6% | 18.9% |
| Chinese | - | 9.4% | 17.4% | 16.4% |
| Japanese | - | - | 6.7% | 2.4% |
| With Adult Children | 64.3% | 61.5% | 54.9% | 44.1% |
| White | 64.9% | 63.2% | 55.8% | 44.3% |
| Black1 | 42.0% | 46.7% | 44.5% | 41.4% |
| American Indian | - | 31.6% | 41.0% | 47.5% |
| Chinese | - | 14.4% | 10.7% | 25.0% |
| Japanese | - | - | 20.2% | 56.0% |
| Three Generation | 35.9% | 33.1% | 23.0% | 17.0% |
| White | 36.2% | 33.2% | 22.8% | 16.6% |
| Black1 | 26.3% | 32.5% | 25.4% | 22.2% |
| American Indian | - | 19.4% | 23.5% | 29.0% |
| Chinese | - | 4.6% | 4.2% | 8.5% |
| Japanese | - | - | 6.7% | 20.2% |
| Extended Kin | 8.0% | 15.1% | 10.5% | 11.0% |
| White | 8.0% | 15.3% | 10.5% | 10.9% |
| Black1 | 8.0% | 13.0% | 10.2% | 12.8% |
| American Indian | - | 7.7% | 13.6% | 13.9% |
| Chinese | - | 12.5% | 3.7% | 7.5% |
| Japanese | - | - | 5.9% | 5.8% |
| N | 508,884 | 1,699,362 | 3,801,239 | 8,624,554 |
| White | 494,617 | 1,522,856 | 3,492,285 | 8,011,952 |
| Black1 | 14,267 | 176,230 | 293,170 | 591,233 |
| American Indian | - | 86 | 13,297 | 15,293 |
| Chinese | - | 190 | 2,234 | 3,357 |
| Japanese | - | - | 253 | 2,719 |
Black population in 1850 only includes Free Black population.
For comparability, only elderly persons with legible surnames were analyzed
Table 4 summarizes the percentage of elderly persons (aged 65 and older) living in different family living arrangements by race. For context, the kin propinquity rates for all elderly persons are also included in Table 4. The family structures measured here include elderly persons living with adult children, in three generation families, and with extended kin as defined by Ruggles (2012) and Gruber and Szołtysek (2016) to control for kin availability. Elderly persons living in more complex families had fewer potential kin to live nearby, thus a shift in living arrangements could explain the decline in kin propinquity. An increase in complex families would provide few potential kin to live near, thus a shift towards more complex families could lead to lower kin propinquity. However, the trends in elderly family living arrangements cannot explain the decline in kin propinquity. In general, whites and Black elderly persons moved away from complex families, while American Indian, Chinese, and Japanese persons shifted towards more complex families between 1850 and 1940. The general decline of kin propinquity in this time period cannot be explained by a shift in complex family living arrangements, as family living arrangements were not negatively correlated with kin propinquity except for elderly Japanese persons living with adult children and three generation families.
Urban kin propinquity rates were much lower than rural rates (Table 3). Measured in terms of spatial distance rather than distance on the enumeration form, urban kin propinquity was likely higher when compared to the studies from the 1960s because urban enumeration districts were smaller than distances used in studies from the 1960s (Shanas 1961, 1967, 1973; Sussman 1959, 1965). Even with this methodological shortcoming, some previous scholarship argued kin ties in cities were weaker than in rural areas (Hofferth and Iceland 1998; Parsons 1943; Wirth 1938). When decomposing patrilineal kin as a single factor of urban/rural/farm status, the growth of urban population/decline of the agricultural population between 1850 and 1940 accounts for 38% of the decline in kin propinquity (Das Gupta 1993; Kitagawa 1955). Farm families had the highest kin propinquity rates through this time period. Based on a life cycle interpretation, children lived near parents and/or siblings, and land availability played an important role in some of these children living near kin. If land was unavailable, then children could continue living on their parents’ farm, migrate to find available land, or switch to a different occupation and migrate to the local town or large city for economic opportunities.
Regional variations in economic and demographic circumstances were associated with patrilineal kin propinquity (Figure 7). In 1790, the Northeast and the South both had kin propinquity rates of approximately 50% of households living nearby kin. The South had lower rates than the Northeast prior to 1850 when looking within three households, but when looking at all matches, the Northeast had lower rates than the South. While next-door kin propinquity was higher in the Northeast as argued by Smith, using a larger range questions this conclusion. Midwestern kin propinquity was low and rose steadily through 1850 because of its status as a frontier region of the United States. By 1850, parts of the Midwest were finally settled and experienced similar kin propinquity rates to the Northeast until 1890. The Midwest and South experienced similar declines in kin propinquity while the Northeast saw a larger decline. This reflected growing urbanization in the Northeast with the population expansion of cities such as New York City, Boston, and Philadelphia. With the rise of large cities such as Chicago, St. Louis, and Cincinnati during the mid- to late 19th century, the Midwest later experienced sharper declines in kin propinquity than the South. Further, the South had lower internal and international migration rates compared to the other regions, allowing for more kin availability (Hall and Ruggles 2004).
Figure 7:
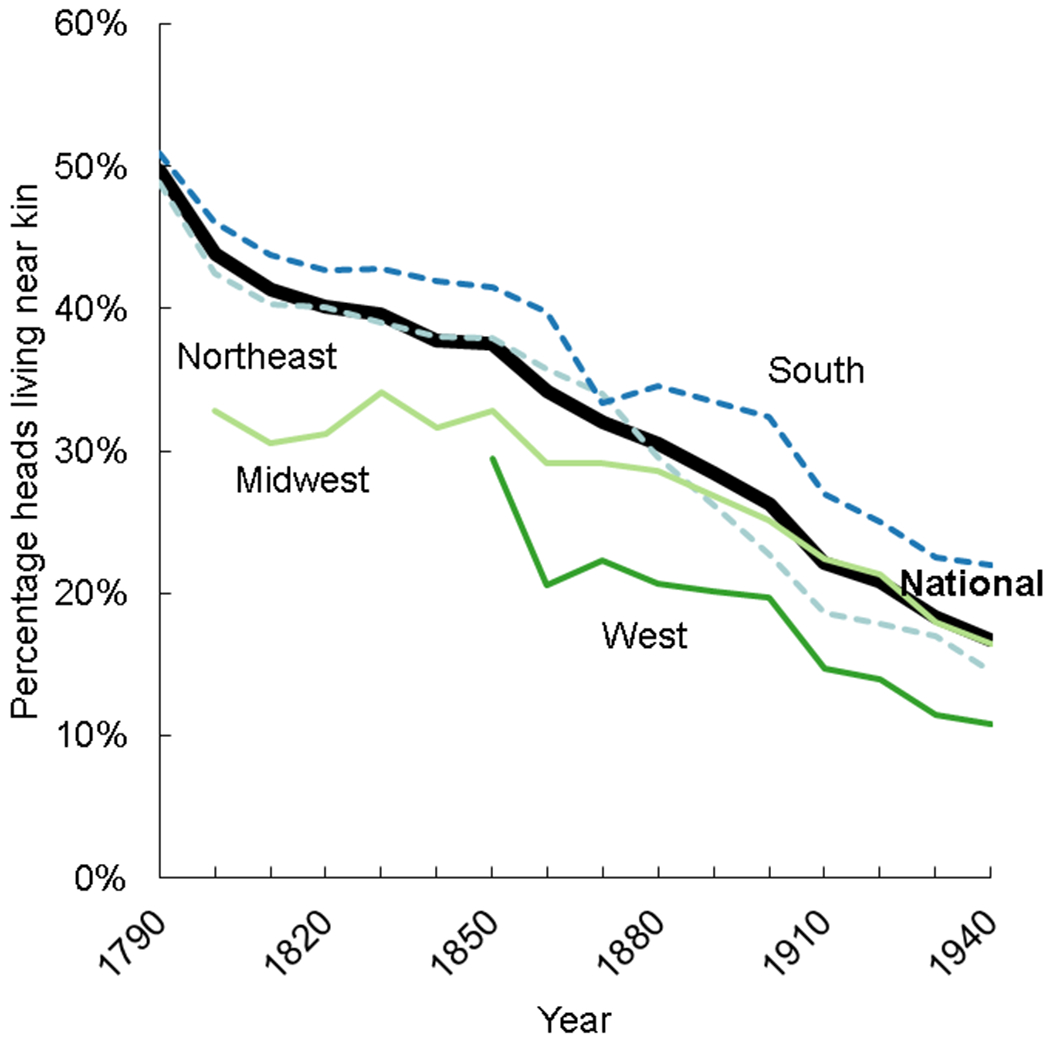
Kin propinquity rate by region, 1790–1940
Kin propinquity rates in the West were the lowest of the four regions. In 1850, only 30% of persons lived near kin in the West, declining to 11% in 1940. Clustering in particular counties within regions shows more nuance than the overall regional measure (Figures 8–10). Households in Appalachia, New Mexico, and Utah experienced higher kin propinquity rates than other areas within their regions. The Utah cluster in the 1880s was likely due to the high Church of Latter-Day Saints population, and Appalachia represented an area with a unique familyist society (Lewis and Billings 1997). Santa Fe, New Mexico, previously established in 1610, already had established societal structures when the United States annexed New Mexico in the Treaty of Guadalupe-Hidalgo after the Mexican–American War in 1848 (Resendéz 2004). High kin propinquity rates in New Mexico reflected a different frontier context than other frontier areas in the United States. While the general decline in kin propinquity can be seen between Figures 8–10, these high kin propinquity areas stand out amongst their respective regions.
Figure 8:

County kin propinquity rate, 1790 and 1820
Figure 10:

County kin propinquity rate, 1910 and 1940
5. Limitations
While this measure of patrilineal kin propinquity has many applicable uses in historical demography, there are some limitations with the method. The most prominent limitation as shown by the article title is, because of changing surnames upon marriage for women, only potential patrilineal kin can be captured with this measure. Some kin captured by this method were not true patrilineal kin (e.g., in-laws who marry into the family name), but this likely was balanced out by patrilineal kin who married outside of the family (e.g., daughters and sisters whose surname changed upon marriage). Further, the data are not genealogical links, but the probability of non-random isonymy. The implicit assumption with this measure is that if two families with the same surname have a high probability of non-randomly living near each other, it is likely because they share the same surname, and by extension, share a kinship link.
There is a possibility that this kin propinquity measure could overestimate kin propinquity for common surnames. For example, families with a common surname (e.g., Miller) are likely to become larger than less common surnames as families procreate. After several generations, there could be many Miller families living near each other yet be so far removed relationship-wise that they do not have kinship ties. However, I hypothesize that this is a relatively minor issue because the median distance between same surname households was less than 10 households in any given census year (Figure 1). I hypothesize that individuals with the same surname living within 10 households but so far removed to effectively not be kin was fairly rare. This could be a larger issue for further away matches. This kin propinquity measure should not be interpreted as the strength of a patrilineal kinship tie, but the probability that such a tie is even possible based on the implicit assumption above. While effective kinship is often close kin such as parents, siblings or children, effective kin need not be limited to those specific relationships (Bras and Tilburg 2007; Billingsley 2004). Given my hypothesis and the results from Table 2, I think the overestimation of kin propinquity for common surnames to be relatively minor.
Another limitation includes the abstract measure of distance between households. The distance between households is unknown and varies between rural and urban environments. Using county population density and the 1930 Census urban definition of 2,500 or more persons as measures of urbanization, the kin propinquity measure was not correlated with either measure of urbanization at the individual level. The correlation coefficient between county population density and individual kin propinquity ranged between 0.06 and –0.06 between 1850 and 1940, while urban status and kin propinquity correlations ranged between 0.04 and –0.10. When viewing the correlations at the county level, population density was uncorrelated with the county kin propinquity rate (ranged between 0.00 and –0.11), but the percentage of population living in a census-designated urban area was more highly correlated with the county kin propinquity rate. Between 1880 and 1940, the correlation coefficient ranged between – 0.44 and –0.62, showing that while kin propinquity at the individual level is not correlated with living in a place of 2,500 or more persons, counties with high percentages of urban population were correlated with lower county kin propinquity rates. This suggests that kin propinquity measures were largely not biased by urban environments, but urban areas likely did have lower kin propinquity rates than nonurban areas.
An alternative measure could compare kin propinquity between rural and urban areas using fixed physical distances, but that has its own issues. What distance threshold does one choose to analyze kin at a particular distance? Using an urban standard, agricultural rural kin propinquity would be almost 0, which is inaccurate (Billingsley 2004; Clarke 1991; Curti 1959; Ditz 1986; Gjerde 1985; Kenzer 1987; Smith 1989). The measure developed in this article likely underreports urban kin propinquity given the limitations of enumeration district sizes, but in terms of extremely close kin propinquity (the kind most likely to be captured by this measure), it is clear that there is a large kin propinquity decline in urban areas nonetheless. Smaller distance thresholds of kin propinquity (distances of 5, 10, 25, and 50 households away) show patrilineal kin propinquity still declined over the entire time period in both urban and rural contexts. Even if changing enumeration district sizes contributed to the decline, patrilineal kin propinquity still declined regardless. While these limitations should be considered in interpreting the measures, it does not appear these limitations bias the results. To address the distances between households, using geocoded data may illuminate and better contextualize potential kin living near one another, particularly in urban areas.
6. Discussion
The long-run decline in patrilineal kin propinquity demonstrates the economic and demographic transformations the United States underwent between 1790 and 1940 and lends credence (though speculative) to the long-run decline in the importance of kinship and rise of individualism (Smith 1989). It is also possible instead of the declining importance of kinship, declining kin propinquity represents a transformation of kinship interaction with better transportation and communication networks. The decline in kin propinquity closely mirrored other long-run demographic and economic trends such as the decline of intergenerational coresidence, declining fertility, and the decline in agricultural employment. Given changes in general attitudes towards family values such as divorce, single parenthood, and cohabitation, it seems that the decline in kin propinquity further reflected changing social norms revolving around kinship (Hacker and Roberts 2017; Ruggles 2007, 2015). Distance between families also increased during this time period, suggesting a change in preference for living next door to kin, but also improvements in transportation allowing for kin to still live nearby while not living next door.
Families with kin living nearby exhibited traditional family life cycles, with the highest kin propinquity rates for persons with the greatest generational overlap. Economic opportunities grew as industrialization, rising land values, and better agricultural productivity no longer required and/or allowed children to live nearby. The decline of patrilineal kin propinquity affected older generations, who primarily lived near children the most. In 1850, 52% of 65-year-old persons lived near someone with the same surname compared to 44% of 20-year-old persons. By 1940, 20% of 65-yearold persons lived near potential kin, the same rate as 20-year-old persons.
Rural kin propinquity, especially for farm families, was significantly higher than urban kin propinquity rates. This does not necessarily imply weak kinship networks in cities, as the kin propinquity measure used here has limitations in urban contexts. However, the results support previous research that rural kinship networks were more extensive than urban kinship networks (Gjerde 1997; Parsons 1943; Wirth 1938). Finally, clear regional differences reflected different economic and demographic conditions. The Northeast and South had the highest kin propinquity rates prior to 1850 but took different trajectories after 1790. The West had some of the lowest kin propinquity rates, which reflected its frontier status during this time period and that opening up to wider US settlement after industrialization had been underway.
While historians and demographers have hypothesized a decline in kinship, this study represents the first systematic attempt to measure long-run trends in patrilineal kin propinquity. Kin propinquity plays an important role for families as emotional and physical support. Furthermore, kin propinquity likely played a role in demographic outcomes such as fertility, mortality, and migration (Hacker and Roberts 2017). Explaining the role of kin propinquity in these outcomes requires having a reliable measure, and this work is now possible in historical contexts using complete count census data.
Figure 5:

Age difference between nearby kin and 40-44 year old individuals, 1850–1940
Figure 9:

County kin propinquity rate, 1850 and 1880
7. Acknowledgments
Research was supported from the Minnesota Population Center and IPUMS USA, both funded through grants from the Eunice Kennedy Shriver National Institute of Child Health and Human Development (P2CHD041023 and R01HD43392). I would like to thank Steven Ruggles, J. David Hacker, Evan Roberts, Don Lafreniere, and Hilde Bras for their support and suggestions. I received valuable feedback from participants at the Social Science History Association meetings in 2015–2018 and the Population Association of America meeting in 2017. I also thank the two anonymous referees for their suggestions.
Footnotes
Detailed IPUMS race codes were recoded to more general codes. The largest example of this is mulatto, which was coded as black.
Families are defined by the reference person for a family. The reference person is defined as the first person in a surname sequence within a household. When analyzing only heads of household, this person is always the head of household or the first person in the household. When analyzing individual families, while the reference person is typically the head of household, households that contain multiple surname families will contain multiple reference persons. When analyzing the individual method, Frsi and Trs are based on the number of reference persons rather than the number of households.
Pre-1850 cases exclude alphabetized cases as documented by Nelson (2018). Due to outliers in some census years, only matches within the first 2,000 households are included in Figure 1. Distances were calculated based on the raw distance between households, not Di.
References
- Billingsley CE (2004). Communities of kinship: Antebellum families and the settlement of the cotton frontier. Athens: University of Georgia Press. [Google Scholar]
- Blake K (1996). ‘First in the path of the firemen’: The fate of the 1890 Population Census, Part 1. Prologue Magazine 28: 1. [Google Scholar]
- Bras H and van Tilburg T (2007). Kinship and social networks: A regional analysis of sibling relations in twentieth-century Netherlands. Journal of Family History 32(3): 296–322. doi: 10.1177/0363199007300244. [DOI] [Google Scholar]
- Clarke J (1991). Social integration on the upper Canadian frontier: Elements of community in Essex County 1790–1850. Journal of Historical Geography 17(4): 390–412. doi: 10.1016/0305-7488(91)90024-P. [DOI] [Google Scholar]
- Cohen WJ, Ball RM, and Myers RJ (1954). Social security act amendments of 1954: A summary and legislative history. Social Security Bulletin 17(9): 3–18. [Google Scholar]
- Crimmins EM and Ingegneri DG (1990). Interaction and living arrangements of older parents and their children: Past trends, present determinants, future implications. Research on Aging 12(1): 3–35. doi: 10.1177/0164027590121001. [DOI] [PubMed] [Google Scholar]
- Curti M (1959). The making of an American community: A case study of democracy in a frontier county. Stanford: Stanford University Press. [Google Scholar]
- Das Gupta P (1993). Standardization and decomposition of rates: A user’s manual. U.S. Bureau of the Census, Current Population Reports, Series P23–186. Washington, D.C.: U.S. Government Printing Office. [Google Scholar]
- Demos J (2000). A little Commonwealth: Family life in Plymouth Colony. 2nd ed. New York: Oxford University Press. [Google Scholar]
- Ditz TL (1986). Property and kinship: Inheritance in early Connecticut, 1750–1820. Princeton: Princeton University Press. doi: 10.1515/9781400858293. [DOI] [Google Scholar]
- Gjerde J (1985). From peasants to farmers: The migration from Balestrand, Norway to the Upper Middle West. Cambridge: Cambridge University Press. [Google Scholar]
- Gjerde J (1997). The minds of the west: Ethnocultural evolution in the rural Middle West, 1830–1917. Chapel Hill: University of North Carolina Press. [Google Scholar]
- Gratton B and Gutmann MP (2010). Emptying the nest: Older men in the United States, 1880–2000. Population and Development Review 36(2): 331–356. doi: 10.1111/j.1728-4457.2010.00332.x. [DOI] [PubMed] [Google Scholar]
- Grigoryeva A and Ruef M (2015). The historical demography of racial segregation. American Sociological Review 80(4): 814–842. doi: 10.1177/0003122415589170. [DOI] [Google Scholar]
- Gruber S and Szołtysek M (2016). The patriarchy index: A comparative study of power relations across historical Europe. History of the Family 21(2): 133–174. doi: 10.1080/1081602X.2014.1001769. [DOI] [Google Scholar]
- Hacker JD (2003). Rethinking the ‘early’ decline of marital fertility in the United States. Demography 40(4): 605–620. doi: 10.1353/dem.2003.0035. [DOI] [PubMed] [Google Scholar]
- Hacker JD and Roberts E (2017). The impact of kin availability, parental religiosity, and nativity on fertility differentials in the late 19th-century United States. Demographic Research 37(34): 1049–1080. doi: 10.4054/DemRes.2017.37.34. [DOI] [PMC free article] [PubMed] [Google Scholar]
- Hall PK and Ruggles S (2004). ‘Restless in the midst of their prosperity’: New evidence on the internal migration of Americans, 1850–2000. The Journal of American History 91(3): 829–846. doi: 10.2307/3662857. [DOI] [Google Scholar]
- Hareven TK (1994). Aging and generational relations: A historical and life course perspective. Annual Review of Sociology 20: 437–461. doi: 10.1146/annurev.so.20.080194.002253. [DOI] [Google Scholar]
- Hofferth SL and Iceland J (1998). Social capital in rural and urban communities. Rural Sociology 63(4): 574–598. doi: 10.1111/j.1549-0831.1998.tb00693.x. [DOI] [Google Scholar]
- Kamo Y (2000). Racial and ethnic differences in extended family households. Sociological Perspectives 43(2): 211–229. doi: 10.2307/1389794. [DOI] [Google Scholar]
- Kamo Y and Zhou M (1994). Living arrangements of elderly Chinese and Japanese in the United States. Journal of Marriage and Family 56(3): 544–558. doi: 10.2307/352866. [DOI] [Google Scholar]
- Kenzer RC (1987). Kinship and neighborhood in a southern community: Orange County, North Carolina, 1849–1881. Knoxville: University of Tennessee. [Google Scholar]
- Kitagawa EM (1955). Components of a difference between two rates. Journal of the American Statistical Association 50(272): 1168–1194. doi: 10.1080/01621459.1955.10501299. [DOI] [Google Scholar]
- Laslett P (1965). The world we have lost. London: Methuen. [Google Scholar]
- Leigh GK (1982). Kinship interaction over the family life span. Journal of Marriage and Family 44(1): 197–208. doi: 10.2307/351273. [DOI] [Google Scholar]
- Lemon JT (1972). The best poor man’s country: A geographical study of early southeastern Pennsylvania. Baltimore: Johns Hopkins Press. [Google Scholar]
- Lewis RL and Billings DB (1997). Appalachian culture and economic development: A retrospective view on the theory and literature. Journal of Appalachian Studies 3(1): 3–42. [Google Scholar]
- Lin G and Rogerson PA (1995). Elderly parents and the geographic availability of their adult children. Research on Aging 17(3): 303–331. doi: 10.1177/0164027595173004. [DOI] [Google Scholar]
- Litwak E (1960). Geographic mobility and extended family cohesion. American Sociological Review 25(3): 385–394. doi: 10.2307/2092085. [DOI] [Google Scholar]
- Litwak E (1965). Extended kin relations in an industrial democratic society. In: Streib GF and Shanas E (eds.). Social structure and the family: Generational relations. Englewood Cliffs: Prentice-Hall: 290–325. [Google Scholar]
- Logan JR, Jindrich J, Shin H, and Zhang W (2011). Mapping America in 1880: The Urban Transition Historical GIS Project. Historical Methods 44(1): 49–60. doi: 10.1080/01615440.2010.517509. [DOI] [PMC free article] [PubMed] [Google Scholar]
- Logan T and Parman JM (2017). The national rise in residential segregation. Journal of Economic History 77(1): 127–170. doi: 10.1017/S0022050717000079. [DOI] [Google Scholar]
- Manson S, Schroeder J, Van Riper D, and Ruggles S (2019). IPUMS National Historical Geographic Information System: Version 14.0 [Database]. Minneapolis: University of Minnesota. doi: 10.18128/D050.V14.0. [DOI] [Google Scholar]
- McQuillan DA (1990). Prevailing over time: Ethnic adjustment on the Kansas prairies, 1875–1925. Lincoln: University of Nebraska Press. [Google Scholar]
- Minnesota Population Center and Ancestry.com. (2013). IPUMS Restricted Complete Count Data: Version 1.0 [Machine readable database] Minneapolis: University of Minnesota. [Google Scholar]
- Nelson MA (2018). Relieved of these little chores: Agricultural neighbor labor, family labor, and kinship in the United States 1790–1940. [PhD thesis] Minneapolis: University of Minnesota, History. [Google Scholar]
- Nelson MA (2019). Agricultural family and neighbor labor in nineteenth-century Minnesota. Historicka Demografie 43(2): 211–231. [Google Scholar]
- Ostergren RC (1988). A community transplanted: The Trans-Atlantic experience of a Swedish immigrant settlement in the Upper Middle West, 1835–1915. Madison: University of Wisconsin Press. [Google Scholar]
- Owsley FL (1949). Plain folk of the old south. Baton Rouge: Louisiana State University. [Google Scholar]
- Parsons T (1943). The kinship system of the contemporary United States. American Anthropologist 45(1): 22–38. doi: 10.1525/aa.1943.45.1.02a00030. [DOI] [Google Scholar]
- Pitts Y (2013). Family, law, and inheritance in America: A social and legal history of nineteenth-century Kentucky. Cambridge: Cambridge University Press. doi: 10.1017/CBO9781139564991. [DOI] [Google Scholar]
- Preston SH (1976). Family sizes of children and family sizes of women. Demography 13(1): 105–144. doi: 10.2307/2060423. [DOI] [PubMed] [Google Scholar]
- Reséndez A (2004). Changing national identities at the frontier: Texas and New Mexico, 1800–1850. Cambridge: Cambridge University Press. [Google Scholar]
- Rothenberg WB (1992). From market-places to a market economy: The transformation of rural Massachusetts, 1750–1850. Chicago: The University of Chicago Press. [Google Scholar]
- Ruggles S (1994). The origins of African-American family structure. American Sociological Review 59(1): 136–151. doi: 10.2307/2096137. [DOI] [Google Scholar]
- Ruggles S (2007). The decline of intergenerational coresidence in the United States, 1850 to 2000. American Sociological Review 72(6): 964–989. doi: 10.1177/000312240707200606. [DOI] [PMC free article] [PubMed] [Google Scholar]
- Ruggles S (2012). The future of historical family demography. Annual Review of Sociology 38: 423–441. doi: 10.1146/annurev-soc-071811-145533. [DOI] [PMC free article] [PubMed] [Google Scholar]
- Ruggles S (2015). Patriarchy, power, and pay: The transformation of American families, 1800–2015. Demography 52(6): 1797–1823. doi: 10.1007/s13524-0150440-z. [DOI] [PMC free article] [PubMed] [Google Scholar]
- Ruggles S (2016). Marriage, family systems, and economic opportunity in the United States since 1850. In: McHale SM, Van Hook J, King V, and Booth A (eds.). Gender and couple relationships. Heidelberg: Springer: 3–41. doi: 10.1007/978-3-319-21635-5_1. [DOI] [Google Scholar]
- Ruggles S, Flood S, Goeken R, Grover J, Meyer E, Pacas J, and Sobek M (2020). Integrated public use microdata series: Version 10.0 [dataset], Minneapolis: University of Minnesota. doi: 10.18128/D010.V10.0. [DOI] [Google Scholar]
- Shanas E (1961). Living arrangements of older people in the United States. The Gerontologist 1(1): 27–29. doi: 10.1093/geront/1.1.27. [DOI] [Google Scholar]
- Shanas E (1967). Help patterns and social class in three countries. Journal of Marriage and Family 29(2): 257–266. doi: 10.2307/349686. [DOI] [Google Scholar]
- Shanas E (1973). Family-kin networks and aging in cross-cultural perspective. Journal of Marriage and Family 35(3): 505–511. doi: 10.2307/350586. [DOI] [Google Scholar]
- Smith DS (1979). Averages for units and averages for individuals within units: A note. Journal of Family History 4(1): 84–86. doi: 10.1177/036319907900400106. [DOI] [Google Scholar]
- Smith DS (1989). ‘All in some degree related to each other’: A demographic and comparative resolution of the anomaly of New England Kinship. The American Historical Review 94(1): 44–79. doi: 10.2307/1862077. [DOI] [Google Scholar]
- Spring A, Ackert E, Crowder K, and South SJ (2017). Influence of proximity to kin on residential mobility and destination of choice: Examining local movers in metropolitan areas. Demography 54(4): 1277–1304. doi: 10.1007/s13524-0170587-x. [DOI] [PMC free article] [PubMed] [Google Scholar]
- Sussman MB (1953). The help pattern in the middle class family. American Sociological Review 18(1): 22–28. doi: 10.2307/2087844. [DOI] [Google Scholar]
- Sussman MB (1959). The isolated nuclear family: Fact or fiction? Social Problems 6(4): 333–340. doi: 10.2307/799367. [DOI] [Google Scholar]
- Sussman MB (1965). Relationships of adult children with their parents in the United States. In: Shanas E and Streib GF (eds.). Social structure and the family: Generational relations. Englewood Cliffs: Prentice-Hall Inc.: 62–92. [Google Scholar]
- Wall R (2010). Economic collaboration of family members within and beyond households in English society, 1600–2000. Continuity and Change 25(1): 83–108. doi: 10.1017/S0268416010000032. [DOI] [Google Scholar]
- Wetherell C, Plakans A, and Welman B (1994). Social networks, kinship, and community in Eastern Europe. The Journal of Interdisciplinary History 24(4): 639–663. doi: 10.2307/205629. [DOI] [Google Scholar]
- Wirth L (1938). Urbanism as a way of life. American Journal of Sociology 44(1): 1–24. doi: 10.1086/217913. [DOI] [Google Scholar]
- Wolf DA (1994). The elderly and their kin: Patterns of availability and access. In: Martin LG and Preston SH (eds.). Demography of aging. Washington, D.C.:National Academy Press: 146–194. [Google Scholar]