

Abstract
Objective:
Adjuvant management for laryngotracheal stenosis (LTS) may involve inhaled corticosteroids, but metered dose inhalers are designed for pulmonary drug delivery. Comprehensive analyses of drug particle deposition efficiency for orally inhaled corticosteroids in the stenosis of LTS subjects are lacking.
Study Design:
Descriptive Research
Setting:
Academic medical center
Methods:
Anatomically realistic three-dimensional reconstructions of the upper airway were created from computed tomography images of four LTS subjects – two subglottic stenosis and two tracheal stenosis subjects. Computational fluid dynamics modeling was used to simulate airflow and drug particle transport in each airway. Three inhalation pressures were simulated, 10Pa, 25Pa, and 40Pa. Drug particle transport was simulated for 100–950 nanoparticles and 1–50 micron-particles. Particles were released into the airway to mimic varying inhaler conditions with and without a spacer chamber.
Results:
Based on smallest to largest cross-sectional area ratio, the laryngotracheal stenotic segment shrunk by 57% and 47%, respectively, for subglottic stenosis models and by 53% for both tracheal stenosis models. Airflow resistance at stenotic segment was lower in subglottic stenosis models than in tracheal stenosis models: 0.001–0.011Pa.s/ml versus 0.024–0.082Pa.s/ml. Drug depositions for micron-particles and nanoparticles at stenosis were 0.06%−2.48% and 0.10%−2.60% for subglottic stenosis and tracheal stenosis models, respectively. Particle sizes with highest stenotic deposition were 6μm-20μm for subglottic stenosis models and 1μm-10μm for tracheal stenosis models.
Conclusion:
This study suggests that at most 2.60% of inhaled drug particles deposit at the stenosis. Particle size ranges with highest stenotic deposition may not represent typical sizes emitted by inhalers.
Keywords: Laryngotracheal stenosis, subglottic stenosis tracheal stenosis, computational fluid dynamics, airflow, particle transport, inhaled corticosteroids, metered dose inhalers, spacer chamber
INTRODUCTION
Diagnosis and management of patients with laryngotracheal stenosis (LTS) involves multiple specialists (otolaryngologists, thoracic surgeons, and interventional pulmonologists) who utilize a variety of surgical and adjuvant treatments.(1–3) Treatment usually comprises medical therapy, endoscopic dilation and airway reconstruction.(4–9) Endoscopic dilation is considered a minor outpatient procedure but provides temporary improvement that is often followed by recurrent symptoms, thus requiring repeated dilation or airway reconstruction.(6, 10, 11) Airway reconstruction is a definitive treatment and frequently preferred for more severe stenosis, but it is a major procedure with higher morbidity and mortality than endoscopic dilation.(6)
In an effort to address the underlying inflammatory disease and reduce recurrent stenosis, patients with LTS are often prescribed topical medications, such as orally inhaled corticosteroids.(1, 12) Yet, the effectiveness of targeting inhaled corticosteroids to the stenotic region of LTS patients using metered dose inhalers (MDIs) has not been thoroughly investigated.(1) More importantly, the use of MDIs for LTS raises several unanswered questions: [1] Given that MDIs are designed for pulmonary drug delivery, how effective are they in delivering drugs to the stenotic region of LTS subjects? [2] Given the heterogeneous nature of LTS, are there particular MDIs or alternative devices such as nebulizers that perform well for specific stenotic site(s) or severity of stenosis? [3] What is the relevance of a spacer chamber when used with MDIs in targeting inhaled drugs to the stenosis?
Understanding deposition patterns in LTS patients is an essential step for guiding and designing inhalational treatments. The present study uses computational fluid dynamics (CFD) techniques to simulate physiologically realistic airflow and orally inhaled drug particle transport in the laryngotracheal airway of four LTS subjects to investigate stenotic deposition distributions.
METHODS
This study was approved by the Duke University Health System Institutional Review Board for Clinical Investigations. High resolution computed tomography (CT) images of the laryngotracheal airway from four subjects seen between January 1, 2006 and April 6, 2016 were selected based on these inclusion criteria: [1] diagnosis of LTS; [2] 18 to 89 years old; and [3] available CT of the larynx and trachea.
Airway Reconstruction
Subjects’ CT scans were performed without contrast and in the axial direction, with number of slices between 129 and 595, slice thickness ranged from 0.244mm to 2.5mm, and pixel size was between 0.244mm and 0.484mm. CT images were imported into the image processing software, Avizo 9.5.0 (Thermo Fisher Scientific, Waltham, Massachusetts) for de-identification of personal data and creation of subject-specific anatomically realistic three-dimensional (3D) models of the laryngeal and tracheal airway. This was done by setting the segmentation threshold as −1024HU to −300HU, and using the “Magic Wand” and “Brush” tools in Avizo to segment the airspace. As subjects’ CT excluded their nasal and oral cavities, we digitally appended the same anatomically realistic 3D nasal and oral cavities onto the laryngotracheal airway for every subject to facilitate physiologically accurate airway respiration.
Mesh Generation
The models created were imported into the mesh-generation software package, ANSYS ICEM-CFD™ 19.0 (ANSYS, Canonsburg, Pennsylvania) for meshing using techniques described in prior publications.(13–19) A hybrid tetrahedral-prism mesh was generated in each model with approximately six million unstructured tetrahedral elements. A finer three-layer prism-element with 0.15mm thickness per layer was created at the airway walls. Mesh refinement analysis was not performed since the choice of mesh density chosen was consistent with a detailed mesh sensitivity analysis reported in Frank-Ito et al. (20), which showed that six million elements will provide mesh independent numerical results.(20, 21)
Airflow Simulation
The CFD software package ANSYS Fluent™ 19.0 (ANSYS, Inc., Canonsburg, Pennsylvania) was used to simulate airflow at three different inhalation pressures (10Pa, 25Pa, and 40Pa).(22) The latter two inhalation pressures (25Pa and 40Pa) were chosen to be consistent with approximated pressure drops just below the stenotic region for tidal volume and 1.5 times tidal volume, as reported by Taherian and colleagues(23, 24) Following this logic, we estimated that pressure drop for 0.5 times tidal volume will be about 10Pa.
All simulations used a steady, incompressible model, where flow was driven using pressure boundary-conditions, which mimic real-life inhalation techniques. Turbulent airflow simulation was implemented using the shear-stress transport k-ω model, with low Reynolds number corrections.(25, 26) In accordance with validated results in Kimbell et al. (27),the turbulence length scale was set at 1mm, and turbulent intensity to be 5% at the inlet (nostrils and mouth). The k-ω model has been reported to accurately predict pressure drop, velocity profiles, and shear stress from transition to turbulent flows.(28–30)
To simulate the inhalation, negative gauge pressure boundary conditions were specified at the outlet, located at carina of trachea. At the inlet (mouth and nostrils), atmospheric conditions were specified with zero gauge pressure. The nasal wall was considered stationary, with no-slip boundary conditions.
Particle Simulation
Particle dispersed phase involved simulating drug particle trajectories in the airway during inhalation; dispersed particles exchanged momentum and mass with inhaled airflow. Particle trajectories were calculated using the Euler-Lagrange approach via the Lagrangian discrete phase model in Fluent™, assuming unit density, spherical particles with particle density of 1000kg/m3, while ignoring particle-to-particle interactions.(22, 31)
The simulation setup mirrored delivering inhaled corticosteroids during inhalation with MDIs. Simulated drug particles were released evenly across the oral inlet (inhaler mouthpiece), with micron particle size distribution ranging in diameter from 1–50μm (with 1μm increments), and nanoparticles sizes were 100–950nm (with 50nm increments). For simulations of nanoparticles, the Saffman’s lift force was included as an additional force term to the equations of motion for particles.(22, 32, 33) For each particle size, and depending on cross-sectional area of the subject’s oral inlet, between 865 and 1516 particles were relapsed into the airway. The total nanoparticles released ranged 15,250 – 27,288, and 43,250 – 75,800 for micron particles.
Three particle velocities were simulated (1, 3, and 10m/s) for inhaler delivery without a spacer chamber. Some patients use a spacer chamber, which is attached to the inhaler to modulate particle velocity. Hence, simulations also included a 0m/s particle velocity case to model the spacer chamber. For spacer simulations, between 268 and 432 particles were released per particle size, and total number of particles released evenly across the spacer were 4,824 – 7,776 (nanoparticles), and 13,400 – 21,600 (micron particles). The rationale for reducing the number of particles released from spacer compared oral inlet is the underlying fact that some particles emitting from the inhaler will be trapped in the spacer chamber.
Particles released from oral inlet or spacer were tracked until they either exited the airway or deposited on the airway mucosa. Deposited particles were categorized by region: epiglottis, glottis, oral cavity, oropharynx, subglottis and trachea (Fig. 1). The stenotic region comprises a subset of the subglottis (for subglottic stenotic patients) or trachea (for tracheal stenotic patients), where particle deposition was also calculated. All stenotic regions were confirmed with flexible laryngoscopy or bronchoscopy in clinic. The stenotic region on the 3D reconstruction was first identified and characterized without the aid of laryngoscopy or bronchoscopy notes, and the regions correlated well with the clinic notes
FIGURE 1.

Upper airway anatomy depicting regions where deposited drug particles were tracked.
RESULTS
An initial search using the Duke University Enterprise Unified Content Explorer generated a total of 66 unique patients with LTS were seen by the co-author (SMC). After excluding patients with multi-level LTS, concurrent cancer diagnoses, and availability of CT images of the laryngotracheal airway, 10 patients met the inclusion criteria. Among patients who met the inclusion criteria, 4 patients with a high resolution CT images were selected for the present study. Subject 1 is 43-year-old and Subject 2 is 48-year-old, both subjects are Caucasian females with a clinical diagnosis of subglottic stenosis. Subjects 3 and 4 are Caucasian males aged 49 years and 45 years, respectively, both with a clinical diagnosis of tracheal stenosis.
Stenotic Airway (Table 1)
Table 1.
(Upper Airway Model Characteristics)
| Subject (Stenotic Site) | Stenotic Length (mm) | Area of Most Constricted Stenotic Cross-Section (mm2) | Area of Least Constricted Stenotic Cross-Section (mm2) | Total Flow Rate [@10Pa IP] [@25Pa IP] [@40Pa IP] (L/min) |
Stenotic Pressure Drop [@10Pa IP] [@25Pa IP] [@40Pa IP] (Pa) |
Total Airway Resistance [@10Pa IP] [@25Pa IP] [@40Pa IP] (Pa.s/ml) |
Airway Above Stenosis Resistance [@10Pa IP] [@25Pa IP] [@40Pa IP] (Pa.s/ml) |
Stenotic Airway Resistance [@10Pa IP] [@25Pa IP] [@40Pa IP] (Pa.s/ml) |
Airway Below Stenosis Resistance [@10Pa IP] [@25Pa IP] [@40Pa IP] (Pa.s/ml) |
|---|---|---|---|---|---|---|---|---|---|
| Model for Subject 1 (Subglottic) | 23 | 84 | 197 | 6.6 11.4 14.9 |
0.57 1.71 2.81 |
0.038 0.056 0.069 |
0.035 0.052 0.064 |
0.005 0.009 0.011 |
0.002 0.005 0.007 |
| Model for Subject 2 (Subglottic) | 13 | 127 | 239 | 3.0 4.9 6.4 |
0.04 0.08 0.55 |
0.174 0.268 0.336 |
0.175 0.270 0.340 |
0.001 0.001 0.005 |
0.0003 0.0004 0.0002 |
| Model for Subject 3 (Tracheal) | 27 | 47 | 101 | 3.2 5.3 6.8 |
2.40 5.81 9.30 |
0.160 0.249 0.314 |
0.116 0.184 0.234 |
0.045 0.066 0.082 |
0.001 0.001 0.001 |
| Model for Subject 4 (Tracheal) | 22 | 82 | 174 | 8.7 14.5 18.9 |
3.51 9.64 15.87 |
0.034 0.058 0.072 |
0.017 0.028 0.036 |
0.024 0.040 0.050 |
0.007 0.010 0.014 |
For airway models of subglottic stenosis subjects, Subject 1 stenotic length was 23mm, and 13mm for Subject 2. Within the stenotic region, airway model for Subject 1 had a cross-sectional area ranging from 84 to 197 mm2. Using the ratio of smallest to largest cross-section, a constriction percentage may be calculated at 57%. For Subject 2 airway model, this range was 127 to 239mm2 (a 47% constriction).
Similarly, the stenotic lengths for airway models of tracheal stenosis subjects were 27mm (Subject 3) and 22mm (Subject 4). At the stenotic vicinity and based on the ratio of smallest to largest cross-section, airway models for both subjects’ trachea shrunk by 53% (largest cross-section: Subject 3 =101mm2; Subject 4 =174mm2 and smallest cross-section: Subject 3 =47mm2; Subject 4 = 82mm2).
Airflow and Resistance
Volumetric flowrates among subglottic stenotic airway models were 6.6L/min – 14.9L/min (Subject 1) and 3.0L/min – 6.4L/min (Subject 2) at 10Pa – 40Pa inhalation pressures (Table 1). Comparable flowrate patterns were computed for tracheal stenotic airway models, 3.2 – 6.8L/min (Subject 3) and 8.7 – 18.9L/min (Subject 4) at 10 – 40Pa inhalation pressure. Further, stenotic pressure drop and airflow resistance were noticeably lower in subglottic stenosis models than in tracheal stenosis models (Table 1). Airflow resistance at sites of stenosis for all simulated inhalation pressures were 0.005 – 0.011 Pa.s/ml and 0.001 – 0.005 Pa.s/ml for subglottic stenosis Subjects 1 and 2, respectively; 0.045 – 0.082 Pa.s/ml and 0.024 – 0.050 Pa.s/ml for tracheal stenosis Subjects 3 and 4, respectively
In all subjects’ airway models, regardless of stenotic site, flow resistance was highest from oropharynx to beginning cross-section of stenotic segment (airway superior to stenotic site) compared to stenotic segment and the region inferior to stenotic site. The region inferior to stenotic site had the lowest flow resistance in all subjects. With respect to total laryngotracheal flow resistance (oropharynx to carina of trachea), there was no difference in resistance values between airway models of subglottic stenosis and tracheal stenosis subjects.
Stenotic Deposition
Drug particle comprising nanoparticles had the highest deposition in the stenosis in Subject 1 (0.83%) airway model, occurring at 40Pa inhalation pressure and for particles released from spacer (Fig. 2A). This is followed by nanoparticles released from oral inlet at 1m/s (0.51%) and at 10m/s (0.50%). In Subject 2 airway model, micron-particles released from oral inlet at 1m/s during 10Pa inhalation pressure had the highest stenotic deposition (2.48%; Fig. 2B). This is closely followed by nanoparticles released from oral inlet at 10m/s (2.40%) and at 3m/s (2.38%) with 40Pa inhalation pressure. In general, Subject 2 airway model had higher stenotic deposition efficiency for both micron and nanoparticles, and across every inhalation pressure and particle velocity than Subject 1 airway model (Figs. 2A & 2B).
FIGURE 2.

Micro-particles and nanoparticles deposition in stenosis for subjects’ airway models with subglottic stenosis and tracheal stenosis at varying inhalation pressures and particle velocities. (A) Subject 1; (B) Subject 2; (C) Subject 3; (D) Subject 4.
Regarding airway models for tracheal stenosis subjects, stenotic deposition in Subject 3 was highest during 25Pa inhalation pressure, and with nanoparticles released from oral inlet at 1m/s (2.32%), at 10m/s (2.13%), and at 3m/s (2.12%), respectively (Fig. 2C). For Subject 4 airway model, micron-particles released from spacer during 40Pa inhalation pressure had the highest stenotic deposition (2.60%), next to nanoparticles released from spacer at the same inhalation pressure (2.24%; Fig. 2D). In Subject 3 airway model, nanoparticles had superior stenotic deposition across all simulation characteristics, while particles released from spacer had superior stenotic deposition across all simulation characteristics in Subject 4 airway model (Figs. 2C & 2D).
Stenotic Deposition by Particle Size
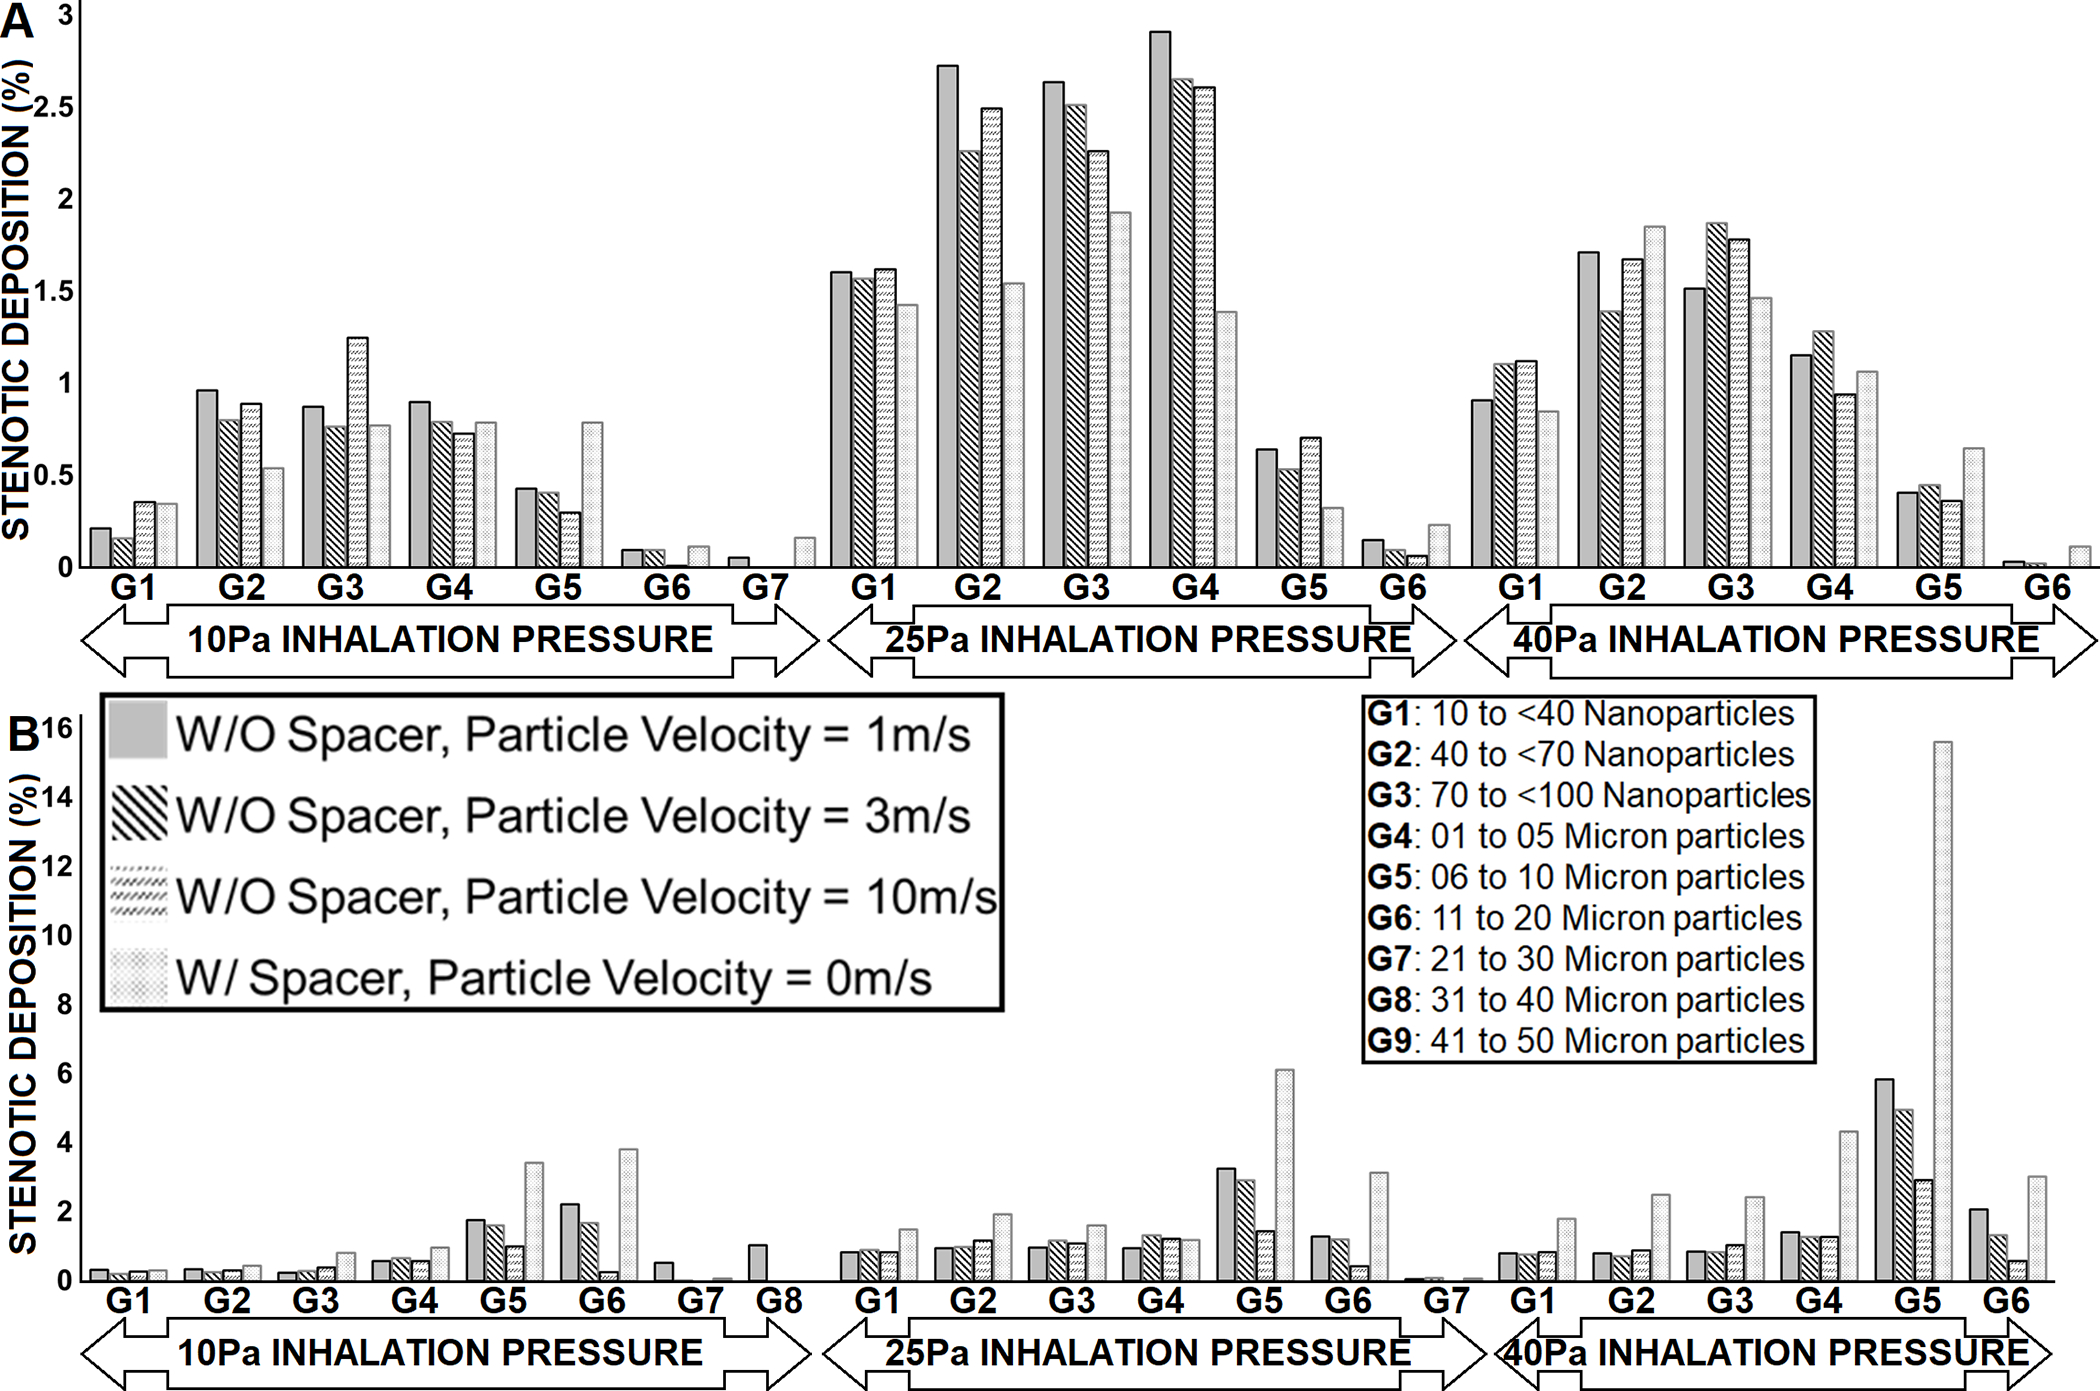
Fig. 3A describes subglottic stenotic deposition by particle size range in Subject 1 airway model, with 6–10μm particles (G5) having the highest deposition in stenosis at 10Pa inhalation pressure. Approximately 2.31% of 6–10μm particles released from spacer deposited in stenotic segment, followed by 1.27% of 6–10μm particles released from oral inlet at 1m/s depositing in the stenosis. Other particle sizes with enhanced stenotic deposition in Subject 1 airway model were 11–20μm particles (G6) released with 1m/s velocity, and from spacer for 10Pa inhalation pressure. As demonstrated in Fig. 3B, particle size range with highest subglottic stenotic deposition (7.93%) in Subject 2 airway model was 11–20μm particles (G6) released with 1m/s velocity from oral inlet. Stenotic deposition in Subject 2 airway model was also high for 6–10μm particles (G5) from different released velocities at 10Pa and 25Pa inhalation pressures.
FIGURE 3.

Stenotic deposition by particle size groups for subjects’ airway models with subglottic stenosis at varying inhalation pressures and particle velocities. (A) Subject 1; (B) Subject 2. Missing particle size group imply zero particle deposition for that group.
For airway models of tracheal stenosis subjects (Fig. 4), particle size range with highest stenotic deposition (2.91%) in Subject 3 was 1–5μm (G4) particles released with 1m/s velocity at 25Pa inhalation pressure, follow by 40–70nm (G2) particles with 2.73% stenotic deposition (released with 1m/s velocity) and 1–5μm (G4) particles released with 3m/s (2.65% deposition), respectively. at 25Pa inhalation pressure (Fig. 4A). Interestingly, Subject 4 airway model had the best stenotic deposition for majority of the particle size ranges across all subjects, with 6–10μm particles (G5) released from spacer having 15.60% stenotic deposition at 40Pa inhalation pressure (Fig. 4B). In general, particles released from spacer with size range 6–10μm (G5) followed by 11–20μm (G6) had superior stenotic deposition in Subject 4 airway model regardless of simulated inhalation pressures.
FIGURE 4.
Stenotic deposition by particle size groups for subjects’ airway models with tracheal stenosis at varying inhalation pressures and particle velocities. (A) Subject 3; (B) Subject 4. Missing particle size group imply zero particle deposition for that group.
Deposition Distribution
Tables 2 & 3 shows localized particle deposition percent in the following anatomical regions: epiglottis, glottis, oral cavity, oropharynx, subglottis, and trachea, as well as those that passed through the trachea (outlet). With the only exception of particles released from spacer at 10Pa inhalation pressure in Subject 3 airway model where outlet had the most deposition, in all other simulated conditions (inhalation pressure and particle released characteristic) and subjects’ airway models, the anatomical region with highest particles deposition was the oral cavity. Between 36.64% and 65.63% of particles deposited in the oral cavity. In Subjects 1, 3 and 4, the anatomical region with the least deposition was the subglottis, with ≤0.25% deposition (except for particles released from spacer at 25 Pa inhalation pressure in Subject 4 airway model where epiglottis had the lowest deposition, 0.45%). In Subject 2 airway model, anatomical region with the least deposition alternated between the oropharynx and trachea, and between 0.43% and 3.62% deposition. Furthermore, spatial drug particle distribution in the airway (oral cavity to trachea) for airway models of subglottic stenotic subjects and tracheal stenotic subjects are shown in Figs. 5 and 6, respectively. In all subjects’ airway models and across all particle released conditions and inhalation pressures, the majority of particles that penetrated into the subglottis and trachea regions were particles less than 20 μm, while the larger particle sizes mostly remained in the oral cavity, followed by in the epiglottis and oropharynx.
Table 2.
(Airway Models for Subjects with Subglottic Stenosis)
| Subglottic Stenosis | SUBJECT 1 MODEL | SUBJECT 2 MODEL | ||||||
|---|---|---|---|---|---|---|---|---|
| Deposited Region | Deposition at 1mm Particle Released Velocity [@10Pa IP] [@25Pa IP] [@40Pa IP] (%) |
Deposition at 3mm Particle Released Velocity [@10Pa IP] [@25Pa IP] [@40Pa IP] (%) |
Deposition at 10mm Particle Released Velocity [@10Pa IP] [@25Pa IP] [@40Pa IP] (%) |
Deposition Particle Released from SPACER [@10Pa IP] [@25Pa IP] [@40Pa IP] (%) |
Deposition at 1mm Particle Released Velocity [@10Pa IP] [@25Pa IP] [@40Pa IP] (%) |
Deposition at 3mm Particle Released Velocity [@10Pa IP] [@25Pa IP] [@40Pa IP] (%) |
Deposition at 10mm Particle Released Velocity [@10Pa IP] [@25Pa IP] [@40Pa IP] (%) |
Deposition Particle Released from SPACER [@10Pa IP] [@25Pa IP] [@40Pa IP] (%) |
| Epiglottis | 8.63 5.50 5.34 |
7.87 5.28 5.10 |
4.52 3.81 3.91 |
4.71 3.95 3.76 |
7.35 8.11 7.06 |
4.80 5.65 5.88 |
1.47 1.32 2.36 |
9.74 6.81 6.44 |
| Glottis | 0.98 1.14 0.81 |
0.81 0.93 0.79 |
0.44 0.73 0.60 |
0.93 0.54 0.80 |
4.62 3.16 2.99 |
3.75 2.85 3.03 |
1.75 2.09 2.68 |
4.42 2.43 2.21 |
| Oral Cavity | 53.47 59.50 61.51 |
55.54 60.25 62.16 |
61.01 63.21 64.46 |
57.39 62.72 65.53 |
39.88 46.97 50.78 |
49.73 52.13 53.84 |
60.16 60.33 60.61 |
36.64 50.56 55.27 |
| Oropharynx | 1.32 1.01 1.01 |
0.82 0.95 0.87 |
0.57 0.71 0.69 |
0.87 1.49 1.26 |
5.56 3.45 3.98 |
1.40 1.75 2.60 |
0.43 0.76 1.54 |
7.34 3.92 4.36 |
| Outlet | 32.98 31.15 30.15 |
32.50 30.91 29.88 |
31.16 30.00 29.29 |
33.63 29.91 27.59 |
33.71 29.92 27.66 |
33.28 29.85 27.34 |
31.73 29.47 27.21 |
34.15 28.67 26.79 |
| Subglottis | 0.10 0.12 0.21 |
0.08 0.11 0.22 |
0.07 0.11 0.19 |
0.02 0.08 0.04 |
4.72 5.77 5.26 |
3.45 5.35 5.02 |
1.47 3.69 3.54 |
4.53 5.34 3.16 |
| Trachea | 0.77 0.76 0.57 |
0.60 0.74 0.55 |
0.46 0.62 0.43 |
0.81 0.69 0.56 |
3.62 2.38 2.06 |
3.09 2.18 2.03 |
2.46 2.10 1.86 |
2.82 2.02 1.51 |
Table 3.
(Airway Models for Subjects with Tracheal Stenosis)
| Tracheal Stenosis | SUBJECT 3 MODEL | SUBJECT 4 MODEL | ||||||
|---|---|---|---|---|---|---|---|---|
| Deposited Region | Deposition at 1mm Particle Released Velocity [@10Pa IP] [@25Pa IP] [@40Pa IP] (%) |
Deposition at 3mm Particle Released Velocity [@10Pa IP] [@25Pa IP] [@40Pa IP] (%) |
Deposition at 10mm Particle Released Velocity [@10Pa IP] [@25Pa IP] [@40Pa IP] (%) |
Deposition Particle Released from SPACER [@10Pa IP] [@25Pa IP] [@40Pa IP] (%) |
Deposition at 1mm Particle Released Velocity [@10Pa IP] [@25Pa IP] [@40Pa IP] (%) |
Deposition at 3mm Particle Released Velocity [@10Pa IP] [@25Pa IP] [@40Pa IP] (%) |
Deposition at 10mm Particle Released Velocity [@10Pa IP] [@25Pa IP] [@40Pa IP] (%) |
Deposition Particle Released from SPACER [@10Pa IP] [@25Pa IP] [@40Pa IP] (%) |
| Epiglottis | 11.74 12.37 11.08 |
8.05 8.86 9.11 |
2.78 3.96 4.95 |
24.88 17.29 13.02 |
1.41 1.38 1.57 |
1.10 1.08 1.41 |
0.62 0.74 1.07 |
0.95 0.45 1.33 |
| Glottis | 0.04 0.04 0.03 |
0.06 0.04 0.05 |
0.05 0.03 0.04 |
0.09 0.04 0.05 |
0.69 1.98 0.98 |
0.41 1.72 1.01 |
0.19 0.90 0.79 |
1.57 2.40 1.38 |
| Oral Cavity | 40.88 47.13 50.26 |
50.25 52.64 54.11 |
60.36 60.85 61.21 |
26.12 41.34 47.77 |
48.81 54.54 57.49 |
53.79 56.67 58.99 |
61.30 61.81 62.66 |
50.20 57.02 59.65 |
| Oropharynx | 9.75 7.33 7.47 |
4.87 5.66 5.69 |
1.84 3.07 3.57 |
11.31 8.23 8.25 |
8.20 6.13 5.32 |
5.79 5.21 4.58 |
1.99 2.95 2.95 |
2.38 1.26 1.33 |
| Outlet | 33.15 29.54 28.41 |
32.44 29.27 28.20 |
30.63 28.54 27.43 |
33.18 29.74 27.69 |
36.79 32.60 31.65 |
35.24 32.01 31.20 |
32.54 30.58 30.07 |
41.15 34.55 32.05 |
| Subglottis | 0.02 0.01 0.02 |
0.03 0.00 0.01 |
0.03 0.01 0.01 |
0.04 0.04 0.02 |
0.07 0.19 0.20 |
0.04 0.18 0.25 |
0.02 0.14 0.21 |
0.03 0.73 0.05 |
| Trachea | 0.41 1.00 0.64 |
0.33 0.91 0.68 |
0.36 0.92 0.62 |
0.37 0.61 0.60 |
1.16 1.16 1.53 |
0.76 1.15 1.26 |
0.44 0.85 0.98 |
1.61 2.20 3.45 |
FIGURE 5.

Spatial deposition pattern in the airway colored by particle size for subjects’ airway models with subglottic stenosis at varying inhalation pressures and particle velocities. (A) Subject 1; (B) Subject 2.
FIGURE 6.

Spatial deposition pattern in the airway colored by particle size for subjects’ airway models with tracheal stenosis at varying inhalation pressures and particle velocities. (A) Subject 3; (B) Subject 4.
DISCUSSION
Our findings suggest that at most 2.60% of inhaled micron-particles and nanoparticles deposited in the stenotic segment across all simulated inhalation pressures, particle velocities, with or without a spacer chamber. For airway models of subglottic stenotic subjects, stenotic deposition was between 0.06% and 2.48%, and between 0.10% and 2.60% for airway models of tracheal stenosis subjects. Although these findings suggest that only a tiny fraction of inhaled particles deposit at the stenosis, best stenotic deposition can be achieved with mild actuation of the inhaler (1m/s particle velocity) or with the use of a spacer chamber, but at varying inhalation pressures depending on anatomical site of stenosis.
In general, it is difficult to determine the precise particle size distribution that are emitted by MDIs.(34, 35) Nonetheless, LeBelle et al. (36) and Crim et al. (37) determined the range of particle sizes of MDIs as 1.1 – 4.7μm using a cascade impactor. LeBelle et al. (36) reported the mass median aerodynamic diameter (MMAD) and geometric standard deviation (σg) of four inhalers to lie between 2.28μm (σg=2.63) and 4.13μm (σg=2.19). Bouchikhi et al. (34) reported MMAD from nine inhalers to vary from 2.3μm (σg=1.8) to 8.3μm (σg=1.5), and the MMAD reported by Cheng et al. (38) from two products were 2.33μm (σg=1.79) and 2.21μm (σg=1.76). These ranges are in contrast to 0.05 – 35μm particle sizes reported for most Inhalers by Dolovich (39) and an upper limit of 200μm from two other systems.(39) In the present study, the particle size ranges with best stenotic deposition were 6 – 10μm (Subject 1), 11 – 20μm (Subject 2), 1 – 5μm (Subject 3), and 6 – 10μm (Subject 4). Our results imply that most of the particle sizes with the best likelihood for maximum stenotic deposition are not properly represented in the vast majority of MDIs.
The low rates of inhaled drug deposition at sites of stenosis raise questions about the potential benefit from current use of inhaled steroids for LTS patients. Although our findings are from a small sample, adjusting how a patient activates the inhaler, such as gentle activation, and adding a spacer may help improved particle deposition at stenotic sites. CFD modelling is an important technique that can further the understanding of inhaled drug delivery and aid in developing aerosolized administration of anti-inflammatory or antimicrobial agents to stenotic areas. To our knowledge, the only CFD studies to investigate LTS and drug delivery focused on the impact of stenotic obstruction on trachea-pulmonary drug delivery.(23, 24) In their tracheal stenotic model, Taherian and colleagues(23, 24) reported that 10μm particles had the largest stenotic deposition (≈ 5%) for 1.5 times tidal volume, and 1μm particles (≈ 5%) for tidal volume. These particles sizes are within the size ranges in the present study with highest tracheal stenotic deposition (Fig. 4); 1 – 5μm (2.91% deposition) in Subject 3 model, and 6 – 10μm (15.60% deposition) in Subject 4 model. In another study, Perkins et al. (40) looked at inhaled steroids on targeting vocal granulomas. Nonetheless, a few CFD studies have investigated the effects of LTS on airflow dynamics in the laryngotracheal airway.(41–46)
Limitations from the present study include [1] small sample size, thereby making it difficult to identify stenotic deposition trends across the different LTS types; [2] lack of gender diversity within each stenotic type, which can also be attributed to our small sample size; [3] the three inhalation pressures simulated were estimates based on a single subject study rather than from patient-specific respiratory measurements; and [4] our assumption involving steady state inhalation simulation is a simplification of current use instructions for MDIs.
In conclusion, this study used CFD modeling to simulate stenotic deposition from inhalers with and without a spacer chamber in four LTS subjects – two subglottic stenosis and two tracheal stenosis subjects. Our results indicate that no more than 2.60% of inhaled drug particles deposited at the stenosis and that the best particle size ranges with highest stenotic deposition may not represent typical particle sizes emitted by the vast majority of MDIs.
ACKNOWLEDGMENTS
Research reported in this publication was supported by the National Institute of Dental & Craniofacial Research of the National Institutes of Health under Award Number R01DE028554. The content is solely the responsibility of the authors and does not necessarily represent the official views of the National Institutes of Health. In addition, special thanks to ANSYS, ANSYS Global Academic Program, and Dr. Paolo Maccarini (Duke University) for support and strategic donation, as well as Casper Versteeg (Duke University) for help with generating Figures 5 & 6. All authors gave final approval for publication
FINANCIAL DISCLOSURE:
Research reported in this publication was supported by the National Institute of Dental & Craniofacial Research of the National Institutes of Health under Award
Footnotes
CONFLICT OF INTEREST: No conflict of interest
Level of Evidence: 3
REFERENCES
- 1.Maldonado F, Loiselle A, DePew ZS, Edell ES, Ekbom DC, Malinchoc M, Hagen CE, Alon E, Kasperbauer JL. Idiopathic subglottic stenosis: an evolving therapeutic algorithm. The Laryngoscope. 2014;124(2):498–503. [DOI] [PubMed] [Google Scholar]
- 2.Ashiku SK, Kuzucu A, Grillo HC, Wright CD, Wain JC, Lo B, Mathisen DJ. Idiopathic laryngotracheal stenosis: effective definitive treatment with laryngotracheal resection. The Journal of thoracic and cardiovascular surgery. 2004;127(1):99–107. [DOI] [PubMed] [Google Scholar]
- 3.Gelbard A, Francis DO, Sandulache VC, Simmons JC, Donovan DT, Ongkasuwan J. Causes and consequences of adult laryngotracheal stenosis. The Laryngoscope. 2015;125(5):1137–43. [DOI] [PMC free article] [PubMed] [Google Scholar]
- 4.Gelbard A, Francis DO, Sandulache VC, Simmons JC, Donovan DT, Ongkasuwan J. Causes and consequences of adult laryngotracheal stenosis. The Laryngoscope. 2015;125(5):1137–43. doi: 10.1002/lary.24956. [DOI] [PMC free article] [PubMed] [Google Scholar]
- 5.Bitar MA, Al Barazi R, Barakeh R. Airway reconstruction: review of an approach to the advanced-stage laryngotracheal stenosis. Braz J Otorhinolaryngol. 2016. doi: 10.1016/j.bjorl.2016.03.012. [DOI] [PMC free article] [PubMed] [Google Scholar]
- 6.Herrington HC, Weber SM, Andersen PE. Modern management of laryngotracheal stenosis. Laryngoscope. 2006;116(9):1553–7. doi: 10.1097/01.mlg.0000228006.21941.12. [DOI] [PubMed] [Google Scholar]
- 7.Hillel AT, Karatayli-Ozgursoy S, Benke JR, Best S, Pacheco-Lopez P, Teets K, Starmer H, Akst LM. Voice quality in laryngotracheal stenosis: impact of dilation and level of stenosis. Ann Otol Rhinol Laryngol. 2015;124(5):413–8. doi: 10.1177/0003489414564249. [DOI] [PubMed] [Google Scholar]
- 8.Hoffman GS, Thomas-Golbanov CK, Chan J, Akst LM, Eliachar I. Treatment of subglottic stenosis, due to Wegener’s granulomatosis, with intralesional corticosteroids and dilation. J Rheumatol. 2003;30(5):1017–21. [PubMed] [Google Scholar]
- 9.McCaffrey TV. Management of laryngotracheal stenosis on the basis of site and severity. Otolaryngology--head and neck surgery : official journal of American Academy of Otolaryngology-Head and Neck Surgery. 1993;109(3 Pt 1):468–73. doi: 10.1177/019459989310900313. [DOI] [PubMed] [Google Scholar]
- 10.Hseu AF, Benninger MS, Haffey TM, Lorenz R. Subglottic stenosis: a ten‐year review of treatment outcomes. The Laryngoscope. 2014;124(3):736–41. [DOI] [PubMed] [Google Scholar]
- 11.Sinacori JT, Taliercio SJ, Duong E, Benson C. Modalities of treatment for laryngotracheal stenosis: the EVMS experience. Laryngoscope. 2013;123(12):3131–6. doi: 10.1002/lary.24237. [DOI] [PubMed] [Google Scholar]
- 12.Gelbard A, Anderson C, Berry LD, Amin MR, Benninger MS, Blumin JH, Bock JM, Bryson PC, Castellanos PF, Chen S-C. Comparative Treatment Outcomes for Patients With Idiopathic Subglottic Stenosis. JAMA Otolaryngology–Head & Neck Surgery. 2019:1–10. [DOI] [PMC free article] [PubMed] [Google Scholar]
- 13.Frank-Ito DO, Kimbell JS, Borojeni AA, Garcia GJ, Rhee JS. A hierarchical stepwise approach to evaluate nasal patency after virtual surgery for nasal airway obstruction. Clinical Biomechanics. 2019;61:172–80. [DOI] [PMC free article] [PubMed] [Google Scholar]
- 14.Choi KJ, Jang DW, Ellison MD, Frank-Ito DO. Characterizing airflow profile in the postoperative maxillary sinus by using computational fluid dynamics modeling: A pilot study. Am J Rhinol Allergy. 2016;30(1):29–36. Epub 2016/02/13. doi: 10.2500/ajra.2016.30.4266. [DOI] [PubMed] [Google Scholar]
- 15.Frank-Ito DO, Sajisevi M, Solares CA, Jang DW. Modeling alterations in sinonasal physiology after skull base surgery. Am J Rhinol Allergy. 2015;29(2):145–50. Epub 2015/03/19. doi: 10.2500/ajra.2015.29.4150. [DOI] [PubMed] [Google Scholar]
- 16.Patki A, Frank-Ito DO. Characterizing human nasal airflow physiologic variables by nasal index. Respir Physiol Neurobiol. 2016;232:66–74. [DOI] [PubMed] [Google Scholar]
- 17.Frank-Ito DO, Carpenter DJ, Cheng T, Avashia YJ, Brown DA, Glener A, Allori A, Marcus JR. Computational Analysis of the Mature Unilateral Cleft Lip Nasal Deformity on Nasal Patency. Plastic and Reconstructive Surgery–Global Open. 2019;7(5):e2244. [DOI] [PMC free article] [PubMed] [Google Scholar]
- 18.Ramprasad VH, Frank-Ito DO. A computational analysis of nasal vestibule morphologic variabilities on nasal function. J Biomech. 2016;49(3):450–7. Epub 2016/02/03. doi: 10.1016/j.jbiomech.2016.01.009. [DOI] [PubMed] [Google Scholar]
- 19.AT Borojeni A, Frank‐Ito DO, Kimbell JS, Rhee JS, Garcia GJ. Creation of an idealized nasopharynx geometry for accurate computational fluid dynamics simulations of nasal airflow in patient‐specific models lacking the nasopharynx anatomy. International journal for numerical methods in biomedical engineering. 2017;33(5):e2825. [DOI] [PMC free article] [PubMed] [Google Scholar]
- 20.Frank-Ito DO, Schulz K, Vess G, Witsell DL. Changes in aerodynamics during vocal cord dysfunction. Comput Biol Med. 2014;57C:116–22. doi: 10.1016/j.compbiomed.2014.12.004. [DOI] [PubMed] [Google Scholar]
- 21.Frank-Ito DO, Wofford M, Schroeter JD, Kimbell JS. Influence of Mesh Density on Airflow and Particle Deposition in Sinonasal Airway Modeling. J Aerosol Med Pulm Drug Deliv. 2015. Epub 2015/06/13. doi: 10.1089/jamp.2014.1188. [DOI] [PMC free article] [PubMed] [Google Scholar]
- 22.Fluent A ANSYS Fluent Theory Guide, Release 19.0. Ansys. Inc; 2017. [Google Scholar]
- 23.Taherian S, Rahai H, Gomez BZ, Waddington T, Bonifacio JR, editors. Tracheal stenosis: a CFD approach for evaluation of drug delivery. ASME 2015 International Mechanical Engineering Congress and Exposition; 2015: American Society of Mechanical Engineers Digital Collection. [Google Scholar]
- 24.Taherian S, Rahai H, Bonifacio J, Gomez B, Waddington T. Particulate deposition in a patient with tracheal stenosis. Journal of Engineering and Science in Medical Diagnostics and Therapy. 2018;1(1):011005. [Google Scholar]
- 25.Menter FR. Two-equation eddy-viscosity turbulence models for engineering applications. AIAA journal. 1994;32(8):1598–605. [Google Scholar]
- 26.Menter FR. Review of the shear-stress transport turbulence model experience from an industrial perspective. International Journal of Computational Fluid Dynamics. 2009;23(4):305–16. [Google Scholar]
- 27.Kimbell JS, Basu S, Garcia GJ, Frank‐Ito DO, Lazarow F, Su E, Protsenko D, Chen Z, Rhee JS, Wong BJ. Upper airway reconstruction using long‐range optical coherence tomography: Effects of airway curvature on airflow resistance. Lasers Surg Med. 2019;51(2):150–60. [DOI] [PMC free article] [PubMed] [Google Scholar]
- 28.Ghalichi F, Deng X, De Champlain A, Douville Y, King M, Guidoin R. Low Reynolds number turbulence modeling of blood flow in arterial stenoses. Biorheology. 1998;35(4–5):281–94. [DOI] [PubMed] [Google Scholar]
- 29.Wilcox DC. Turbulence modeling for CFD: DCW industries La Canada, CA; 1998. [Google Scholar]
- 30.Basu S, Frank‐Ito DO, Kimbell JS. On computational fluid dynamics models for sinonasal drug transport: Relevance of nozzle subtraction and nasal vestibular dilation. International journal for numerical methods in biomedical engineering. 2018;34(4):e2946. [DOI] [PMC free article] [PubMed] [Google Scholar]
- 31.Dong J, Ma J, Shang Y, Inthavong K, Qiu D, Tu J, Frank-Ito D. Detailed nanoparticle exposure analysis among human nasal cavities with distinct vestibule phenotypes. Journal of Aerosol Science. 2018;121:54–65. [Google Scholar]
- 32.Saffman P The lift on a small sphere in a slow shear flow. Journal of fluid mechanics. 1965;22(2):385–400. [Google Scholar]
- 33.Li A, Ahmadi G. Dispersion and Deposition of Spherical Particles from Point Sources in the Turbulent Channel Flow. Aerosol Science and Technology. 1992;16:209–26. [Google Scholar]
- 34.Bouchikhi A, Becquemin M, Bignon J, Roy M, Teillac A. Particle size study of nine metered dose inhalers, and their deposition probabilities in the airways. Eur Respir J. 1988;1(6):547–52. [PubMed] [Google Scholar]
- 35.Morén F Pressurized aerosols for oral inhalation. Int J Pharm. 1981;8(1):1–10. [PubMed] [Google Scholar]
- 36.LeBelle M, Pike RK, Graham SJ, Ormsby ED, Bogard HA. Metered-dose inhalers I: drug content and particle size distribution of beclomethasone dipropionate. J Pharm Biomed Anal. 1996;14(7):793–800. [DOI] [PubMed] [Google Scholar]
- 37.Crim C, Holmes M, Lee B, Cavanaugh R, Lincourt W. Evaluation of particle size distribution of albuterol sulfate hydrofluoroalkane administered via metered-dose inhaler with and without valved holding chambers. Annals of Allergy, Asthma & Immunology. 2005;94(1):80–5. [DOI] [PubMed] [Google Scholar]
- 38.Cheng Y, Fu C, Yazzie D, Zhou Y. Respiratory deposition patterns of salbutamol pMDI with CFC and HFA-134a formulations in a human airway replica. J Aerosol Med. 2001;14(2):255–66. [DOI] [PubMed] [Google Scholar]
- 39.Dolovich M Measurement of particle size characteristics of metered dose inhaler (MDI) aerosols. J Aerosol Med. 1991;4(3):251–63. [DOI] [PubMed] [Google Scholar]
- 40.Perkins EL, Basu S, Garcia GJ, Buckmire RA, Shah RN, Kimbell JS. Ideal particle sizes for inhaled steroids targeting vocal granulomas: preliminary study using computational fluid dynamics. Otolaryngology–Head and Neck Surgery. 2018;158(3):511–9. [DOI] [PMC free article] [PubMed] [Google Scholar]
- 41.Cheng T, Carpenter D, Cohen S, Witsell D, Frank‐Ito DO. Investigating the effects of laryngotracheal stenosis on upper airway aerodynamics. The Laryngoscope. 2018;128(4):E141–E9. [DOI] [PMC free article] [PubMed] [Google Scholar]
- 42.Bates A, Cetto R, Doorly D, Schroter R, Tolley N, Comerford A. The effects of curvature and constriction on airflow and energy loss in pathological tracheas. Respir Physiol Neurobiol. 2016;234:69–78. [DOI] [PubMed] [Google Scholar]
- 43.Bates A, Comerford A, Cetto R, Schroter R, Tolley N, Doorly D. Power loss mechanisms in pathological tracheas. J Biomech. 2016;49(11):2187–92. [DOI] [PubMed] [Google Scholar]
- 44.Brouns M, Jayaraju ST, Lacor C, De Mey J, Noppen M, Vincken W, Verbanck S. Tracheal stenosis: a flow dynamics study. J Appl Physiol. 2007;102(3):1178–84. [DOI] [PubMed] [Google Scholar]
- 45.Poynot W Computational Aerodynamics and Anatomical Characterization of Laryngotracheal Stenosis in Children 2018.
- 46.Lin EL, Bock JM, Zdanski CJ, Kimbell JS, Garcia GJ. Relationship between degree of obstruction and airflow limitation in subglottic stenosis. The Laryngoscope. 2018;128(7):1551–7. [DOI] [PMC free article] [PubMed] [Google Scholar]