

Abstract
NLRP3 inflammasome was introduced as a double-edged sword in tumorigenesis and influenced immunotherapy response by modulating host immunity. However, a systematic assessment of the NLRP3-inflammasome-related genes across human cancers is lacking, and the predictive role of NLRP3 inflammasome in cancer immunotherapy (CIT) response remains unexplored. Thus, in this study, we performed a pan-cancer analysis of NLRP3-inflammasome-related genes across 24 human cancers. Out of these 24 cancers, 15 cancers had significantly different expression of NLRP3-inflammasome-related genes between normal and tumor samples. Meanwhile, Cox regression analysis showed that the NLRP3 inflammasome score could be served as an independent prognostic factor in skin cutaneous melanoma. Further analysis indicated that NLRP3 inflammasome may influence tumor immunity mainly by mediating tumor-infiltrating lymphocytes and macrophages, and the effect of NLRP3 inflammasome on immunity is diverse across tumor types in tumor microenvironment. We also found that the NLRP3 inflammasome score could be a stronger predictor for immune signatures compared with tumor mutation burden (TMB) and glycolytic activity, which have been reported as immune predictors. Furthermore, analysis of the association between NLRP3 inflammasome and CIT response using six CIT response datasets revealed the predictive value of NLRP3 inflammasome for immunotherapy response of patients in diverse cancers. Our study illustrates the characterization of NLRP3 inflammasome in multiple cancer types and highlights its potential value as a predictive biomarker of CIT response, which can pave the way for further investigation of the prognostic and therapeutic potentials of NLRP3 inflammasome.
Keywords: NLRP3 inflammasome, cancer immunotherapy, tumor immunity, tumor microenvironment, biomarker
Introduction
In the past few years, therapeutic advances in cancer immunotherapy (CIT) have rapidly emerged with effectiveness in treating various cancers by the interaction between the human immune system and cancer [1]. Despite the successful application of CIT across a broad range of human cancers, the majority of patients have limited or no response to these therapies [2]. Therefore, excavating a predictive biomarker to assess the response to these immunotherapy approaches for defining patient benefit early is a desperate need. Previous studies have discovered some indicators associated with CIT response such as tumor mutation burden (TMB) [3], eosinophilic count [4], PD-L1 expression [5], deep sequencing of T-cell receptor DNA [6] and glycolytic activity [7]. However, accurate biomarkers for predicting clinical outcome and CIT responses continue to be largely unexplored.
Recently, inflammation has been recognized for its roles in cancer initiation, development, progression, angiogenesis and invasion [8]. A central mechanism driving inflammation in immune cells is orchestrated by the inflammasome, a cytoplasmic multimeric protein complex that induces activation of the cysteine protease caspase-1, pyroptosis initiation with the subsequent cleaving of the pro-inflammatory cytokines interleukin (IL)-1β and proIL-18 to produce active forms [9]. Among inflammasomes, the NLRP3 inflammasome has been under comprehensive investigation revealing its possible involvement in several human diseases. The NLRP3 inflammasome is a critical component of the innate immune system in response to microbial infection and cellular damage as it mediates caspase-1 activation and promotes IL-1β and IL-18 secretion [10]. Evidence has been accrued on the role that the NLRP3 inflammasome are related to different malignancies [11]. They were introduced as double-edged swords towards cancer, which attributed to their different effects on immunity. For example, NLRP3 inflammasome protect against colorectal cancer (CRC) attributed to the effector function of caspase-1 to mediate secretion of IL-18 [12] and inhibit liver CRC metastatic growth by enhancing NK cell tumoricidal action [13]. However, NLRP3-dependent release of IL-1β induces immune cells, primarily CD4+ T cells, to express and release IL-22, which has been associated with aggressive growth of multiple cancers including breast, gastric, lung and skin cancers [14]. Considering the distinctive and complicated relationships between NLRP3 inflammasome and neoplasia, immunotherapy related to inflammasome in cancer has become a promising research field recently. A recent study pointed that the genetic and pharmacologic inhibition of NLRP3 significantly augmented the efficacy of anti–PD-1 antibody immunotherapy in melanoma [15]. Motao et al. revealed that Au4.5 nanoparticles could function as vaccine adjuvants to enhance antibody production by triggering NLRP3 inflammatory to mediate caspase-1 maturation and promotes IL-1β secretion [16]. These studies highlight the therapeutic potential of the NLRP3 inflammasome, and as a predictor for immunotherapy response. However, an investigation for the potential of the NLRP3 inflammasome to serve as a predictive biomarker of immunotherapy response in various cancer types remains unexplored. Thus, to the best of our knowledge, this is the first study that has carried out a pan-cancer analysis of the NLRP3 inflammasome across various cancer types and has explored the potential of the NLRP3 inflammasome as an indicator of immunotherapy response.
In this study, we represented a pan-cancer analysis of 30 NLRP3-inflammasome-related genes across 24 cancers using the Cancer Genome Atlas (TCGA) datasets and the Gene Expression Omnibus (GEO) datasets. Out of these 24 cancers, 15 cancers had significantly different expression of NLRP3-inflammasome-related genes between normal and tumor samples. The association of NLRP3 inflammasome with patient survival and tumor progression was explored for these 15 cancers. Subsequently, we investigated the association between NLRP3 inflammasome and immune signatures. We also explored the ability of NLRP3 inflammasome to predict tumor immunity compared with the signatures that has been reported. Furthermore, the association between NLRP3 inflammasome and tumor immunotherapy response using six CIT response datasets was unveiled. Our findings revealed a significant correlation between NLRP3 inflammasome score and patient survival in LIHC and skin cutaneous melanoma (SKCM), and NLRP3 inflammasome score could be served as an independent prognostic factor in SKCM. Our study preliminarily unveiled the potential application of the NLRP3 inflammasome as a predictive biomarker of immunotherapy response, which warrants further investigation.
Methods
Data and resources
Gene expression data and associated clinical data for 24 cancer types (Table S1) were downloaded from the Cancer Genome Atlas data portal (TCGA, http://cancergenome.nih.gov/). We downloaded RNA-Seq data expressed as transcripts per million (TPM) from TCGA database. R package ‘edgeR’ was utilized to normalize and process the data by using R version 3.6.3 software. Gene somatic mutations data were also downloaded for the analysis. The gene sets that represented different immune signatures from several publications were involved in our analyses, including HLA [17], TILs [18], immune cytolytic activity (CYT) [24], and interferon (IFN) response [24]. Homo sapiens NLRP3-inflammasome-related gene set was defined based on Gene Ontology (GO) (GO: 0044546, GO: 0072559) and Reactome (R-HSA-844456), which included 30 genes. These gene sets were presented in the Supplementary Table S2.
Microarray datasets including gene expression profiles of normal and tumor samples of GSE13507, GSE41258, GSE26886, GSE90604-GPL17692, GSE31056, GSE36895, GSE11151, GSE101728, GSE10072, GSE30219, GSE71729, GSE19422, GSE87211, GSE15605, GSE46517 and GSE63678 were employed from the Gene Expression Omnibus database (GEO, https://www.ncbi.nlm.nih.gov/geo/). Microarray datasets including gene expression profiles and corresponding clinical information data of GSE65904 downloaded from the GEO database were also involved in our study. We downloaded the immunotherapy response datasets from the GEO database (GSE111636, GSE19423, GSE67501, GSE26383 and GSE79691) and Miao et al. [19]. The list of these immunotherapy response datasets was displayed in Table S3.
Evaluation of NLRP3 inflammasome score
The NLRP3 inflammasome score was calculated based on the single-sample gene-set enrichment analysis (ssGSEA) [20] using the NLRP3-inflammasome-related gene set (Table S2) to quantify the expression levels of these genes for each cancer. We estimated the NLRP3 inflammasome score between tumor and normal samples in 24 cancers from the TCGA. Considering that there was only one normal sample in SKCM-TCGA dataset, we utilized the GSE15605 dataset for the comparison of the NLRP3 inflammasome score between tumor and normal samples. We defined a tumor as high group if its NLRP3 inflammasome score was in the upper half of all NLRP3 inflammasome scores in the same cancer type, and a tumor as low group if its NLRP3 inflammasome score was in the lower half.
Differential analysis of DNA methylation
DNA methylation profiles of patients were downloaded from TCGA project (https://portal.gdc.cancer.gov/). CpGs with more than 10% missing values were removed. The remaining missing values were imputed with the Bioconductor package impute. Then, a paired t-test was used to identify differentially methylated CpGs between the tumor and adjacent normal tissue. P-values were adjusted using the false discovery rate (FDR) method. The CpGs with an FDR less than 0.05 and an absolute value of the β difference greater than 0.2 were considered to be differentially methylated [21].
Survival analysis
We compared the overall survival (OS) and recurrence-free survival (RFS) of cancer patients separated by the median NLRP3 inflammasome score in each cancer type. Kaplan–Meier (K-M) curves were carried out to compare the survival time differences. P-values from log-rank tests were calculated, and less than 0.05 was considered statistically significant.
Evaluation of CD8+ T cells and CD4+ regulatory T cells infiltrations
To ensure the accuracy of our results, in this work, we utilized three methods to estimate the infiltration levels of CD8+ T cells and CD4+ regulatory T cells in diverse cancers. The first method, we employed ssGSEA to calculate CD8+ T cells and CD4+ regulatory T cells infiltration levels using CD8A (CD8+ T cells marker gene) and GPR1, FOXP3, CTLA4, IL32, C15orf53 and IL4 (CD4+ regulatory T cells marker genes), respectively. The second method is Tumor Immune Estimation Resource (TIMER, cistrome.shinyapps.io/timer), a web dedicated to comprehensively evaluate the abundances of tumor-infiltrating immune cells [22]. It overlaps 10 897 samples across 32 cancer types from TCGA database. The last method, we downloaded Thorsson et al. data [23] and used these data to compare the infiltrations of CD8+ T cells and CD4+ regulatory T cells in diverse cancers.
Evaluation of immune activity, tumor mutation burden (TMB) and immune-related signature enrichment in tumor
In order to assess tumor immune activity, we employed Estimation of STromal and Immune cells in MAlignant Tumours using Expression data (ESTIMATE), a method that yielded the immune score for each tumor sample that quantifies the immune activity (immune infiltration level) in that tumor sample based on the expression of immune genes [24]. For each tumor sample, we determined its TMB as the total count of somatic mutations (except silent mutations) detected in the tumor. Glycolysis score, an immune-related signature that has been reported by Zehang et al [7], was also evaluated in our study for each tumor sample using ssGSEA based on the glycolytic gene set [7] to compare the ability to predict immunity with the NLRP3 inflammasome.
Gene set enrichment analysis
To explore the potential biological functions of the NLRP3-inflammasome-related gene set between low and high groups in each cancer, we conducted Gene Set Enrichment Analysis (GSEA) based on the curated gene sets c2.cp.kegg.v7.0.symbols. Normalized P-value <0.05 was considered to be statistical significance.
Statistical analysis
The expression profiles of mRNAs from TCGA and GEO were shown as raw data, and each mRNA was normalized by log2 transformation for further analysis. The t-test P < 0.05 was utilized to determine the statistical significance. We calculated the correlation between two variables using the Spearman method. The threshold of P < 0.05 (Spearman’s correlation test) indicates the significance of correlation.
To compare the predictive power of different genomic features for immune signatures, time-dependent receiver-operating characteristic (ROC) curve analysis was performed by using SPSS version 19.0 software package. The tumors with high (upper half) versus low (lower half) immune signature scores were predicted.
We plotted ROC curves using the R package ‘survivalROC’, and the area under the ROC curve (AUC) was used to assess the prognostic performance of the NLRP3 inflammasome score. Statistical analysis was performed by using GraphPad Prism version 7.0 or SPSS version 19.0 software package. A two-tailed P < 0.05 was considered statistically significant.
Result
NLRP3-inflammasome-related genes differentially expressed between normal and tumor samples in 15 cancer types
We performed ssGSEA to calculate the NLRP3 inflammasome score for 24 cancers based on the gene expression data from TCGA to compare the NLRP3 inflammasome score between tumor and normal samples. These 24 cancers had significant difference in NLRP3 inflammasome score (ANOVA, P < 0.0001, Figure 1A). All cancers displayed a wide range of NLRP3 inflammasome score, and all have some individuals with high NLRP3 inflammasome score (Figure 1A). Kidney renal clear cell carcinoma (KIRC) has the highest levels of NLRP3 inflammasome score on average across all cancers, whereas kidney chromophobe (KICH) has the lowest (Figure 1A). Subsequently, we compared the NLRP3 inflammasome score between tumor and normal samples in these 24 cancers. Considering that there was only one normal sample in SKCM-TCGA dataset, here, we utilized 74 samples (16 normal samples and 58 tumor samples) from the GSE15605 dataset for this compared analysis. The results showed that out of these 24 cancers, 15 cancers had significantly different expression of NLRP3 inflammasome genes between normal and tumor samples (Figure 1B and C). Moreover, ESCA, GBM, HNSC, KIRC, KIRP and SKCM showed higher expression while BLCA, COAD, LIHC, LUAD, LUSC, PAAD, PCPG, READ and UCEC showed lower when compared to normal samples. In addition, the distribution of the 30 NLRP3-inflammasome-related gene expression levels of patients in these 15 cancers are shown in Figure 1D. Out of these 30 genes, we can find that APP, HSP90AB1, TXN and TXNIP have the significantly high expression in these cancer types (Figure 1D). These findings suggest that the NLRP3 inflammasome have distinctive relationships with diverse cancers in tumorigenesis, which is consistent with previous findings [11, 25].
Figure 1 .

Expression, alteration and methylation landscape of NLRP3-inflammasome-related genes in human cancer. (A) NLRP3 inflammasome score among all samples grouped by cancer. (B) Significant difference of NLRP3 inflammasome score between normal and tumor samples in 15 cancer types. P-values are based on the Mann–Whitney test. FDR-adjusted P-values are shown along the right. (C) Median value of NLRP3 inflammasome score in normal and tumor samples in 15 cancer types. (D) Heatmap showing the expression levels of NLRP3-inflammasome-related genes in 15 cancer types from the TCGA. (E) The number of NLRP3-inflammasome-related genes with differentially methylated CpGs located in the promoter regions in 15 cancer types from the TCGA. (F) The differentially methylated CpGs located in the promoter regions of NLRP3 in UCEC. (G) The number of differentially methylated CpGs located in the promoter regions of NLRP3 in 15 cancer types from the TCGA. (H) The differentially methylated CpGs located in the promoter regions of NLRP3 in LIHC.
NLRP3 was generally hypomethylated in 10 of 15 cancers
DNA methylation alteration has been observed in various cancers and is considered to be a cause of carcinogenesis [26]. To get a better understanding of the mechanism of the effect of NLRP3-inflammasome-related genes on tumorigenesis, we analyzed differentially methylated CpGs located in the promoter regions of NLRP3-inflammasome-related genes in these 15 cancers (|β value difference| > 0.2 and FDR < 0.05). We found that out of these 15 cancers, 3 cancers (GBM, PCPG and SKCM) had no differentially methylated CpGs of NLRP3-inflammasome-related genes. On the other hand, READ had the most numbers (16) of NLRP3-inflammasome-related genes whose promoter regions had differentially methylated CpGs (Figure 1I, Table S5). Moreover, we found that NLRP3 was generally differential methylated in 11 of 15 cancers among these 30 NLRP3-inflammasome-related genes, and NLRP3 was hypomethylated in 10 cancers (Table S5). However, in UCEC, there were both hypermethylated and hypomethylated CPGs in the promoter regions of NLRP3 (Figure 1J, Table S5). Additionally, LIHC had the most number of differentially methylated CPGs of NLRP3 compared with other 14 cancers, and all of these CPGs were hypomethylated (Figure 1K and L).
The expression of NLRP3-inflammasome-related genes is significantly associated with survival of LIHC and SKCM patients
To investigate the correlation between the expression of NLRP3-inflammasome-related genes and cancer survival, OS and RFS analysis were performed based on the NLRP3 inflammasome score. Patients were dichotomized into high and low groups, respectively, according to the median NLRP3 inflammasome score of each cancer (Table 1). Firstly, we utilized univariate Cox regression analysis to explore NLRP3-inflammasome-related gene with clinical relevance in each 15 cancer. We observed that LUAD had the greatest numbers of NLRP3-inflammasome-related genes associated with OS (Figure 2A). Meanwhile, KIRC had the greatest numbers of NLRP3-inflammasome-related genes associated with RFS (Figure 2B). Contrastively, only LUSC had no NLRP3-inflammasome-related genes associated with OS or RFS across 15 cancer types (Figure 2A and B, Table S1). Then, univariate Cox regression analysis based on NLRP3 inflammasome score showed that the expression of NLRP3-inflammasome-related genes was associated with OS in SKCM (HR = 0.547, 95%CI = 0.391–0.766, P = 0.0004) and was associated with RFS in LIHC (HR = 0.635, 95%CI = 0.435–0.926, P = 0.018) (Figure 2C and D). And the original data of LIHC results are shown in Table S6 as supplementary materials. K-M curves revealed that there was a significant difference in prognosis and poor survival between the high and low groups in LIHC and SKCM. Patients in low groups tended to have grim prognosis in LIHC (RFS: log-rank P = 0.0234, Figure 2E) and SKCM (log-rank P = 0.0029, Figure 2F).
Table 1.
The 15 cancer types analyzed
| Cancer Type | Full name | Sample size | ||
|---|---|---|---|---|
| Total tumors | High tumors | Low tumors | ||
| BLCA | Bladder Cancer | 382 | 192 | 192 |
| COAD | Colon Adenocarcinoma | 422 | 211 | 211 |
| ESCA | Esophageal Carcinoma | 149 | 74 | 75 |
| GBM | Glioblastoma Multiforme | 150 | 75 | 75 |
| HNSC | Head and Neck Squamous Cell Carcinoma | 470 | 235 | 235 |
| KIRC | Kidney Renal Clear Cell Carcinoma | 479 | 239 | 240 |
| KIRP | Kidney Renal Papillary Cell Carcinoma | 272 | 136 | 136 |
| LIHC | Hepatocellular Carcinoma | 357 | 178 | 179 |
| LUAD | Lung Adenocarcinoma | 472 | 236 | 236 |
| LUSC | Lung Squamous Cell Carcinoma | 475 | 237 | 238 |
| PAAD | Pancreatic Adenocarcinoma | 149 | 74 | 75 |
| PCPG | Pheochromocytoma and Paraganglioma | 174 | 87 | 87 |
| READ | Rectum Adenocarcinoma | 154 | 77 | 77 |
| SKCM | Skin Cutaneous Melanoma | 372 | 186 | 186 |
| UCEC | Uterine Corpus Endometrial Carcinoma | 512 | 256 | 256 |
Figure 2 .

Identification the association of NLRP3 inflammasome score with survival across 15 cancer types. The number of NLRP3-inflammasome-related genes with OS (A) and RFS (B) relevance in each 15 cancer type from the TCGA. NLRP3 inflammasome score association with OS (C) and RFS (D) in each tumor type from TCGA. (E) Kaplan–Meier curves of RFS of low and high groups stratified by the NLRP3 inflammasome score in LIHC. (F) Kaplan–Meier curves of OS of low and high groups stratified by the NLRP3 inflammasome score in SKCM. (G) The distribution of patient recurrence-free status, risk scores and AJCC TNM staging status for LIHC. (H) The distribution of patient survival status, risk scores and AJCC TNM staging status for SKCM. Pie charts showing the Chi-squared test of clinicopathologic factors for low and high groups in LIHC (I) and SKCM (J) tumor samples from the TCGA.
Obviously, the risk of patient mortality decreased and the TNM staging gradually descended as the NLRP3 inflammasome score increased in LIHC and SKCM (Figure 2G and H). The chi-squared test showed that the high score group showed significantly better T (P = 0.0475, Figure 2I), N (P = 0.0475, Figure 2I) and stage (P = 0.0253, Figure 2I) than the low score group in LIHC. For SKCM, the high group showed significantly better stage (P = 0.0116, Figure 2J) than the low group. These results suggested that highly malignant LIHC and SKCM were associated with low NLRP3 inflammasome score and our NLRP3 inflammasome score had potential to add additional prognostic value of the classically prognostic predictors and assist in predicting prognosis in LIHC and SKCM.
The expression of NLRP3-inflammasome-related genes is an independent prognostic factor in SKCM patients
Next, univariate and multivariate Cox regression analysis was carried out to analyze whether the expression of NLRP3-inflammasome-related genes can be an independent prognostic factor for patients in LIHC and SKCM. The NLRP3 inflammasome score and other clinicopathological factors were used as covariates. The results indicated that stage T (Multivariate Cox: HR = 2.133, 95% CI = 1.384–3.284; P = 0.001) was significantly associated with the RFS of LIHC patients and could be seemed as independent RFS prognostic factor for LIHC patients in TCGA (Figure 3A and B). However, the NLRP3 inflammasome score was not (multivariate Cox: HR = 0.755, 95% CI = 0.479–1.187; P = 0.224, Figure 3A and B). As shown in new Figure 3C and D, race (Multivariate Cox: HR = 3.188, 95% CI = 1.326–7.667; P = 0.009) and T (multivariate Cox: HR = 1.736, 95% CI = 1.205–2.503; P = 0.003) were independent adverse OS indicators for SKCM patients. Meanwhile, the NLRP3 inflammasome score (multivariate Cox: HR = 0.612, 95% CI = 0.419–0.895; P = 0.011) was an independent positive OS predictor for SKCM patients.
Figure 3 .

The NLRP3 inflammasome score is an independent prognostic factor in SKCM patients. Univariate (A) and multivariate (B) Cox regression of prognosis factor for RFS of LIHC patients. Univariate (C) and multivariate (D) Cox regression of prognosis factor for OS of SKCM patients. (E) Kaplan–Meier analysis of OS for SKCM patients stratified by AJCC T, N, M and stage.
To further investigate the clinical potentiality of the NLRP3 inflammasome score in SKCM, stratified analysis based on these clinical characteristics was implemented. The results indicated that the NLRP3 inflammasome score seemed more applicable to predict OS of SKCM patients in subgroup of T1 and T2, N1, N2 and N3, M0 and stage 0, stage I and stage II (Figure 3E). Patients in low groups had significantly poorer clinical outcomes than those in high groups.
The validation in GEO database
To validate the difference of NLRP3 inflammasome score between normal and tumor samples, we applied ssGSEA to calculate the NLRP3 inflammasome score in GEO database. A wide range of NLRP3 inflammasome scores in 15 cancers were displayed in Figure 4A. As shown in Figure 4B and C, 14 cancers exhibited significant difference of NLRP3-inflammasome-related genes expression between normal and tumor samples excluding PAAD data (FDR = 0.8567, Figure 4B). The original data of these results are shown in Table S7 as supplementary materials.
Figure 4 .

The validation in GEO database. (A) NLRP3 inflammasome score among all samples grouped by cancer from GEO datasets. (B) Significant difference of NLRP3 inflammasome score between normal and tumor samples in 15 cancer types from GEO datasets. P-values are based on the Mann–Whitney test. FDR-adjusted p-values are shown along the right. (C) Median value of NLRP3 inflammasome score in normal and tumor samples in 15 cancer types from GEO datasets. (D) Kaplan–Meier curves of OS of low and high groups stratified by the NLRP3 inflammasome score in SKCM-GSE65904. (E) The distribution of patient survival status, risk scores and stage status for SKCM in GSE65904.
To validate the predictive value of the NLRP3 inflammasome score for OS in SKCM, we applied ssGSEA to GSE65904 dataset. Then, 210 patients were divided into low and high groups according to the cut-off value of 0.634 as the median value of NLRP3 inflammasome score. As shown in Figure 4D, K–M curves displayed great utility in predicting OS with P-value of 0.0056. We observed that a low NLRP3 inflammasome score was correlated with poor OS in SKCM. The distribution of scores, status and stage of 210 SKCM patients are shown that the risk of patient mortality decreased and stage go better as the NLRP3 inflammasome score increased, suggesting that highly malignant SKCM is associated with low NLRP3 inflammasome score (Figure 4E). These results were completely consistent with our previous findings, which indicated that the NLRP3 inflammasome score can be seemed as a good indicator for prognosis and survival in SKCM.
NLRP3 inflammasome score significantly correlate with TILs in various cancers in 15 cancer types
To explore the correlation between tumor NLRP3 inflammasome and tumor immunity, we involved diverse immune signatures, including immune CYT, HLA expression, IFN response and TILs infiltration. Strikingly, we found that NLRP3 inflammasome score highly correlated with these immune signatures in 15 cancers. Particularly, TILs infiltration had the highest degree of correlation with tumor NLRP3 inflammasome among these four immune signatures in 12 cancers (Figure 5A, Table S8). Besides the NLRP3 inflammasome scores, we found a number of NLRP3-inflammasome-related genes’ expression was also significantly associated with immune signatures in 15 cancers (Figure 5B, Table S9). GBP5, CASP1, NLRP3 and PSTPIP1 showed significantly positive association with all of these immune signatures in 15 cancers. In contrast, ATAT1 displayed significantly negative association with all of these immune signatures in 14 cancers except for ESCA (Figure 5B). Previous studies have implicated that NLRP3 inflammasome usually affects immune system by mediating caspase-1 activation and IL-1β and IL-18 secretion [10]. Therefore, here we also investigated the relationship between the NLRP3 inflammasome score and the expression levels of IL-1β and IL-18. In consistent with previous studies, we observed that the NLRP3 inflammasome score was significantly positively correlated with the expression levels of IL-1β in all 15 cancers and IL-18 in 12 cancers except for ESCA, KIRP and PAAD (Figure 5C). These data also suggest that our analysis using the gene set score is reasonable.
Figure 5 .
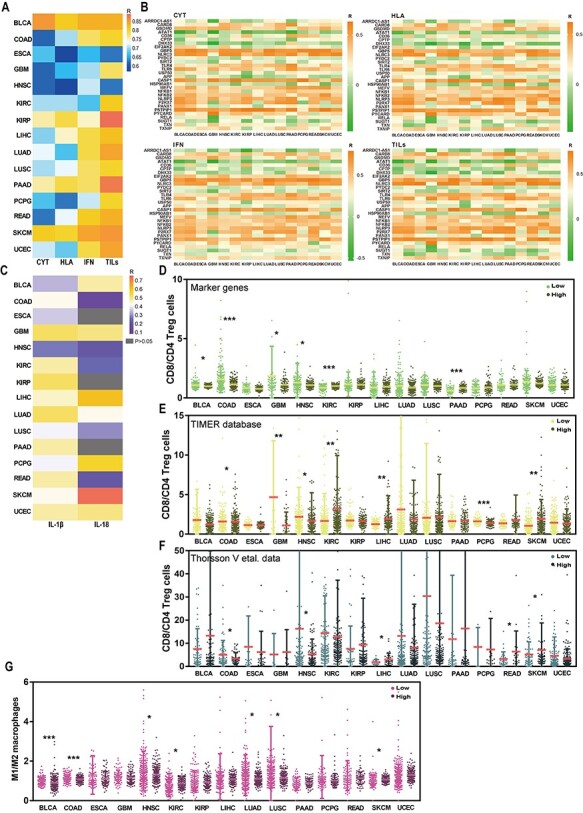
Tumor NLRP3 inflammasome score has the highest degree of correlation with TILs. (A) The correlation of NLRP3 inflammasome score with diverse immune signatures including immune cytolytic activity (CYT), HLA, interferon (IFN) and TILs in 15 cancer types from the TCGA. R: Spearman’s correlation coefficient. (B) The association of the expression levels of NLRP3-inflammasome-related genes with diverse immune signatures including CYT, HLA, IFN and TILs in 15 cancer types from the TCGA. R: Spearman’s correlation coefficient. (C) The correlation of NLRP3 inflammasome score with the expression levels of IL-1β and IL-18 in 15 cancer types from the TCGA. The ratios between the expression levels of CD8+ T cells signatures and the expression levels of CD4+ regulatory T cells signatures in low and high groups stratified by the NLRP3 inflammasome score in 15 cancer types from the TCGA using marker genes’ expression analysis (D), TIMER database (E) and Thorsson et al. data (F). (G) The ratios between the expression levels of M1 macrophages signatures and the expression levels of M2 macrophages signatures in low and high groups stratified by the NLRP3 inflammasome score in 15 cancer types from the TCGA.
Considering the highest degree of correlation of TILs infiltration with NLRP3 inflammasome score, we then evaluated the levels of CD8+ T cells (marker gene CD8A) and CD4+ regulatory T cells (marker genes GPR1, FOXP3, CTLA4, IL32, C15orf53 and IL4) in high- and low score groups in each 15 cancer using marker genes’ expression analysis, TIMER database and Thorsson et al. data. We noticed that the consistent results from marker genes’ analysis (Figure 5D), TIMER database (Figure 5E) and Thorsson et al. data (Figure 5F) were that COAD and HNSC had higher ratio between CD8+ T cells (immune-stimulatory cells) and CD4+ regulatory T cells (immune-inhibitory cells) in low score groups compared with high score groups (Mann–Whitney U test, P < 0.05, Figure 5D–F). Subsequently, the estimation of the ratio between inflammation-inducing M1 macrophages (CD64, IDO, SOCS1 and CXCL10) and inflammation-inhibiting M2 macrophages (MRC1, TGM2, CD23 and CCL22) unveiled that five cancers (BLCA, COAD, HNSC, LUAD and LUSC) had a significant decrease of the ratio in high versus low groups, whereas two cancers (KIRC and SKCM) showed higher ratio in high groups (Mann–Whitney U test, P < 0.05, Figure 5G). These results suggest that NLRP3 inflammasome may influence tumor immunity mainly by mediating TILs and macrophages, and the effect of NLRP3 inflammasome on immunity is diverse across tumor types in tumor microenvironment.
NLRP3 inflammasome score is a stronger predictor for immune signatures in 15 cancer types
Given our previous findings, we can observe the significant correlation between NLRP3 inflammasome and tumor immunity. To determine whether NLRP3 inflammasome score can predict tumor immunity, we used ROC curves analysis to evaluate the contribution of NLRP3 inflammasome score in predicting two immune signatures (immune score and immune CYT). Patients were defined into high and low groups based on the median immune signature scores in each cancer. TMB [27] and glycolytic activity [7] have been demonstrated to have predictive ability for immune signatures. To compare the predictive ability to tumor immunity, we involved TMB and glycolytic signature into this analysis.
We identified that NLRP3 inflammasome score has high potential as a predictor of immune score in all of 15 cancers. Glycolytic activity presented moderate potential for predicting immune score in three cancer types (GBM, PAAD and PCPG), and TMB displayed low potential as an indicator of immune score in all of 15 cancers (Figure 6A, Table S10). Moreover, for CYT, NLRP3 inflammasome score represented high potential as an indicator of immune score in all 12 cancers and moderate potential in all three cancers (COAD, GBM and READ), as compared to glycolytic activity being a predictor with moderate potential in three cancers (GBM and PCPG) and TMB being a predictor with low potential in all 15 cancers (Figure 6B, Table S10). These results suggest that NLRP3 inflammasome score is a stronger predictor than glycolytic activity and TMB for immune signatures.
Figure 6 .

NLRP3 inflammasome score shows stronger predictive ability for immune signatures in 15 cancer types. Comparison of predictive ability of NLRP3 inflammasome score, glycolytic activity and TMB for immune score (A) and immune CYT (B) using ROC curves analysis. (C) Enriched Kyoto Encyclopedia of Genes and Genomes (KEGG) pathways of the NLRP3-inflammasome-related genes in 15 cancer types.
To investigate the underlying mechanism of the NLRP3 inflammasome score in predicting immune activity, we compared the gene expression profiles between high and low NLRP3 score groups, and identified the KEGG pathways that were enriched in the respective groups in each of the 15 cancer types by GSEA. We can find that the immune-associated pathways that upregulated in high groups in all 15 cancers, such as antigen processing and presentation, chemokine signaling pathway and cytokine–cytokine receptor interaction (data with blue backgrounds in Figure 6C, Table S11). Altogether, these data indicate that some of these pathways may play key roles in connecting tumor NLRP3 inflammasome with tumor immunity in these cancers.
NLRP3 inflammasome score has the potential to predict immunotherapy response
Given the association between NLRP3 inflammasome and tumor immunity, we investigated whether NLRP3 inflammasome also correlated with immunotherapy response. We firstly calculated checkpoint scores using the expression levels of immune checkpoint genes (the list of genes showed in Table S2) for each patient by ssGSEA algorithm and measured the association between NLRP3 inflammasome and checkpoint scores. Strikingly, we observed that NLRP3 inflammasome was significantly positively correlated with immune checkpoint genes in all 15 cancers (Figure 7A). The expression patterns of immune checkpoint genes were further compared between the high and low groups stratified by NLRP3 inflammasome scores. And this analysis in all 15 cancers revealed that patients with high NLRP3 inflammasome score exhibited significantly higher expression levels of immune checkpoint genes compared with those in the low groups (Figure 7B).
Figure 7 .

NLRP3 inflammasome score is a potential predictor for immunotherapy response in multiple cancers. (A) The correlation of NLRP3 inflammasome score with the expression levels of checkpoint genes in 15 cancer types from the TCGA. R: Spearman’s correlation coefficient. (B) The expression levels of checkpoint genes among all samples grouped by cancer from the TCGA. (C) The response rate to immunotherapy in low and high groups stratified by NLRP3 inflammasome score in each dataset. (D) The distribution of the NLRP3 inflammasome score among samples grouped by response to immunotherapy in each dataset. (E) Kaplan–Meier curves of OS between low and high groups stratified by the NLRP3 inflammasome score in each immunotherapy dataset. (F) ROC curves of NLRP3 inflammasome score in predicting immunotherapy response.
These observed associations between NLRP3 inflammasome score and immune checkpoint genes let us to hypothesize that the NLRP3 inflammasome score may correlate with the response to immunotherapy. To test this hypothesis, we investigated the correlation between NLRP3 inflammasome and tumor immunotherapy response using six CIT response associated datasets (GSE111636, GSE19423, GSE67501, GSE26383, GSE79691 and Miao et al. [19]). We found that the immunotherapy response rate was higher in high NLRP3 inflammasome score groups versus low groups in BLCA, RCC and KIRC (Figure 7C). However, in SKCM, patients in high NLRP3 inflammasome score groups had lower immunotherapy response rate compared with those in low groups (Figure 7C). Subsequently, we also observed that patients with response to immunotherapy had higher NLRP3 inflammasome scores than patients with no response in BLCA and KIRC (P = 0.1237 for BLCA-GSE111636, P = 0.0443 for BLCA-GSE19423, P = 0.0584 for RCC-GSE67501, P = 0.0264 for KIRC, Figure 7D), but patients with response to immunotherapy had lower NLRP3 inflammasome scores than patients with no response in SKCM (P = 0.0220 for SKCM-GSE26383, P = 0.1199 for GSE79691, Figure 7D). We further analyzed the clinical data and found that the NLRP3 inflammasome score had moderately positive correlation with survival prognosis in BLCA and RCC (P = 0.0636 for BLCA-GSE19423, P = 0.1814 for RCC-GSE67501, Figure 7E). In KIRC, NLRP3 inflammasome score showed a moderately positive correlation with survival prognosis (P = 0.0426 for KIRC, Figure 7E). Furthermore, the NLRP3 inflammasome score achieved AUC of 0.608, 0.741 and 0.771 for BLCA-GSE19423, RCC-GSE67501 and KIRC, respectively, in predicting the response to CIT, suggesting moderate potential of the NLRP3 inflammasome score as an indicator of CIT response monitoring (Figure 7F). Above all, these data indicate that the NLRP3 inflammasome is associated with immunotherapy response and can be a potential biomarker for immunotherapy response.
Discussion
A large body of evidence has suggested that the NLRP3 inflammasome is associated with tumor progression, prognosis and treatment response [28, 29]. On the other hand, there is evidence that NLRP3 has a critical role in protecting against tumorigenesis by modulating host immunity [11]. Thus, we can recognize the NLRP3 inflammasome as double-edged swords towards cancer, suggesting that it can prevent cancer occurrence or in the completely opposite way to promote tumor development in certain types of cancer. Thus, considering the attractive role of the NLRP3 inflammasome in tumorigenesis and tumor development, it can be highly significant to investigate the NLRP3 inflammasome in different types of cancer. However, there has been no pan-cancer analysis for the role of the NLRP3 inflammasome in different cancers. Therefore, in our study, we comprehensively analyzed the 30 NLRP3-inflammasome-related genes across multiple cancers in multiple datasets.
In the present study, we displayed the expression landscape of these 30 NLRP3-inflammasome-related genes in tumor samples and normal samples of 24 cancers. We found that the expression of these genes was significantly different between tumor and normal samples in 15 cancers. Due to the tissue- or cell- dependent role of NLRP3 inflammasome in tumorigenesis, there were discrepancy in the expression levels of NLRP3-inflammasome-related genes in diverse cancers [25, 30]. Some cancers showed higher expression while others showed lower when compared to normal samples. In our study, ESCA, GBM, HNSC, KIRC, KIRP and SKCM showed higher expression while BLCA, COAD, LIHC, LUAD, LUSC, PAAD, PCPG, READ and UCEC showed lower expression when compared to normal samples. Previous studies indicated that the expression of NLRP3-inflammasome-related genes is highly expressed in HNSC [31, 32] and SKCM [33] tissues compared with normal tissues. On the other hand, the NLRP3 inflammasome is overexpressed in normal tissues versus COAD [30] and LIHC [34] tissues. These findings were consistent with our results.
Evidence has accrued that genetic alterations of genes encoding inflammasome components often confer susceptibilities to cancers [35, 36]. Thus, to comprehensively understand the NLRP3-inflammasome-related genes’ molecular characteristics, we further investigate the alterations of these genes utilizing cBioPortal database. We found that SKCM showed the highest alteration rate compared with other cancers. There was evidence that NLRP3 variant was a risk allele for melanoma [36], which might supply forceful evidence for our findings. Among these alterations, we also observed amplification as the most commonly occurring type of alteration, whereas fusion was the rarest. This finding may provide a new insight into genetic alterations analysis of the NLRP3-inflammasome-related genes. Subsequently, the results of differentially methylated CpGs analysis illustrated that NLRP3 was generally differential methylated in 11 of 15 cancers among these 30 NLRP3-inflammasome-related genes, and NLRP3 was hypomethylated in 10 cancers. However, in UCEC, there were both hypermethylated and hypomethylated CPGs in the promoter regions of NLRP3. Additionally, LIHC had the most numbers of differentially methylated CPGs of NLRP3 compared with other 14 cancers, and all of these CPGs were hypomethylated. There was no research about the methylation of NLRP3 in cancers. Therefore, our findings can offer a foundation for subsequent, in-depth NLRP3 methylation-related work with great promise for uncovering mechanisms of NLRP3 inflammasome in tumorigenesis and development. In order to further elucidate the role of the NLRP3 inflammasome in clinical risk stratification, the association of the NLRP3 inflammasome and survival in 15 cancers was assessed. When applied to TCGA datasets, univariate Cox regression analysis indicated that the NLRP3 inflammasome score showed significant association with OS of SKCM patients and DFS of LIHC patients. After adjusting for traditional clinical factors, the NLRP3 inflammasome remained an independent prognostic factor for OS of SKCM patients. Furthermore, these findings were validated using GEO datasets.
Given NLRP3 inflammasome as a critical component of the innate immune system in response to microbial infection and cellular damage, we further systematically analyzed the correlation between NLRP3 inflammasome and tumor immunity. Diverse immune signatures, including immune CYT, HLA expression, IFN response and TILs infiltration, were involved in the analysis, and we observed that the NLRP3 inflammasome highly correlated with these immune signatures in 15 cancers. Particularly, TILs infiltration had the most consistent correlation with NLRP3 inflammasome among these four immune signatures, suggesting NLRP3 inflammasome may influence tumor immunity mainly by mediating TILs. The NLRP3 inflammasome exhibits a critical role in tumorigenesis and tumor development as it mediates caspase-1 activation and promotes IL-1β and IL-18 secretion [10, 12, 14]. Therefore, we also analyzed the association between the NLRP3 inflammasome score and the expression levels of IL-1β and IL-18. In consistent with prior studies, we observed that the NLRP3 inflammasome score was significantly positively correlated with the expression levels of IL-1β and IL-18 in most of 15 cancers. These data also suggest that our analysis using the gene set score is reasonable. Considering our findings that TILs infiltration had the highest correlation with tumor NLRP3 inflammasome among these four immune signatures, CD8+ T cells and CD4+ regulatory T cells were evaluated. We noticed that COAD and HNSC had higher ratio between CD8+ T cells and CD4+ regulatory T cells in low score groups compared with high score groups. Prior evidence revealed that NLRP3 signaling drove immuno-suppressive CD4+ T cell polarization in the TME of PAAD via IL-1β [37]. In addition, NLRP3-dependent release of IL-1β causes immune cells, primarily CD4+ T cells, to express and release IL-22, which has been associated with aggressive growth in lung, breast, gastric and skin cancers [14]. This research was consistent with our findings and may provide support for our results. Besides, the estimation of the ratio between inflammation-inducing M1 macrophages and inflammation-inhibiting M2 macrophages unveiled that five cancers (BLCA, COAD, HNSC, LUAD and LUSC) had a significant decrease of the ratio in in high versus low groups, whereas two cancers (KIRC and SKCM) showed higher ratio in high groups. These results indicate that NLRP3 inflammasome score significantly correlate with TILs, and the outcome of NLRP3 inflammasome signaling on immunity are diverse across tumor types in TME.
Moreover, in comparison with TMB [27] and glycolytic activity [7], which were reported as predictive indicators for immune signatures, NLRP3 inflammasome exhibited a stronger predictor for immune signatures in these 15 cancers. GSEA analysis exhibited that the immune-associated pathways that upregulated in high groups in all 15 cancers, such as antigen processing and presentation, chemokine signaling pathway and cytokine–cytokine receptor interaction. Prior studies have revealed that the NLRP3 inflammasome mediated caspase-1 activation and promotes IL-1β and IL-18 secretion to effect tumor occurrence and development [10, 12, 14]. NLRP3 inflammasome was proved to influence maturation of NK cells by producing IL-18 to affect melanoma or colon carcinoma metastasis [13, 38]. These data indicate that some of these pathways may play key roles in connecting tumor NLRP3 inflammasome with tumor immunity in these cancers.
CIT have opened up a new path for cancer therapy, although only a limited fraction of treated patients exhibit clinical responses, thereby providing a critical need for the identification of predictive biomarkers. The expression of immune checkpoint genes such as PD-1, PD-L1 and CTL-4 has been reported as predictive biomarkers for CIT response [39, 40]. When examining the relationship between the expression of checkpoint genes and the NLRP3 inflammasome, we surprisingly found that the NLRP3 inflammasome exhibited significant associations with checkpoint genes’ expression. These findings give a hint to us that the NLRP3 inflammasome may be associated with patients’ immunotherapy response. There was a research revealed that Au4.5 nanoparticles could function as vaccine adjuvants to enhance antibody production by triggering NLRP3 inflammatory to mediate caspase-1 maturation and promotes IL-1β secretion [16]. This study provides a hint of the potential of the NLRP3 inflammasome as a predictive indicator of immunotherapy response. Therefore, the predictive value of the NLRP3 inflammasome was tested in six immunotherapy datasets. In BLCA and KIRC, the immunotherapy response rate was higher in high NLRP3 inflammasome score groups versus low groups. Interestingly, as for SKCM, the immunotherapy response rate was higher in low NLRP3 inflammasome score groups versus high groups. These discrepant correlations of NLRP3 inflammasome with immunotherapy response rate between diverse cancer types could be attributed to the outcome of NLRP3 inflammasome signaling on immunity are diverse across tumor types in TME. There is evidence that the NLRP3 inflammasome drives resistance to anti-PD-1 immunotherapy [15]. This study is consistent with our findings that high NLRP3 inflammasome is correlated with low immunotherapy response rate. However, in our previous findings, we can find that the NLRP3 inflammasome score had a negative correlation with overall survival prognosis in BLCA, KIRC and KIRP when we analyzed the TCGA datasets in which the tumor patients were not treated with immunotherapy (Figure 2C). The discrepant correlations of NLRP3 inflammasome score with survival between the patients treated with immunotherapy and the patients without could be attributed to the higher immunotherapy response rate in tumors with high NLRP3 inflammasome score relative to tumors with low NLRP3 inflammasome score. Moreover, the NLRP3 inflammasome was not only shown to have the ability to distinguish responders from non-responders but also have prognostic value for CIT-treated patients. The NLRP3 inflammasome showed satisfactory predictive performance for immunotherapy response with the AUC of 0.608 (in BLCA), 0.741 (in RCC) and 0.771 (in KIRC). Altogether, these results suggested that the NLRP3 inflammasome could be a potential biomarker for immunotherapy response. Of course, the association between NLRP3 inflammasome and immunotherapy response revealed in this study needs to be validated clinically.
Conclusion
In conclusion, our comprehensive pan-cancer analysis of NLRP3 inflammasome illustrates the characterization of NLRP3 inflammasome in multiple cancer types. Our data suggest that NLRP3 inflammasome score can be served as an independent prognostic factor in SKCM. Further analysis indicated that NLRP3 inflammasome may influence tumor immunity mainly by mediating TILs and macrophages, and the effect of NLRP3 inflammasome on immunity is diverse across tumor types in tumor microenvironment. Furthermore, we find that the NLRP3 inflammasome score can be a potential biomarker for CIT response in multiple cancers. To the best of our knowledge, this is the first study to comprehensively analyze the NLRP3 inflammasome in pan-cancer, highlighting the impact of NLRP3 inflammasome on immune response, potentially enabling more precise and personalized CIT in the future.
Key Points
Pan-Cancer Analysis of NLRP3-inflammasome-related genes indicated that 15 cancers had significantly different expression of these genes between normal and tumor samples.
The NLRP3 inflammasome score could be served as an independent prognostic factor in SKCM.
NLRP3 inflammasome may influence tumor immunity mainly by mediating TILs and macrophages, and the effect of NLRP3 inflammasome on immunity is diverse across tumor types in tumor microenvironment.
The inflammasome score could be a stronger predictor for immune signatures compared with TMB and glycolytic activity, which have been reported as immune predictors.
Our study illustrates the characterization of NLRP3 inflammasome in multiple cancer types and highlights its potential value as a predictive biomarker of CIT response, which can pave the way for further investigation of the prognostic and therapeutic potentials of NLRP3 inflammasome.
Supplementary Material
Acknowledgments
The authors would like to thank TCGA and GEO projects for the data access.
Mingyi Ju is a graduate student in China Medical University, Liaoning, China.
Jia Bi is a Doc Research Fellow at China Medical University, Liaoning, China.
Qian Wei is a Post Doc Research Fellow at China Medical University, Liaoning, China.
Longyang Jiang is a Post Doc Research Fellow at China Medical University, Liaoning, China.
Qiutong Guan is a PhD student at China Medical University, Liaoning, China.
Ming Zhang is a PhD student at China Medical University, Liaoning, China.
Xinyue Song is a PhD student at China Medical University, Liaoning, China.
Ting Chen is a PhD student at China Medical University, Liaoning, China.
Jingyi Fan is a graduate student in China Medical University, Liaoning, China.
Xiaojuan Li is a graduate student in China Medical University, Liaoning, China.
Lin Zhao, PhD, Department of Pharmacology, School of Pharmacy, China Medical University, No.77 Puhe Road, Shenyang North New Area, Shenyang City, 110122, Liaoning, China.
Contributor Information
Mingyi Ju, China Medical University, Liaoning, China.
Jia Bi, China Medical University, Liaoning, China.
Qian Wei, China Medical University, Liaoning, China.
Longyang Jiang, China Medical University, Liaoning, China.
Qiutong Guan, China Medical University, Liaoning, China.
Ming Zhang, China Medical University, Liaoning, China.
Xinyue Song, China Medical University, Liaoning, China.
Ting Chen, China Medical University, Liaoning, China.
Jingyi Fan, China Medical University, Liaoning, China.
Xiaojuan Li, China Medical University, Liaoning, China.
Minjie Wei, China Medical University, Liaoning, China.
Lin Zhao, Department of Pharmacology, School of Pharmacy, China Medical University, No.77 Puhe Road, Shenyang North New Area, Shenyang City, 110122, Liaoning, China.
Data availability
The original TCGA data that support the findings of our study are available in the NCI GDC Data portal repository at the following URL: https://portal.gdc.cancer.gov/repository. Gene Expression Omnibus (GEO, https://www.ncbi.nlm.nih.gov/geo/) data were from NCBI GEO.
Funding
This work was supported by grants from National Natural Science Foundation of China (No. 81573462, 81903658, 81703560), Liaoning Revitalization Talents Program (No. XLYC1807201), Major Special S&T Projects in Liaoning Province (2019JH1/10300005), Liaoning Province Scientific Research Foundation (ZF2019038) and Shenyang S&T Projects (No. 19–109–4-09).
References
- 1. Ribas A, Wolchok JD. Cancer immunotherapy using checkpoint blockade. Science (New York, NY) 2018;359:1350–5. [DOI] [PMC free article] [PubMed] [Google Scholar]
- 2. Hegde PS, Chen DS. Top 10 challenges in cancer immunotherapy. Immunity 2020;52:17–35. [DOI] [PubMed] [Google Scholar]
- 3. Chan TA, Yarchoan M, Jaffee E, et al. Development of tumor mutation burden as an immunotherapy biomarker: utility for the oncology clinic. Annals Oncol: Offic J Eur Soc Med Oncol 2019;30:44–56. [DOI] [PMC free article] [PubMed] [Google Scholar]
- 4. Moreira A, Leisgang W, Schuler G, et al. Eosinophilic count as a biomarker for prognosis of melanoma patients and its importance in the response to immunotherapy. Immunotherapy 2017;9:115–21. [DOI] [PubMed] [Google Scholar]
- 5. Patel SP, Kurzrock R. PD-L1 expression as a predictive biomarker in cancer immunotherapy. Mol Cancer Ther 2015;14:847–56. [DOI] [PubMed] [Google Scholar]
- 6. Page DB, Yuan J, Redmond D, et al. Deep sequencing of T-cell receptor DNA as a biomarker of clonally expanded TILs in breast cancer after immunotherapy. Cancer Immunol Res 2016;4:835–44. [DOI] [PMC free article] [PubMed] [Google Scholar]
- 7. Jiang Z, Liu Z, Li M, et al. Increased glycolysis correlates with elevated immune activity in tumor immune microenvironment. EBioMedicine 2019;42:431–42. [DOI] [PMC free article] [PubMed] [Google Scholar]
- 8. McAllister SS, Weinberg RA. Tumor-host interactions: a far-reaching relationship. J Clin Oncol Off J Am Soc Clin Oncol 2010;28:4022–8. [DOI] [PubMed] [Google Scholar]
- 9. Man SM, Kanneganti T-D. Regulation of inflammasome activation. Immunol Rev 2015;265:6–21. [DOI] [PMC free article] [PubMed] [Google Scholar]
- 10. Moossavi M, Parsamanesh N, Bahrami A, et al. Role of the NLRP3 inflammasome in cancer. Mol Cancer 2018;17:158. [DOI] [PMC free article] [PubMed] [Google Scholar]
- 11. Karki R, Kanneganti T-D. Diverging inflammasome signals in tumorigenesis and potential targeting. Nat Rev Cancer 2019;19:197–214. [DOI] [PMC free article] [PubMed] [Google Scholar]
- 12. Allen IC, TeKippe EM, Woodford R-MT, et al. The NLRP3 inflammasome functions as a negative regulator of tumorigenesis during colitis-associated cancer. J Exp Med 2010;207:1045–56. [DOI] [PMC free article] [PubMed] [Google Scholar]
- 13. Dupaul-Chicoine J, Arabzadeh A, Dagenais M, et al. The Nlrp3 Inflammasome suppresses colorectal cancer metastatic growth in the liver by promoting natural killer cell Tumoricidal activity. Immunity 2015;43:751–63. [DOI] [PubMed] [Google Scholar]
- 14. Voigt C, May P, Gottschlich A, et al. Cancer cells induce interleukin-22 production from memory CD4 T cells via interleukin-1 to promote tumor growth. Proc Natl Acad Sci U S A 2017;114:12994–9. [DOI] [PMC free article] [PubMed] [Google Scholar]
- 15. Theivanthiran B, Evans KS, DeVito NC, et al. A tumor-intrinsic PD-L1/NLRP3 inflammasome signaling pathway drives resistance to anti-PD-1 immunotherapy. J Clin Invest 2020;130:2570–86. [DOI] [PMC free article] [PubMed] [Google Scholar]
- 16. Zhu M, Du L, Zhao R, et al. Cell-penetrating nanoparticles activate the Inflammasome to enhance antibody production by targeting microtubule-associated protein 1-light chain 3 for degradation. ACS Nano 2020;14:3703–17. [DOI] [PMC free article] [PubMed] [Google Scholar]
- 17. Liu Z, Li M, Jiang Z, et al. A comprehensive immunologic portrait of triple-negative breast cancer. Trans Oncol 2018;11:311–29. [DOI] [PMC free article] [PubMed] [Google Scholar]
- 18. Massink MPG, Kooi IE, Martens JWM, et al. Genomic profiling of CHEK2*1100delC-mutated breast carcinomas. BMC Cancer 2015;15:877. [DOI] [PMC free article] [PubMed] [Google Scholar]
- 19. Miao D, Margolis CA, Gao W, et al. Genomic correlates of response to immune checkpoint therapies in clear cell renal cell carcinoma. Science (New York, NY) 2018;359:801–6. [DOI] [PMC free article] [PubMed] [Google Scholar]
- 20. Hänzelmann S, Castelo R, Guinney J. GSVA: gene set variation analysis for microarray and RNA-seq data. BMC Bioinformatics 2013;14:7. [DOI] [PMC free article] [PubMed] [Google Scholar]
- 21. Cheng J, Wei D, Ji Y, et al. Integrative analysis of DNA methylation and gene expression reveals hepatocellular carcinoma-specific diagnostic biomarkers. Genome Med 2018;10:42. [DOI] [PMC free article] [PubMed] [Google Scholar]
- 22. Li T, Fan J, Wang B, et al. TIMER: a web server for comprehensive analysis of tumor-infiltrating immune cells. Cancer Res 2017;77:e108–10. [DOI] [PMC free article] [PubMed] [Google Scholar]
- 23. Thorsson V, Gibbs DL, Brown SD, et al. The immune landscape of cancer. Immunity 2018;48:eaax0182. [DOI] [PMC free article] [PubMed] [Google Scholar]
- 24. Yoshihara K, Shahmoradgoli M, Martínez E, et al. Inferring tumour purity and stromal and immune cell admixture from expression data. Nat Commun 2013;4:2612. [DOI] [PMC free article] [PubMed] [Google Scholar]
- 25. Karki R, Man SM, Kanneganti T-D. Inflammasomes and cancer. Cancer Immunol Res 2017;5:94–9. [DOI] [PMC free article] [PubMed] [Google Scholar]
- 26. Ehrlich M. DNA methylation in cancer: too much, but also too little. Oncogene 2002;21:5400–13. [DOI] [PubMed] [Google Scholar]
- 27. Goodman AM, Kato S, Bazhenova L, et al. Tumor mutational burden as an independent predictor of response to immunotherapy in diverse cancers. Mol Cancer Ther 2017;16:2598–608. [DOI] [PMC free article] [PubMed] [Google Scholar]
- 28. Gouravani M, Khalili N, Razi S, et al. The NLRP3 inflammasome: a therapeutic target for inflammation-associated cancers. Expert Rev Clin Immunol 2020;16:175–87. [DOI] [PubMed] [Google Scholar]
- 29. Bruchard M, Mignot G, Derangère V, et al. Chemotherapy-triggered cathepsin B release in myeloid-derived suppressor cells activates the Nlrp3 inflammasome and promotes tumor growth. Nat Med 2013;19:57–64. [DOI] [PubMed] [Google Scholar]
- 30. Tartey S, Kanneganti T-D. Differential role of the NLRP3 inflammasome in infection and tumorigenesis. Immunology 2019;156:329–38. [DOI] [PMC free article] [PubMed] [Google Scholar]
- 31. Huang C-F, Chen L, Li Y-C, et al. NLRP3 inflammasome activation promotes inflammation-induced carcinogenesis in head and neck squamous cell carcinoma. J Exp Clin Cancer Res CR 2017;36:116. [DOI] [PMC free article] [PubMed] [Google Scholar]
- 32. Chen L-C, Wang L-J, Tsang N-M, et al. Tumour inflammasome-derived IL-1β recruits neutrophils and improves local recurrence-free survival in EBV-induced nasopharyngeal carcinoma. EMBO Mol Med 2012;4:1276–93. [DOI] [PMC free article] [PubMed] [Google Scholar]
- 33. Okamoto M, Liu W, Luo Y, et al. Constitutively active inflammasome in human melanoma cells mediating autoinflammation via caspase-1 processing and secretion of interleukin-1beta. J Biol Chem 2010;285:6477–88. [DOI] [PMC free article] [PubMed] [Google Scholar]
- 34. Wei Q, Mu K, Li T, et al. Deregulation of the NLRP3 inflammasome in hepatic parenchymal cells during liver cancer progression. Lab Invest J Tech Methods Pathol 2014;94:52–62. [DOI] [PubMed] [Google Scholar]
- 35. Ungerbäck J, Belenki D, Jawad ul-Hassan A, et al. Genetic variation and alterations of genes involved in NFκB/TNFAIP3- and NLRP3-inflammasome signaling affect susceptibility and outcome of colorectal cancer. Carcinogenesis 2012;33:2126–34. [DOI] [PubMed] [Google Scholar]
- 36. Verma D, Bivik C, Farahani E, et al. Inflammasome polymorphisms confer susceptibility to sporadic malignant melanoma. Pigment Cell Melanoma Res 2012;25:506–13. [DOI] [PubMed] [Google Scholar]
- 37. Daley D, Mani VR, Mohan N, et al. NLRP3 signaling drives macrophage-induced adaptive immune suppression in pancreatic carcinoma. J Exp Med 2017;214:1711–24. [DOI] [PMC free article] [PubMed] [Google Scholar]
- 38. Terme M, Ullrich E, Aymeric L, et al. IL-18 induces PD-1-dependent immunosuppression in cancer. Cancer Res 2011;71:5393–9. [DOI] [PubMed] [Google Scholar]
- 39. Duffy MJ, Crown J. Biomarkers for predicting response to immunotherapy with immune checkpoint inhibitors in cancer patients. Clin Chem 2019;65:1228–38. [DOI] [PubMed] [Google Scholar]
- 40. Topalian SL, Taube JM, Pardoll DM. Neoadjuvant checkpoint blockade for cancer immunotherapy. Science (New York, NY) 2020;367:eaax0182. [DOI] [PMC free article] [PubMed] [Google Scholar]
Associated Data
This section collects any data citations, data availability statements, or supplementary materials included in this article.
Supplementary Materials
Data Availability Statement
The original TCGA data that support the findings of our study are available in the NCI GDC Data portal repository at the following URL: https://portal.gdc.cancer.gov/repository. Gene Expression Omnibus (GEO, https://www.ncbi.nlm.nih.gov/geo/) data were from NCBI GEO.