

Abstract
Data from the SEER reports reveal that the occurrence rate of a cancer type generally follows a unimodal distribution over age, peaking at an age that is cancer-type specific and ranges from 30+ through 70+. Previous studies attribute such bell-shaped distributions to the reduced proliferative potential in senior years but fail to explain why some cancers have their occurrence peak at 30+ or 40+. We present a computational model to offer a new explanation to such distributions. The model uses two factors to explain the observed age-dependent cancer occurrence rates: cancer risk of an organ and the availability level of the growth signals in circulation needed by a cancer type, with the former increasing and the latter decreasing with age. Regression analyses were conducted of known occurrence rates against such factors for triple negative breast cancer, testicular cancer and cervical cancer; and all achieved highly tight fitting results, which were also consistent with clinical, gene-expression and cancer-drug data. These reveal a fundamentally important relationship: while cancer is driven by endogenous stressors, it requires sufficient levels of exogenous growth signals to happen, hence suggesting the realistic possibility for treating cancer via cleaning out the growth signals in circulation needed by a cancer.
Keywords: cancer occurrence rate, cancer risk, triple negative breast cancer, testicular cancer, cervical cancer
Introduction
Cancer has been generally considered as an aging-related illness as multiple epidemiological studies have suggested that age is a key risk factor for numerous cancer types [1]. Cancer genetic research suggests that the risk of cancer occurrence in an organ is largely determined by the total number of stem-cell divisions in the organ since birth [2]. Hence, it is natural to expect that the cancer occurrence rates go up with age for most organs. However, the vast majority of cancer types have unimodal occurrence-rate distributions over age, namely the rates go up with age till they peak and then progressively go down with age as documented in the SEER report [3], except for a few cancer types such as pancreatic cancer. The question we address here is: what may dictate the unimodal distributions of the occurrence rates for most cancer types?
Previous studies have predominantly focused on addressing a simpler version of this problem: why cancer occurrence rates are suppressed at old age [4]. The earliest and popular model for cancer occurrence analyses was developed by Armitage and Doll based on the assumption that cancer arises from a single cell transformed through a series of sudden and irreversible (genetic) changes [5]. With this assumption, cancer occurrence was modeled as a risk process due to hazard-exposure over time, giving rise to the popular multistage cancer incidence model [6]. The model was further developed by multiple authors to address why cancers tend to have suppressed rates at old age, by introducing additional factors such as increased cell senescence and reduced cell proliferative potential with age. Such models are empirical in nature, which fit well with population-based data when only a single cancer type having repressed occurrence only in senior ages is considered. Their inadequacy becomes clear when multiple cancer types are considered together. For example, data from the SEER report have revealed that different cancer types can have rather distinct peak ages, ranging from 30+ for testicular cancer to 70+ for prostate cancer, rather than limited to a narrow range of senior age as assumed by such models. In essence, these models are a single-factor risk model for cancer occurrence, i.e. the accumulative effect of ‘hazards’over time, patched with a qualitative factor, namely the reduced proliferative potential, to deal with the distinct behavior of a cancer at the senior age, but without much data support.
The unimodal shapes of the cancer occurrence-rate distributions, each peaking at a distinct age spanning over 40+ years, strongly suggest that at least a second factor in addition to cancer risk, potentially equally important, is at work in determining the occurrence of a cancer. Knowing that cancer is a developmental process, based on the observation that all TCGA cancer tissues each have multiple developmental programs upregulated as well as on published literature, a natural candidate will be growth signals in circulation, which are used by cancer cells to enable and support their proliferation. Such well-established signals are estrogen and progesterone for ER+ and PR+ breast cancers [7,8], and testosterone for prostate cancer [9]. For other cancer types, it is less known if exogenous growth signals are generally used in support of their growth. Knowing the very high complexity of cell division, it is natural to hypothesize that this process is modulated by some growth and/or development signals and associated programs for each cancer, which can help to coordinate multiple components of the cell-cycle process and cast their functions via interactions with their cell-surface receptors in cancer.
Knowing that cancer proliferation does not have known top-down proliferative signals (a hallmark of cancer [10]) and that cancer cell-cycle genes are considerably less coordinated compared to those in normal proliferating cells (Figure 1), we hypothesize that cancer cells may utilize multiple growth signals to drive and coordinate different components of their cell-cycle program to complete a cell-division process. Guided by this, we have, for each cancer type, searched for such signals through (1) identification of considerably upregulated growth-signal receptors on cancer cell surface, which correlate with a maximal number of cell-cycle genes; and (2) estimation of the age-dependent availability of the cognate ligand for each such receptor via the general circulatory system including blood, lymphoid and nerve. This gives a candidate set of growth signals that may drive the cell-cycle progression in each cancer type in an age-dependent manner.
Figure 1 .

Co-expression patterns among cell-cycle genes in TNBC and in normal proliferating cells. (a) The co-expression patterns in TNBC. (b) The co-expression patterns in normal proliferating cells. Black is for the G1 phase, purple for G1/S transition, blue for G2 phase, red for G2/M transition, light blue for M phase, dark green for M/G1 transition and yellow for S phase.
Our second hypothesis is: the age-dependent risk of cancer occurrence in an organ is proportional to the total number of stem-cell divisions in the organ since birth, following an established study [2], where the relevant data are collected from the SEER reports [3].
A regression analysis is then conducted of the known age-dependent occurrence rate of each cancer type against the age-dependent cancer risk level in the target organ and the estimated production level of the identified growth signal(s) based on RNA-seq data in the relevant organs. Highly accurate regression result was obtained for each of the three cancer types, hence providing strong evidence to our model.
This study focuses on three cancer types: triple negative breast cancer (TNBC), testicular germ cell tumor (TGCT) and cervical squamous cell carcinoma (CESC). The reason for limiting to three cancers is we want to use this as a proof-of-principle to demonstrate that the overall approach works. A follow-up study is planned for a majority of the TCGA cancer types.
The key contributions of the study include: (a) a new model for explaining the age-dependent occurrence rates of a cancer type based on the risk level of cancer development in the relevant organ and the availability level of the growth signals needed by a specific cancer type, hence revealing a fundamentally important insight: having sufficient levels of exogenous growth signals is a necessary component of a cancer development; and (b) a set of noval growth signals for three cancer types, with strong data and model support, which could be clinically tested.
Results
Identification of cell-cycle related growth signal receptors
Our differential gene-expression analyses of the TCGA data have revealed that 100 growth-signal receptor genes are upregulated in TNBC samples versus controls (see METHODS), detailed in Supplementary Table S1. Among these upregulated genes, we have conducted a clustering analysis to identify those that strongly correlate with cell-cycle genes in terms of expression levels, to identify the receptors that are possibly functionally associated with cancer cell cycle (see METHODS). At the end, nine receptor genes were identified: ADIPOR1, F11R, EPHB3, FZD6, GPRC5A, PLAUR, PTPRK, TFRC and TRAF4, with their co-expression data shown as a heatmap in Supplementary Figure S1(a).
Similarly, 143 and 83 receptor genes are upregulated in TGCT and CESC, respectively, detailed in Supplementary Table S1. And 20 and 12 receptor genes having strong correlation with cell-cycle genes in TGCT and CESC, respectively, were identified: ACVR1B, CXCR4, DDR1, EPHB4, ERBB2, ERBB3, F11R, F2RL1, FGFR1, FGFR3, FZD5, GRB2, LRP1, LRP4, PTK7, RAMP2, SMO, TNFRSF12A, TNFRSF1A and TRAF4 in TGCT; and ADGRG1, CELSR2, DDR1, EPHA2, ERBB3, F11R, FZD6, GPRC5A, GRB7, IL10RB, MST1R and TRAF4 in CESC. Heatmaps for co-expressions between the cell-cycle and receptor genes are shown in Supplementary Figure S1(b) and (c).
It is noteworthy that two receptor genes F11R and TRAF4, both immunity-related receptors, are shared by the three cancer types; and both have been used or suggested as potential therapeutic targets across multiple cancer types, such as glioma and lung cancer [11,12]. Out of the three lists of the identified receptor genes, ADIPOR1, EPHB3, PLAUR, PTPRK and TFRC are unique to TNBC. All the receptor genes identified for TGCT are unique to the cancer type except for DDR1, ERBB3, F11R and TRAF4. A total of 6 of the 12 identified receptors genes for CESC are unique to the cancer type, namely: ADGRG1, CELSR2, EPHA2, GRB7, IL10RB and MST1R. Interestingly, not all these receptors are essential to the development of the relevant cancer types based on our regression analyses, based on our regression analyses in Section 3.
Prediction of circulatory concentration of a growth signal
For each identified receptor, our model requires the age-dependent circulatory concentration data of its cognate ligand. However, no such data are publicly available for the vast majority of the receptors based on our extensive search against public databases and literature. Therefore, we have employed the following procedure to estimate such a concentration for each ligand: (i) identifying the main organs for producing the ligand through database search; (ii) estimating the age-dependent synthesis level of the ligand by each such organ based on the expressions of the relevant synthesis genes using data from the GTEx database [13] and summing over the expression levels across all relevant organs; and (iii) predicting that the circulatory concentration of the ligand is proportional to the total synthesis level.
For each receptor, its cognate ligand is identified via searching the Human Protein Atlas [14], which provides the information regarding the main producing organs and releasing the ligand into circulation at a high or medium level by each such organ.
For each such ligand, we have identified the encoding gene if it is a growth factor like epidermal growth factor, or gene g encoding its key synthesis enzyme if it is a growth hormone such as androgen using information from the BioCyc database [15]. We have then predicted the age-dependent level,  of the ligand production based on the total expression level of the gene across all the relevant organs as follows:
 |
(1) |
where Ei(g, j) is the expression level of gene g in organ i at age j collected from GTEx; and  is 1.0 if organ i produces and releases the ligand at a high level, and 0.5 if at a medium level according to data given in Human Protein Atlas for each target organ. If there are parallel pathways for synthesizing the ligand, we calculate this function for each gene and then sum over the results across all the relevant genes.
Using this procedure, we have predicted the age-dependent concentration of the cognate ligand for each identified receptor of each cancer type, with the detailed gene names and the corresponding age-dependent concentrations given in Supplementary Table S2.
The key information derived from this calculation is the relative, rather than the absolute level of the ligand synthesis over age, which gives the shape of its age-dependent distribution of synthesis. We further assume that the circulatory concentration of the ligand is proportional to its  value.
To demonstrate the validity of this prediction approach, we have compared the experimentally determined age-dependent circulatory concentrations of estrogen with the expression levels of their respective synthesis genes. CYP19A1 and HSD17B are the main synthesis genes for estrogen [16]. Between the two, HSD17B is used in our calculation since it is involved in a fewer non-estrogen synthesis processes than CYP19A1 according to the Uniprot database, hence less contributions, i.e. noise by such processes. Ovary is the main organ for its production and release to blood. In addition, adrenal gland and adipose tissue also produce significant fractions of the estrogen in circulation [17]. The age-dependent total expression of HSD17B in ovary, adrenal gland and adipose tissue was compared to the experimentally determined blood concentrations of estrogen [18] in Supplementary Figure S2. We can see that the overall trends of the two sets of curves are comparable, hence providing supporting data to our estimation scheme.
The reason that we used the concentrations of ligands rather than the expressions of their receptors in our model is 2-fold: (1) generally, the receptor levels tend to be a function of the ligand levels; and (2) the availability level of the ligand plays the intrinsic role in the ability of a cancer’s development.
Modeling cancer occurrence using cancer risk and growth-signal availability
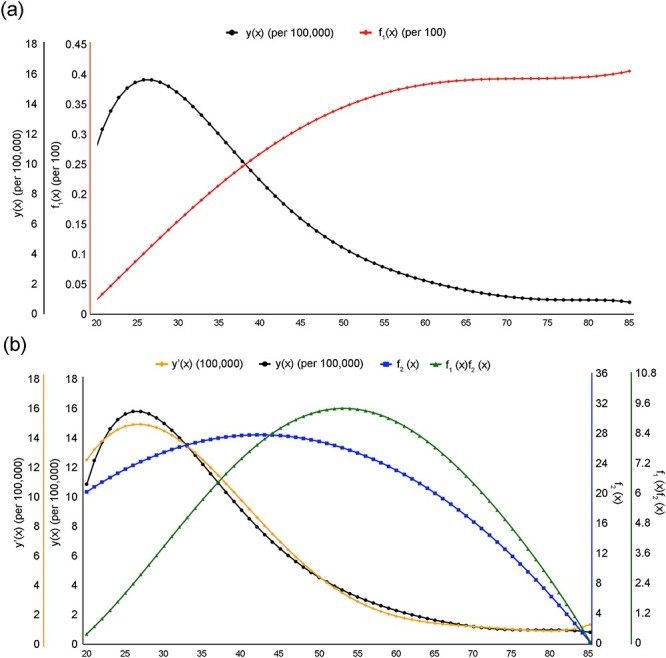
(1) Triple negative breast cancer. Figure 2(a) shows the age-dependent occurrence rate of TNBC collected from the SEER report. To facilitate our regression analyses, we have used the following analytic function:
Figure 2 .

Model fitting for TNBC occurrence rates. (a) The black curve represents the occurrence rate of TNBC (y(x)); The red curve represents the risk level of TNBC (f1(x)), measured using the number of stem-cell divisions in breast since birth; and the x-axis is the age axis, and the y-axis is for the occurrence rate and the risk level of TNBC. (b) The orange curve represents the predicted TNBC incidence rate (y’(x)); The black curve represents the known occurrence rate of TNBC (y(x)); The green curve represents the calculated expression level of PLAU (f2(x)); The purple curve represents the calculated level of PLAU x risk (f1(x)f2(x)); and the blue curve represents the calculated expression level of LGALS9 (f3(x)). The y-axis (from left to light) is for the predicted incidence rate of TNBC (y’(x)), the known occurrence rate of TNBC (y(x)), the expression levels of PLAU (f2(x)), PLAU x risk (f1(x)f2(x)) and LGALS9 (f3(x)), respectively.
 |
(2) |
to approximate this occurrence distribution collected as a series of discrete data, where x denotes age, which is achieved through a regression analysis (see Methods). The approximation accuracy is  with P < 0.001 between the analytic function and the set of discrete points at ages 20, 25, …, 80, 85.
Our goal here is to demonstrate that the occurrence rate of TNBC can be statistically explained in terms of (1) the risk level of the cancer, (2) predicted circulatory concentrations of the ligands whose receptors strongly correlate with the cell-cycle genes and (3) their interactive term(s).
The age-dependent cancer risk is estimated using the number of stem-cell divisions in breast from birth to the current age, which were retrieved from the SEER reports. The data at a set of discrete ages are then approximated using the following function via a regression analysis (see Methods):
 |
(3) |
where x is the age. The approximation accuracy is  with P < 0.001, as shown in Figure 2(a). Clearly there is a substantial difference between the two curves, indicating that some key contributing factors to cancer occurrence are missing.
We have examined if the predicted age-dependent concentrations of the ligands for the nine upregulated receptors identified in Section 1 may help to lead to considerably better fitting than the one shown in Figure 2(a). Based on the observation about the unimodal shape of cancer occurrence, we add one selection criterion for a ligand: it should have a down trend beyond some age, which leaves two sets of ligands out of the nine: PLAU being the ligand for receptor PLAUR, and both BMP7 and LGALS9 being for PTPRK [19]. A preliminary analysis revealed that BMP7 does not add to the accuracy level of our regression result, hence leaving two ligands for our model construction.
According to the human protein atlas, PLAU is mainly produced by adipose, kidney, lung and thyroid. LGALS9 is predominantly produced by cerebellum, adrenal gland, lung, stomach, small intestine and colon. The following functions used to approximate the calculated concentrations of the two ligands given in Supplementary Table S2, achieved through a regression analysis (see Methods):
approximation function for PLAU:
 |
(4) |
and
approximation function for LGALS9:
 |
(5) |
where x is the age. The approximation accuracies are  with P < 0.001 for PLAU regression and
  with P < 0.001 for LGALS9, shown in Figure 2(b). Then a regression of
  against
  and
and  is done with the resulting function
  as follows and depicted in Figure 2(b):
 |
(6) |
where  is an interaction term between the two functions. The regression accuracy is
  with P < 0.001, shown in Figure 2(b).
The regression result suggests that the interaction between PLAU and the risk level, along with PLAU alone, plays a major role in determining age-dependent occurrence rates based on their signs while other terms play more of fine-tuning roles. Based on our literature review, PLAU encodes urokinase-type plasminogen activator and is known to promote breast cancer [20], gastric cancer [21] and non-small cell lung cancer [22]. LGALS9 encodes galectin-9 and is known to be associated with cancer metastasis and immunosuppression. From our transcriptomic data analyses, the two relevant receptors are upregulated by 4.65- and 2.34-fold in TNBC, respectively. Together these provide strong support to our model.
(2) Testicular cancer. We follow the same regression analysis for each step in our model development as in (1). Figure 3(a) shows the age-dependent occurrence rate of TGCT collected from the SEER report. Similar to the above, we have used the following function:
 |
(7) |
to approximate the collected discrete data. The approximation accuracy is  with P < 0.001 between the analytic function and the set of discrete data points at ages 20, 25, …, 80, 85.
Figure 3 .
Model fitting for TGCT occurrence rates. (a) The black curve represents the occurrence rate of TGCT (y(x)); The red curve represents the risk level of TGCT (f1(x)); The x-axis is the age axis, and the y-axis (from left to light) is for the occurrence rate (y(x)) and the risk of TGCT (f1(x)). (b) The orange curve represents the predicted TGCT incidence (y’(x)); The black curve represents the known occurrence rate of TGCT (y(x)); The blue curve represents the calculated expression level of IHNBC (f2(x)); The green curve represents the calculated level of INHBC x risk (f1(x)f2(x)). The x-axis is the age axis, and the y-axis (from left to light) is for the predicted TGCT incidence rate (y’(x)), the known occurrence rate of TGCT (y(x)), and the expression levels of INHBC (f2(x)) and INHBC x risk (f1(x)f2(x)), respectively.
The retrieved caner-risk data are then approximated using the following function via a regression analysis:
 |
(8) |
where the approximation accuracy is  with P < 0.001, shown in Figure 3(a).
As for TNBC, we have examined if the predicted age-dependent concentrations of the ligands for the 20 upregulated receptors may help to lead to considerably better model than the one shown in Figure 3(a). By applying the ligand-section criterion, we get five sets of ligands: both INHBCA and TGFB2 being ligands for receptor ACVR1B; NGR2 for ERBB3; BDNF for F11R; APOE for LRP1, and TNFSF12 for receptor TNFRSF12A. By further analyses as in TNBC, INHBC is the only ligand left.
According to the human protein atlas, INHBC is produced dominantly in liver. The following function is used to approximate its calculated concentrations given in Supplementary Table S2:
 |
(9) |
where the approximation accuracy is  with P < 0.001, shown in Figure 3(b). Then a regression of
  against
  and
and  is done with the resulting function
  as follows:
 |
(10) |
where the regression accuracy is  with P < 0.001, shown in Figure 3(b).
The regression result suggests that the risk level and the level of INHBC play a major role in determining age-dependent occurrence rates while the other terms play fine-tuning roles. Based on our literature review, INHBC encodes the inhibin beta C chain, known to be involved in ovarian cancer development [23]. Its receptor Activin is known to be associated with cell migration and cancer metastasis [24,25]. From our transcriptomic data analyses, the receptor of INHBC is upregulated in 2.43-fold in TGCT. Together these provide strong support to our model.
(3) Cervical cancer. We follow the same regression analysis for each step in our model development as in (1). Figure 4(a) shows the age-dependent occurrence rate of CESC collected from SEER. Similar to the above, we have used the following function:
 |
(11) |
to approximate the collected discrete data. The approximation accuracy is  with P < 0.001 between the analytic function and the set of discrete data points at ages 20, 25, …, 80, 85.
Figure 4 .

Model fitting for CESC occurrence rates. (a) The black curve represents the occurrence rate of CESC (y(x)); The solid black curve represents the risk level of CESC (f1(x)); The x-axis is the age axis, and the y-axis (from left to light) is for the occurrence rate (y(x)) and the risk (f1(x)) of CESC. (b) The orange curve represents the predicted CESC incidence (y’(x)); The black curve represents the occurrence rate of CESC (y(x)); The blue curve represents the calculated expression level of EFNA4 (f2(x)); The purple curve represents the calculated level of EFNA4 x risk (f1(x)f2(x)); The green curve represents the calculated expression level of MST1 (f3(x)). The x-axis is the age axis, and the y-axis (from left to light) is for the predicted CESC incidence (y’(x)), the known occurrence rate of CESC (y(x)), the expression levels of EFNA4 (f2(x)), EFNA4 x risk (f1(x)f2(x)) and MST1 (f3(x)), respectively. (c) The orange curve represents the predicted occurrence rate of CESC (y”(x)); The black curve represents the known occurrence rate of CESC (y(x)); The red curve with dots represents the risk of HPV infection (f4(x)). The x-axis is the age axis, and the y-axis (from left to light) is for the predicted occurrence rate of CESC (y”(x)), the known occurrence rate of CESC (y(x)) and the risk of HPV infection (f4(x)), respectively.
The retrieved caner-risk data at a set of discrete ages are then approximated using the following function via a regression analysis:
 |
(12) |
where the approximation accuracy is  with P < 0.001, shown in Figure 4(a).
As for the above, we have examined if the predicted concentrations of the ligands for the 12 upregulated receptors may help to lead to a considerably better model than the one shown in Figure 4(a). By applying the ligand section criterion, we get two ligands: EFNA4 being the ligand for EPHA2, and MST1 for MST1R. In addition, knowing that a major cause of cervical cancer is the infection of human papillomavirus (HPV) [26], we have searched for and found the age-dependent HPV infection rate in the United States [27]. It is noteworthy that HPV is known to be capable of driving cell cycle of the infected cells, hence serving a growth signal in addition to its other roles in cancer development [28].
According to the human protein atlas, EFNA4 is produced by skin, esophagus, vagina, cervix and minor salivary gland; and MST1 is predominantly produced by liver. We have used the following functions to approximate the calculated concentrations of the two ligands given in Supplementary Table S2, as follows:
approximation function for EFNA4:
 |
(13) |
approximation function for MST1:
 |
(14) |
where the approximation accuracies are  with P < 0.001 for EFNA4 and
  with P < 0.001 for MST1, shown in Figure 4(b).
In addition, an analytic function is used to approximate the HPV infection rates:
 |
(15) |
The approximation accuracy is  with P < 0.001 for HPV, shown in Figure 4(c).
Then a regression of  against all four functions
  ,
,  ,
,  and
and  and achieved an
  with P < 0.001. To gain an understanding of how the two growth signals and HPV may contribute to the occurrence rate of the cancer, separately, we have conducted two separate regression analyses of
  against
  ,
,  and
and  and against
 , respectively, with the regression results given below:
 |
(16) |
where the regression accuracy is  with P < 0.001, shown in Figure 4(b). And
 |
(17) |
where we assume that it takes at least five years for HPV-infected cervical cells to develop cancer; and 15 years after HPV infection, no new cancers will develop. The regression accuracy is  with P < 0.001, shown in Figure 4(c).
Overall, both the two growth factors and HPV can separately well explain the occurrence rate of the cancer. From the two separate sets of curves in Figures 4(b, c), HPV seems to fit the occurrence rates more accurately in the earlier portion of the occurrence curve while the growth factors fit the later portion better. This clearly makes sense as it can be expected that earlier occurrence is probably largely due to HPV infection while the later occurrence is possibly due to chronic inflammation like in the other two cancer types.
The first regression result suggests that the risk level and the level of EFNA4 play a major role in determining age-dependent occurrence rates. Based on our literature review, EFNA4 encodes Ephrin-A4 and is broadly expressed in TNBC and ovarian cancer. MST1 encodes Serine/threonine-protein kinase 4, and is known to be involved in many cancers, such as osteosarcoma, lung cancer and liver cancer [23,29,30]. From our transcriptomic data analyses, the two relevant receptors are upregulated in 2.05- and 4.76-fold by CESC, respectively. The second model suggests that HPV alone is the main driver of the disease while other terms play a fine-tuning role in the fitting results. Overall these provide strong support to our model.
Discussion
Our computational study has led to an important discovery that it takes (at least) two distinct factors for a cancer to take place, namely cancer risk in an organ and the availability of exogenous growth signals needed by a specific cancer type. This represents the first such report for cancer in general, to the best of our knowledge. While the work is purely computational, the discovery is made through integration of multiple pieces of evidence from independent sources, namely (1) the predicted growth signals all have their receptors highly elevated in their relevant cancers; (2) each such receptor strongly correlates with a large number of cell-cycle genes; (3) both the receptors and ligands have been found to play promoting roles in some cancer types in the literature; (4) some of the identified receptors have been used or tested as drug targets for some cancers. For example, PLAUR is a target for breast cancer silencing [31]; and an inhibitor of PLAUR has been found to have anti-invasive or antitumor effect [32]. EPHA2 has been considered as possible anticancer target in ovarian cancer [33], which has been tested in preclinical studies [34]; (5) our simple model can accurately explain the rather nontrivial occurrence-rate distributions, using only two types of factors; and (6) our preliminary data suggest that this model is applicable to all cancer types in TCGA.
Our rationale for the interpretability of the model for cancer occurrence rates is: (i) cancer is a disease that must have cell division persistently at a rate dictated by some micro-environmental factors. Our previous study suggests that it is chronic inflammation beyond a certain level coupled with local iron overload that drives cell division, whose rate is dictated by the level of cytosolic Fenton reaction: Fe2+ + H2O2 - > Fe3+ +  + OH [35]; (ii) to divide at a needed rate, the affected cells must have sufficient supplies of growth signals of specific types in circulation needed by each cancer type; and (iii) the concentrations of such growth signals tend to decrease with age. Overall, we posit that it is the combined effect of the risk level and the levels of specific growth signals needed by individual cancer types that determines the occurrence rate of the cancer. A key implication is: like the risk factor, the availability of needed growth signals is an essential component in a cancer’s development. In a sense, our study generalizes the previous observations that female hormones are needed for certain breast cancers and male hormone for some prostate cancer.
The above has an unexpected corollary: cancers with occurrence rates peaking at a young age and going down quickly with age suggest that such cancers must grow fast as dictated by their cellular environment that we have previously suggested [35]. To enable such cancers to divide at the environment-dictated rates, certain growth factors must be sufficiently available, which only young people are able to provide; and older patients without sufficient levels of the needed growth signals may have the disease manifested in a different form rather than cancer. TGCT is a good example to explain this.
TGCT has two major subtypes: seminoma (SE) and non-seminoma (NSE). SE generally takes place in patients 10-year older than the latter, and as expected, it grows and spreads more slowly than the latter [36]. When the needed growth signals are not sufficiently available, cancer cells will die, which explains a long held observation that NSE tends to be associated with more testicular atrophy than SE [37]. Further analyses of the two subtypes strongly suggest that the faster growing, or more aggressive cancers need both more powerful exogenous growth signals and stronger intracellular infrastructure. Specifically, it has been reported that NSE generally has more active telomerase activities, hence better maintained telomere compared to SE [38], knowing the oncogenesis roles of telomerase [39]. One potential mechanism for the coordination between the needed growth signals and the intracellular setup such as the activity level of telomerase could be done through the oxidative stress level since (1) the cell-division rate of a cancer is largely dictated by the level of H2O2 (coupled with the iron level) as we have previously established [35]; and (2) the expression level of telomerase can be modulated by the intracellular level of oxidative stress [40], which is predominantly determined by the H2O2 level, released by innate immune cells. This clearly warrants further investigation.
An observation made of the identified growth factors for the three cancer types is that different cancer (sub)type tends to use a distinct set of growth signals. For example, the identified growth signals for TNBC do not involve estrogen or progesterone as other subtypes of breast cancers. To further test this observation, we have examined the male breast cancer in TCGA and found that they predominantly rely on ADIPOQ, BMP4, 7, BDNF and TNFSF13B, confirming the generality of our observation.
Another implication of this study is: by discovering the key growth signals used by specific cancer tissues, one can possibly design treatment strategies via cleaning out such signals in circulation or by preventing their syntheses by using medicine or certain diets. Actually, this type of strategy has been used for treating limited cancer types such as estrogen/androgen-driven cancers but our work suggests that this can be used as a general strategy for fighting cancers of possibly all types. Hence, our study could potentially pave a way for developing a general and novel paradigm for cancer treatment: treating cancer by eliminating their needed growth signals, possibly complementing the current strategies which focus on cancer itself.
Materials and Methods
Data
All cancer risk and incidence data are collected from the SEER database [3]. All RNA-seq data of cancer and control tissues used are from TCGA. Table 1 gives the number of samples for both control and cancer tissues for each of the three cancer types. RNA-Seq data of normal proliferating cells for cell-cycle gene analysis are retrieved from Gene Expression Omnibus (GEO) [41]. Gene-expression data used to estimate the synthesis rate of each target ligand are from GTEx, reprocessed by UCSC Xena [13,42]. The list of genes involved in cell cycle is collected from a published study [43] with the gene names given in Supplementary Table S3.
Table 1.
The number of samples for both control and cancer tissues of the three cancer types
| Normal | Tumor | |
|---|---|---|
| TNBC | 113 | 123 |
| CESC | 13 | 305 |
| TGCT | 165 | 149 |
Differentially expressed genes
For each cancer type, differential expression analyses of genes were conducted by comparing RNAseq data between cancer and control tissues using DESeq2 [44]. Two potential batch factors were identified by using RUVg from RUVSeq package [45], based on differentially expressed housekeeping genes [46] as negative gene sets and corrected. Genes with P-values <0.05 and |log2 FC| ≥ 1 are regarded as differentially expressed genes.
Core cell-cycle genes and clustering analysis
In our clustering analyses between growth-factor receptors and cell-cycle genes, we have eliminated cell-cycle genes that are also heavily involved in non-cell cycle processes, hence their expression levels may not necessarily reflect the level of the cell-cycle activity in each cancer type. A weighted correlation network analysis was conducted to identify such genes, giving the rest cell-cycle genes as the core cell-cycle genes [47], which are given in Supplementary Table S4 for each cancer type. A fuzzy clustering analysis was then conducted over the mean expressions of the core cell-cycle genes in the control samples as well as in cancer samples at N0, N1, N2, N3 and M1 stages, respectively, using the Mfuzz package [48]. We then selected representative genes from each cluster via calculating a membership score of each gene to the cluster and using membership score >0.82 as the selection criterion, where the cuttoff is determined empirically. Clusters without genes meeting this criterion are discarded. The detailed clustering result for each cancer type is given in Supplementary Table S5.
Cell-cycle related growth-signal receptors
A total of 387 receptors for growth-related factors are considered based on our literature review, listed in Supplementary Table S6. They fall into the following families: epidermal growth factor receptor (EGF receptor), fibroblast growth factor receptor (FGF receptor), insulin-like growth factor receptor (IGF receptor), platelet-derived growth factor receptor (PDGF receptor), transforming growth factor receptor (TGF receptor), tumor necrosis factor (TNF receptor), vascular endothelial growth factor receptor (VEGF receptor), nerve growth factor receptor, hematopoietic growth factor receptor, ephrin cholinergic receptor and some others. A differential gene-expression analysis was conducted to get all the upregulated receptor genes for each cancer type.
To determine which upregulated receptors correlate with cell-cycle genes, we have conducted the analysis outlined in the above section to get all the representatives for each cluster of cell-cycle genes. A correlation analysis is conducted between the upregulated receptor genes and representatives in each cell-cycle gene cluster of each cancer type. Receptor genes correlated with the mean expressions of the representative genes over cancer samples at N0, N1, N2, N3 and M1 stages, respectively, achieving the Pearson correlation coefficient (PCC) ≥ 0.4, and P-value <0.05, are considered as cell-cycle related receptors, shown in Supplementary Figure S1.
In all, 20, 9 and 12 receptors are found to correlate with 100%, 92.05% and 70% of cell cycle representatives in TGCT, TNBC and CESC, respectively, with the gene names given in Supplementary Table S7.
Regression analysis
A regression analysis was conducted of the age-dependent cancer occurrence rate against (i) the age-dependent cancer risk and (ii) the age-dependent circulatory concentrations of the target ligands. Ligands with (i) average expressions <10 at any age and (ii) non-declining concentrations are discarded. To find the best ligands fitting the cancer occurrence data, we conducted an regression against all subsets of the selected ligands using regsubsets in the leap package [49]. Bayesian Information Criterion, Mallows’s Cp and adjust R2 together were used to select the final regression model.
Data Availability
The data used in this study are openly available in SEER (https://seer.cancer.gov/), TCGA (https://portal.gdc.cancer.gov/), GTEx (https://gtexportal.org/home/), and GEO (https://www.ncbi.nlm.nih.gov/geo/).
Authors’ Contributions
Y.X. conceived the project and conducted the study design; S.Q., Z.A., P.H., J.J., R.T. and H.L. collected the data and literature review; S.Q., Z.A., P.H. and S.W. performed the statistical analysis; and S.Q., Z.A., R.T., J.J., P.H. and Y.X. wrote the paper. All authors read and approved the final manuscript.
KEY POINTS
The paper presents a new discovery of that it takes two key factors for a cancer to take place: the risk factor and the availability level of growth signals specifically needed by individual cancer types.
It is the combined effect of these two types of factors that dictates the unimodal distribution of the age-dependent occurrence rate of each cancer type.
A new method is presented for discovering the cancer-specific exogenous growth signals needed in support of its development, which in its own right could be used as a novel way to treat cancer.
Supplementary Material
Acknowledgement
All authors thank colleagues in the Computational Systems Biology Lab in the Department of Biochemistry and Molecular Biology, the University of Georgia for helpful discussions regarding this project.
Shuang Qiu is a researcher in the Cancer Systems Biology Center, China-Japan Union Hospital of Jilin University and is a PhD student in the Department of Epidemiology and Biostatistics, School of Public Health, Jilin University. Zheng An and Renbo Tan are researchers in the Cancer Systems Biology Center, China-Japan Union Hospital of Jilin University. Ping-an He is a professor in Zhejiang Sci-Tech University. Jinging Jing and Hongxia Li are physicians in China Medical University and Jilin University First Hospital, respectively. Shuang Wu is a lecturer in Changchun Normal University. Ying Xu is an endowed professor of both the University of Georgia and Jilin University. The work by Shuang Qiu, Ping-an He, Jingjing Jing, Hongxia Li and Shuang Wu was largely done when they visited Ying Xu’s lab.
Contributor Information
Shuang Qiu, Cancer Systems Biology Center, China-Japan Union Hospital of Jilin University.
Zheng An, Cancer Systems Biology Center, China-Japan Union Hospital of Jilin University.
Renbo Tan, Cancer Systems Biology Center, China-Japan Union Hospital of Jilin University.
Ping-an He, Zhejiang Sci-Tech University.
Jingjing Jing, China Medical University and Jilin University First Hospital.
Hongxia Li, China Medical University and Jilin University First Hospital.
Shuang Wu, Changchun Normal University.
Ying Xu, University of Georgia and Jilin University.
Funding
This work was supported by the National Natural Science Foundation of China [grant number 61772027]. The senior author thanks the financial support by the Georgia Research Alliance.
Reference
- 1. Magalhaes JP. How ageing processes influence cancer. Nat Rev Cancer 2013;13:357–65. [DOI] [PubMed] [Google Scholar]
- 2. Tomasetti C, Vogelstein B. Cancer etiology. Variation in cancer risk among tissues can be explained by the number of stem cell divisions. Science (New York, NY) 2015;347:78–81. [DOI] [PMC free article] [PubMed] [Google Scholar]
- 3. Park HS, Lloyd S, Decker RH, et al. Overview of the surveillance, epidemiology, and end results database: evolution, data variables, and quality assurance. Curr Probl Cancer 2012;36:183–90. [DOI] [PubMed] [Google Scholar]
- 4. Harding C, Pompei F, Lee EE, et al. Cancer suppression at old age. Cancer Res 2008;68:4465–78. [DOI] [PubMed] [Google Scholar]
- 5. Armitage P, Doll R. The age distribution of cancer and a multi-stage theory of carcinogenesis. Br J Cancer 1954;8:1–12. [DOI] [PMC free article] [PubMed] [Google Scholar]
- 6. Armitage P. Multistage models of carcinogenesis. Environ Health Perspect 1985;63:195–201. [DOI] [PMC free article] [PubMed] [Google Scholar]
- 7. Saha Roy S, Vadlamudi RK. Role of estrogen receptor signaling in breast cancer metastasis. Int J Breast Cancer 2012;2012:654698. [DOI] [PMC free article] [PubMed] [Google Scholar]
- 8. Lange CA, Yee D. Progesterone and breast cancer. Womens Health (Lond Engl) 2008;4:151–62. [DOI] [PMC free article] [PubMed] [Google Scholar]
- 9. Tubaro A. Testosterone and prostate cancer. Eur Urol 2007;51:293–5. [DOI] [PubMed] [Google Scholar]
- 10. Hanahan D, Weinberg RA. Hallmarks of cancer: the next generation. Cell 2011;144:646–74. [DOI] [PubMed] [Google Scholar]
- 11. Pong WW, Walker J, Wylie T, et al. F11R is a novel monocyte prognostic biomarker for malignant glioma. PloS one 2013;8:e77571. [DOI] [PMC free article] [PubMed] [Google Scholar]
- 12. Li W, Peng C, Lee MH, et al. TRAF4 is a critical molecule for Akt activation in lung cancer. Cancer Res 2013;73:6938–50. [DOI] [PMC free article] [PubMed] [Google Scholar]
- 13.Carithers LJ, Moore HM. The Genotype-Tissue Expression (GTEx) Project. Biopreservation and biobanking 2015;13:307–8. [DOI] [PMC free article] [PubMed] [Google Scholar]
- 14. Uhlen M, Fagerberg L, Hallstrom BM, et al. Proteomics. Tissue-based map of the human proteome. Science (New York, NY) 2015;347:1260419. [DOI] [PubMed] [Google Scholar]
- 15. Caspi R, Billington R, Ferrer L, et al. The MetaCyc database of metabolic pathways and enzymes and the BioCyc collection of pathway/genome databases. Nucleic Acids Res 2016;44:D471–80. [DOI] [PMC free article] [PubMed] [Google Scholar]
- 16. Cui J, Shen Y, Li R. Estrogen synthesis and signaling pathways during aging: from periphery to brain. Trends Mol Med 2013;19:197–209. [DOI] [PMC free article] [PubMed] [Google Scholar]
- 17. Barakat R, Oakley O, Kim H, et al. Extra-gonadal sites of estrogen biosynthesis and function. BMB Rep 2016;49:488–96. [DOI] [PMC free article] [PubMed] [Google Scholar]
- 18. Low Testosterone in Women – Signs, Symptoms + Treatment Guide. https://www.restartmed.com/low-testosterone-women/. (8 August 2020, date last accessed)
- 19. Efremova M, Vento-Tormo M, Teichmann SA, et al. CellPhoneDB: inferring cell-cell communication from combined expression of multi-subunit ligand-receptor complexes. Nat Protoc 2020;15:1484–506. [DOI] [PubMed] [Google Scholar]
- 20. Schmitt M, Harbeck N, Brünner N, et al. Cancer therapy trials employing level-of-evidence-1 disease forecast cancer biomarkers uPA and its inhibitor PAI-1. Expert Rev Mol Diagn 2011;11:617–34. [DOI] [PubMed] [Google Scholar]
- 21. Ai C, Zhang J, Lian S, et al. FOXM1 functions collaboratively with PLAU to promote gastric cancer progression. J Cancer 2020;11:788–94. [DOI] [PMC free article] [PubMed] [Google Scholar]
- 22. Lu JJ, Guo H, Gao B, et al. Prognostic value of urokinase plasminogen activator system in non-small cell lung cancer: a systematic review and meta-analysis. Molecular and clinical oncology 2018;8:127–32. [DOI] [PMC free article] [PubMed] [Google Scholar]
- 23. Xie Y, Lv Y, Zhang Y, et al. LATS2 promotes apoptosis in non-small cell lung cancer A549 cells via triggering Mff-dependent mitochondrial fission and activating the JNK signaling pathway. Biomedicine & pharmacotherapy = Biomedecine & pharmacotherapie 2019;109:679–89. [DOI] [PubMed] [Google Scholar]
- 24. Simon DP, Vadakkadath Meethal S, Wilson AC, et al. Activin receptor signaling regulates prostatic epithelial cell adhesion and viability. Neoplasia (New York, NY) 2009;11:365–76. [DOI] [PMC free article] [PubMed] [Google Scholar]
- 25. Huang CW, Chen HY, Yen MH, et al. Gene expression of human lung cancer cell line CL1-5 in response to a direct current electric field. PloS one 2011;6:e25928. [DOI] [PMC free article] [PubMed] [Google Scholar]
- 26. Burd EM. Human papillomavirus and cervical cancer. Clin Microbiol Rev 2003;16:1–17. [DOI] [PMC free article] [PubMed] [Google Scholar]
- 27. Centers for Disease Control and Prevention (CDC) . https://www.cdc.gov (8 August 2020, date last accessed).
- 28. Brenna SM, Syrjanen KJ. Regulation of cell cycles is of key importance in human papillomavirus (HPV)-associated cervical carcinogenesis. Sao Paulo Med J 2003;121:128–32. [DOI] [PMC free article] [PubMed] [Google Scholar]
- 29. Su X, Teng J, Jin G, et al. ELK1-induced upregulation of long non-coding RNA MIR100HG predicts poor prognosis and promotes the progression of osteosarcoma by epigenetically silencing LATS1 and LATS2. Biomed Pharmacother 2019;109:788–97. [DOI] [PubMed] [Google Scholar]
- 30. Zhang S, Liu S, Zhang J, et al. Synergistic anti-oomycete effect of melatonin with a biofungicide against oomycetic black shank disease. J Pineal Res 2018;65:e12492. [DOI] [PubMed] [Google Scholar]
- 31. Narayanaswamy PB, Baral TK, Haller H, et al. Transcriptomic pathway analysis of urokinase receptor silenced breast cancer cells: a microarray study. Oncotarget 2017;8:101572–90. [DOI] [PMC free article] [PubMed] [Google Scholar]
- 32. Romer J, Nielsen BS, Ploug M. The urokinase receptor as a potential target in cancer therapy. Curr Pharm Des 2004;10:2359–76. [DOI] [PubMed] [Google Scholar]
- 33. Landen CN, Kinch MS, Sood AK. EphA2 as a target for ovarian cancer therapy. Expert Opin Ther Targets 2005;9:1179–87. [DOI] [PubMed] [Google Scholar]
- 34. Tandon M, Vemula SV, Mittal SK. Emerging strategies for EphA2 receptor targeting for cancer therapeutics. Expert Opin Ther Targets 2011;15:31–51. [DOI] [PMC free article] [PubMed] [Google Scholar]
- 35. Sun H, Zhang C, Cao S, et al. Fenton reactions drive nucleotide and ATP syntheses in cancer. J Mol Cell Biol 2018;10:448–59. [DOI] [PMC free article] [PubMed] [Google Scholar]
- 36. Verhoeven RH, Karim-Kos HE, Coebergh JW, et al. Markedly increased incidence and improved survival of testicular cancer in the Netherlands. Acta oncologica (Stockholm, Sweden) 2014;53:342–50. [DOI] [PubMed] [Google Scholar]
- 37. Møller H, Prener A, Skakkebaek NE. Testicular cancer, cryptorchidism, inguinal hernia, testicular atrophy, and genital malformations: case-control studies in Denmark. Cancer Causes Control 1996;7:264–74. [DOI] [PubMed] [Google Scholar]
- 38. Sun H, Kim P, Jia P, et al. Distinct telomere length and molecular signatures in seminoma and non-seminoma of testicular germ cell tumor. Brief Bioinform 2019;20:1502–12. [DOI] [PMC free article] [PubMed] [Google Scholar]
- 39. Jafri MA, Ansari SA, Alqahtani MH, et al. Roles of telomeres and telomerase in cancer, and advances in telomerase-targeted therapies. Genome Med 2016;8:69. [DOI] [PMC free article] [PubMed] [Google Scholar]
- 40. Epel ES, Lin J, Dhabhar FS, et al. Dynamics of telomerase activity in response to acute psychological stress. Brain Behav Immun 2010;24:531–9. [DOI] [PMC free article] [PubMed] [Google Scholar]
- 41. Barrett T, Wilhite SE, Ledoux P, et al. NCBI GEO: archive for functional genomics data sets--update. Nucleic Acids Res 2013;41:D991–5. [DOI] [PMC free article] [PubMed] [Google Scholar]
- 42. Goldman MJ, Craft B, Hastie M, et al. Visualizing and interpreting cancer genomics data via the Xena platform. Nat Biotechnol 2020;38:675–8. [DOI] [PMC free article] [PubMed] [Google Scholar]
- 43. Grant GD, BrooksL, 3rd, Zhang X, et al. Identification of cell cycle-regulated genes periodically expressed in U2OS cells and their regulation by FOXM1 and E2F transcription factors. Mol Biol Cell 2013;24:3634–50. [DOI] [PMC free article] [PubMed] [Google Scholar]
- 44. Love MI, Huber W, Anders S. Moderated estimation of fold change and dispersion for RNA-seq data with DESeq2. Genome Biol 2014;15:550. [DOI] [PMC free article] [PubMed] [Google Scholar]
- 45. Risso D, Ngai J, Speed TP, et al. Normalization of RNA-seq data using factor analysis of control genes or samples. Nat Biotechnol 2014;32:896–902. [DOI] [PMC free article] [PubMed] [Google Scholar]
- 46. Eisenberg E, Levanon EY. Human housekeeping genes, revisited. Trends Genet 2013;29:569–74. [DOI] [PubMed] [Google Scholar]
- 47. Langfelder P, Horvath S. WGCNA: an R package for weighted correlation network analysis. BMC Bioinformatics 2008;9:559. [DOI] [PMC free article] [PubMed] [Google Scholar]
- 48. Kumar L, EF M. Mfuzz: a software package for soft clustering of microarray data. Bioinformation 2007;2:5–7. [DOI] [PMC free article] [PubMed] [Google Scholar]
- 49. Lumley T. Regression subset selection. http://CRAN. R-project. org/package= leaps (18 March 2020, date last accessed).
Associated Data
This section collects any data citations, data availability statements, or supplementary materials included in this article.
Supplementary Materials
Data Availability Statement
The data used in this study are openly available in SEER (https://seer.cancer.gov/), TCGA (https://portal.gdc.cancer.gov/), GTEx (https://gtexportal.org/home/), and GEO (https://www.ncbi.nlm.nih.gov/geo/).