

Abstract
Background:
Thousands of per- and polyfluoroalkyl substances (PFAS) with diverse structures have been detected in the ambient environment. Apart from a few well-studied PFAS, the structure-related toxicokinetics of a broader set of PFAS remain unclear.
Objectives:
To understand the toxicokinetics of PFAS, we attempted to characterize the metabolism pathways of 74 structurally diverse PFAS samples from the U.S. Environmental Protection Agency’s PFAS screening library.
Methods:
Using the early life stages of zebrafish (Danio rerio) as a model, we determined the bioconcentration factors and phenotypic toxicities of 74 PFAS. Then, we applied high-resolution mass spectrometry–based nontargeted analysis to identify metabolites of PFAS in zebrafish larvae after 5 d of exposure by incorporating retention time and mass spectra. In vitro enzymatic activity experiments with human recombinant liver carboxylesterase (hCES1) were employed to validate the structure-related hydrolysis of 11 selected PFAS.
Results:
Our findings identified five structural categories of PFAS prone to metabolism. The metabolism pathways of PFAS were highly related to their structures as exemplified by fluorotelomer alcohols that the predominance of or taurine conjugation pathways were primarily determined by the number of hydrocarbons. Hydrolysis was identified as a major metabolism pathway for diverse PFAS, and perfluoroalkyl carboxamides showed the highest in vivo hydrolysis rates, followed by carboxyesters and sulfonamides. The hydrolysis of PFAS was verified with recombinant hCES1, with strong substrate preferences toward perfluoroalkyl carboxamides.
Conclusions:
We suggest that the roadmap of the structure-related metabolism pathways of PFAS established in this study would provide a starting point to inform the potential health risks of other PFAS. https://doi.org/10.1289/EHP7169
Introduction
Per- and polyfluoroalkyl substances (PFAS) have been widely used in textiles, firefighting foams, and surface coatings in the past decades (Giesy and Kannan 2002; Houde et al. 2011; Lau et al. 2007). Because of concerns regarding their bioaccumulation, persistence, and toxicities, perfluorooctane sulfonate (PFOS) and related PFAS have been phased out in some parts of the world (OECD 2015). However, recent nontargeted analysis studies detected PFAS in technical products (Barzen-Hanson et al. 2017; D’Agostino and Mabury 2014; Martin 2004; Place and Field 2012; Yang et al. 2020) and the environment, including surface waters (Gebbink et al. 2017; Liu et al. 2015; Newton et al. 2017), wastewaters (Wang et al. 2018), and sediments (Lin et al. 2017). Previous toxicokinetics studies have been focused on well-studied perfluoroalkyl acids (Fujii 2015; Huang 2019; Jantzen et al. 2016; Martin et al. 2003; Vogs et al. 2019), but limited information exists for a broader set of PFAS.
Distinct from other persistent organic pollutants accumulated in fatty tissues, perfluoroalkyl acids favor protein binding in blood and liver (Kudo 2007; Shi et al. 2012). Several transporter proteins including liver fatty acid–binding protein (L-FABP) (Cao et al. 2019; Cheng and Ng 2017), serum albumin (Beesoon and Martin 2015; Jones 2003), and organic anion transporters (Weaver et al. 2010; Zhao 2017) have been reported to play vital roles in regulating the pharmacokinetics of perfluoroalkyl carboxylates and perfluoroalkyl sulfonates. Only PFAS with carboxylic acid or sulfonic acid groups were revealed to bind strongly to L-FABP (Yang et al. 2020); therefore, this specific protein binding may not explain the general bioaccumulation mechanism for other PFAS. Alternatively, nonspecific binding to the cellular proteome and phospholipids has been suggested to be crucial for the bioaccumulation of perfluoroalkyl acids (Droge 2019; Ng and Hungerbühler 2013), but the relative importance has not been systematically assessed for a broader set of PFAS. In addition, the toxicokinetics of PFAS may be further complicated by xenobiotic metabolism in organisms. For instance, the biotransformation of fluorotelomer alcohols (FTOHs) and perfluoroalkyl sulfonamides are well known as indirect sources of perfluoroalkyl acids (Butt et al. 2010; Chen et al. 2015). The metabolism pathways of PFAS may be distinct from hydrocarbon compounds owing to the strong electronegativity of fluorine, as exemplified by the defluorination of 8:2 fluorotelomer carboxylic acid (8:2 FTCA) to form 7:3 FTCA via a spontaneous decomposition scheme (Butt et al. 2010). Indeed, the enzymes responsible for the hydrolysis of perfluoroalkyl sulfonamides to perfluorosulfonic acids (PFSAs) have not been characterized even though the biotransformation has been well documented (Chen et al. 2015; Peng et al. 2014; Tomy et al. 2004). Therefore, to understand the toxicokinetics of structurally diverse PFAS, more detailed structure-related metabolism pathways should be established (Lu et al. 2019).
The early life stage of zebrafish (Danio rerio) is widely used as a model to characterize the toxicities of pollutants (Fu et al. 2013; Li et al. 2017; Thornton et al. 2016) because the early life stage of fish is considered the most sensitive to environmental stressors (Embry et al. 2010; Villeneuve et al. 2014; Volz et al. 2011). In addition, embryonic zebrafish have been proposed as a cost-effective platform to assess the bioaccumulations of pollutants (Sanz-Landaluze et al. 2015; Sun et al. 2016). A recent study (Vogs et al. 2019) that investigated the toxicokinetics of perfluoroalkyl acids in embryonic zebrafish showed comparable results to those of adult fish. Embryonic zebrafish have also been widely used to characterize the metabolism pathways of xenobiotics (Anselmo et al. 2018) given that the majority of xenobiotics-metabolizing enzymes—such as cytochrome P450s (CYPs), nicotinamide adenine dinucleotide hydrogen quinone oxidoreductase, and liver carboxylesterases (CESs)—were shown to be developed in zebrafish embryos (White et al. 2017). The metabolism pathways of several chemical contaminants in embryonic zebrafish have been documented, including polybrominated diphenyl ethers (Chen et al. 2012), tetrabromobisphenol A (Liu et al. 2018), and organophosphate flame retardants (Wang et al. 2015). Therefore, the embryonic zebrafish is a relatively high-throughput and cost-effective model for investigating the structure-related metabolism of PFAS.
The U.S. Environmental Protection Agency (U.S. EPA) established an initial PFAS screening library by selecting 75 structurally diverse PFAS according to a chemical category-based prioritization approach (Patlewicz et al. 2019). Using this library, we aimed to characterize patterns of structure-related toxicities and metabolism of PFAS in the early life stages of zebrafish (schematic workflow shown in Figure 1A). Bioconcentration factors and toxicities were investigated for these PFAS. Nontargeted analysis was then employed to characterize the corresponding metabolism pathways, and a recombinant enzyme was used to confirm a predicted hydrolytic mechanism.
Figure 1.
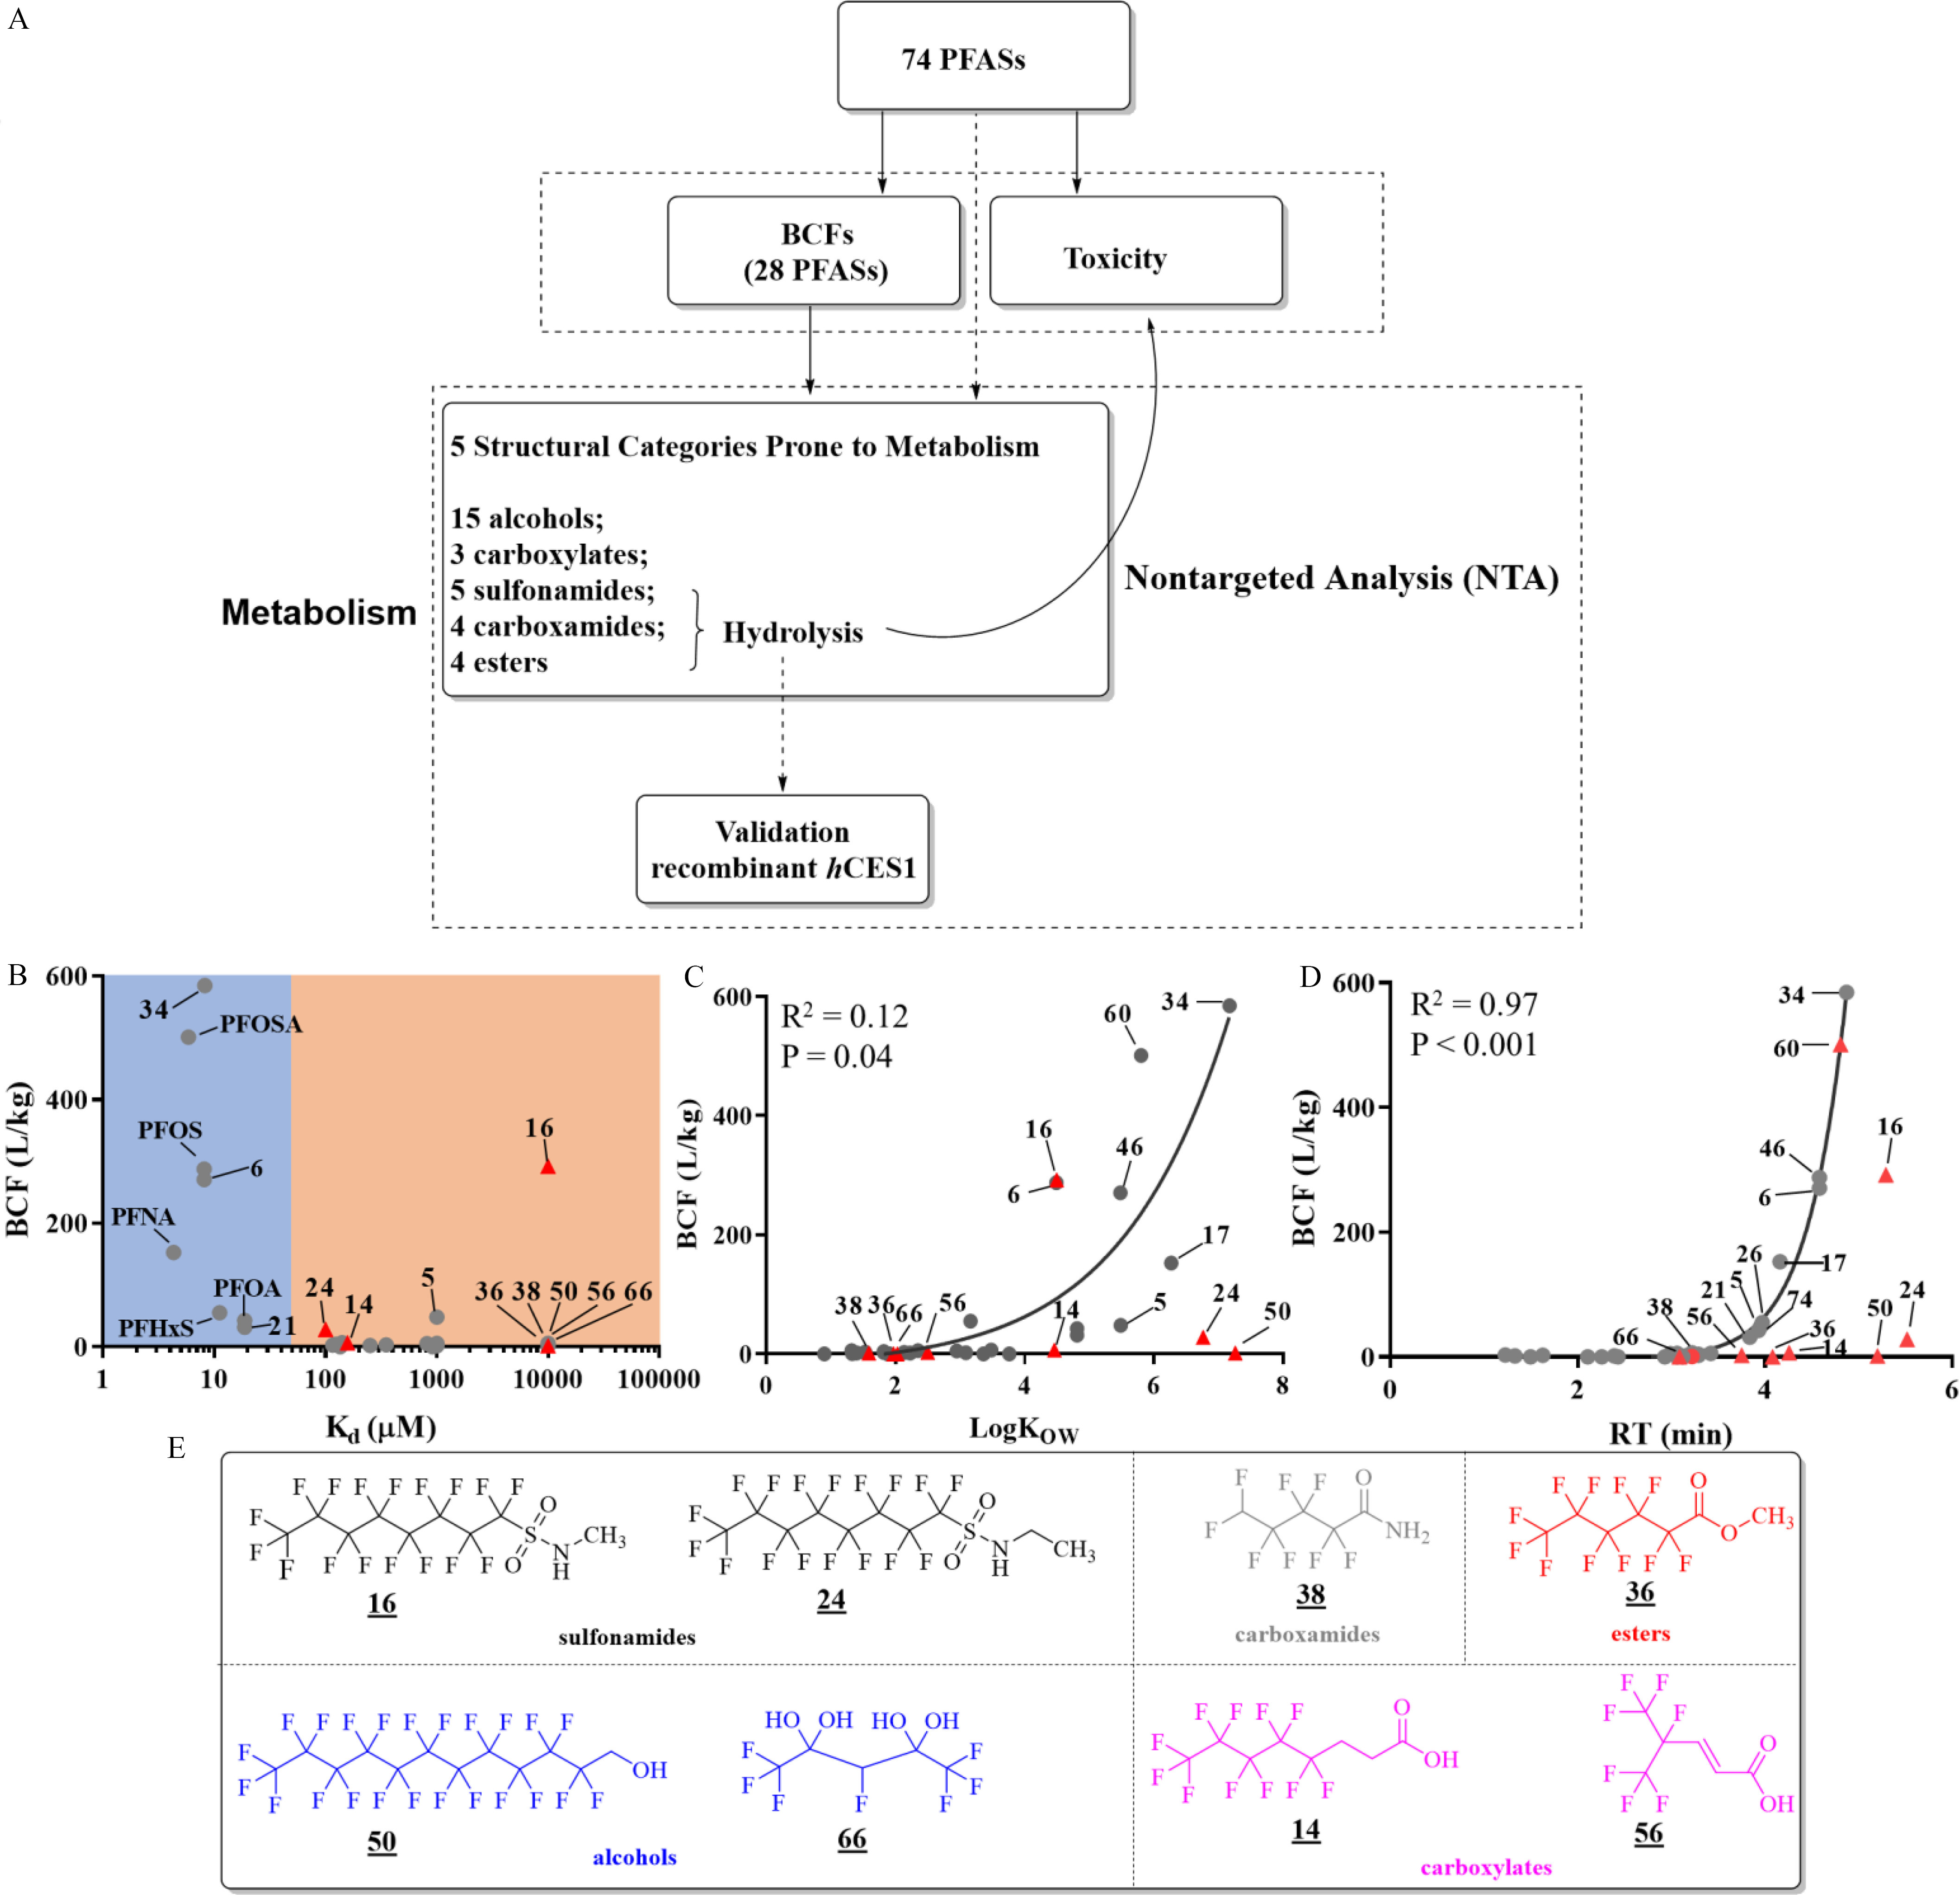
Bioaccumulation of PFAS in zebrafish larvae. (A) Schematic workflows of this study. BCFs and toxicities were investigated for all 74 PFAS, followed by metabolism studies focused on five structural categories prone to metabolism. larvae for each of three replicates per treatment group. (B) Relationship between BCFs of PFAS and L-FABP binding affinity indicated by (data from Yang et al. 2020). PFAS binding strongly () to L-FABP are labeled in the blue area. PFAS binding weakly to L-FABP are labeled in the orange area. Exponential regression was performed between (C) BCF and or (D) retention times, were deemed statistically significant. The values of PFAS were calculated using the EPI Suite. Retention times (RTs) of PFAS were derived from a C18 column, as described in the “Materials and Methods” section. (E) Representative chemical structures of eight PFAS prone to metabolism, which are grouped into five structural categories labeled in different colors. In (B), (C), and (D), red triangles refer to PFAS that were hypothesized to be prone to metabolism, whereas the other PFAS are represented by grey closed circles. The summary data of Figure 1 can be found in Excel Table S2. Note: BCF, bioconcentration factor; EPI Suite, Estimation Programs Interface Suite; L-FABP, liver fatty acid–binding protein; PFAS, per- and polyfluoroalkyl substances.
Materials and Methods
Chemicals and Reagents
A standard mixture of mass-labeled PFAS [, , -perfluorohexanoic acid (PFHxA), , , -perfluorononanoic acid (PFNA), , and -perfluorohexanesulfonate acid (PFHxS)] was obtained from Wellington Laboratories. The U.S. EPA’s PFAS screening library was established with a chemical category-based prioritization approach (Patlewicz et al. 2019). Chemical curation after library selection revealed 74 unique PFAS (detailed information in Table S1). The authentic standards were supplied by Evotec SE under contract to the U.S. EPA through a material transfer agreement. The identities of 54 PFAS were confirmed by gas- or liquid-chromatography (LC) mass spectrometry (MS), including 30 PFAS selected for metabolite identifications except for PFAS 47. Among these 54 PFAS, 36 PFAS were confirmed by high-resolution MS by detecting their molecular ions within a mass error of , as described below. Chemicals were procured at the highest purity available, generally purity, and prepared as stock solutions in dimethyl sulfoxide (DMSO). The stock solution of GenX was prepared in water due to its instability in DMSO (Gaballah et al. 2020; Liberatore et al. 2020). The presence of parent structures and metabolites in testing here was determined by high-resolution MS, as described below. Recombinant human liver carboxylesterase 1 (hCES1) was obtained from Sigma Aldrich. Ultrapure water, methanol, and high-performance LC (HPLC)–grade dichloromethane were obtained from Fisher Scientific. DMSO (99.7%) and sodium bicarbonate (99.7%) were obtained from Sigma Aldrich. Phosphate-buffered saline tablets were purchased from BioShop.
Animal Husbandry
Wild-type zebrafish (Danio rerio, AB/TU strain) used in this study were kept at the Terrence Donnelly Center for Cellular and Biomolecular Research (University of Toronto, Toronto, Canada) in conformity with the Canadian Council on Animal Care’s recommendations, with all maintenance being approved by the University of Toronto Animal Care Committee (Tiefenbach 2010). Briefly, Adult fish were maintained in the fish facility with a recirculating system, conditioned water ( sea salt, sodium bicarbonate in reverse osmosis water) is used as the system water. A 10% water exchange occurred daily to maintain appropriate pH (6.5–7.5), ammonia level (), nitrite level () and nitrate level (). The water temperature was 28.5°C. Lights are on from 0800–2200 hours, off from 2200–0800 hours. On weekdays, the fish were fed brine shrimp in the morning and flake food (TetraMin Tropical Flakes) and brine shrimp in the afternoon. On weekends, they were fed once with both foods. On the day before embryo collection, 30 pairs of adult zebrafish (1 male/1 female) were placed in each spawning chamber with of the system water. Male and female zebrafish were isolated from each other by dividers. Dividers were removed to allow the zebrafish to mate after the light came on the next morning.
Administration of Chemicals to the Zebrafish
Toxicity tests with zebrafish embryos were carried out in accordance with the guidelines set by the Organization for Economic Co-operation and Development (OECD) with minor modifications (OECD 2012). Zebrafish embryos were collected immediately after spawning, within 1 h, and subsequently transferred to 24-well plates with of facility water ( sea salt, sodium bicarbonate in of reverse osmosis water). All embryos were at around the 64-cell stage (Kimmel CB 1995). The facility water was then replaced with of freshly prepared exposure medium supplemented with either 0.1% DMSO (control), or of PFAS (treatment) within 15 min. Three well replicates on the same plate were conducted for each concentration of individual chemical. Depending on the number of embryos collected, 2–3 plates and 7–11 PFAS were tested for each batch of experiment. Seven batches of experiments were performed to test all 74 PFAS. DMSO controls were incorporated in each batch of exposure experiments. Three replicates were performed for each treatment group, and 20 embryos were used for each replicate. Embryos were subjected to exposure for 5 d under a 14:10-h light:dark cycle at 28.5°C. For daily replenishment, of old exposure medium were replaced with freshly prepared medium every 24 h from 24 to 96 h post fertilization (hpf). Hatched or dead embryo numbers were recorded every 24 hpf, after which dead embryos were discarded from the growth media. Dead embryos or unhatched embryos were not used for PFAS measurement because the metabolism of PFAS might have been impacted. Zebrafish larvae collection occurred at 120 hpf. First, the larvae were anesthetized by cooling the plate in ice water (0–4°C) for . Then 8–15 larvae in each well were transferred into tubes. Exposure media was carefully removed, and then the larvae were weighed (wet weight) after blotting excess water with a paper towel. The tissue concentrations of PFAS might be slightly overestimated owing to residual water on the skin. Samples were stored at until further chemical analysis was performed. Survival rate and hatching rate were calculated by summarizing all the documented data from the whole treatment duration. Similar to a previous zebrafish study (Dasgupta et al. 2020), positive controls or plate inclusion criteria were not included in the present study. Indeed, only three PFAS exerted significant lethal effects, and the lethal effects of the most toxic perfluorooctanesulfonamide (PFOSA) were confirmed by an independent follow-up experiment. The exposure experiment of PFOSA was repeated using the same procedure as described above. Malformation rates—including those for pericardial edema (), tail dysplasia (), and spinal curvature () from controls—were low (Excel Table S1). The hatchability and mortality rates of controls were and , respectively ( for each of three replicates). No significant difference (hatchability, ; mortality, ) was detected among batches according to the results of one-way analysis of variance (ANOVA) with Tukey tests.
Given that the present study was largely focused on the metabolism pathways of PFAS, we decided to select 0.5 and as the exposure concentrations because acute toxicities were not observed for PFAS except for of PFOSA (60) and N-methylperfluorooctanesulfonamide (NMe-FOSA, 16). Therefore, the metabolism abilities of zebrafish larvae should be preserved under the selected concentrations. Although the occurrences of many studied PFAS have been reported in previous nontargeted analysis studies, their concentrations in the environment remain unknown owing to a lack of authentic standards. However, the selected concentrations are comparable to classic PFAS in aqueous film forming foam formulation (AFFF)–contaminated waters. For instance, () PFHxS, () PFHxA, and () PFOA were detected in groundwater from the American military sites (Backe 2013). A maximum of () of PFOS was detected in Etobicoke Creek near the Toronto Pearson Airport (Moody 2002).
Exposure of Embryos to Polyfluoroalkyl Carboxamides
Time courses of carboxamides (19, 31, and 38) and corresponding perfluoroalkyl carboxylic acid (PFCA) metabolites in zebrafish larvae were investigated. The procedure of zebrafish embryo collection was described above. Twenty embryos were randomly assigned into each well of a 24-well plate. Subsequently, 15 wells were dosed with of each chemical (). Exposure was performed under a 14:10 h light:dark cycle at 28.5°C for 120 h. The exposure medium was prepared fresh and changed each day, and dead larvae were discarded. For each chemical, 3 wells were harvested every 24 h, and the surviving larvae were transferred to three different tubes for further PFAS extraction ().
Extraction Procedures
Each sample was spiked with of mass-labeled PFAS mixture. Following this, of dichloromethane/methanol (2:1, vol/vol) was added to each sample for PFAS extraction. Larvae were then homogenized via ultrasonic probe, followed by 30 min of shaking and 30 min of sonication. Each sample was centrifuged at for 5 min, after which the supernatant was transferred to new tubes. Extraction was repeated once and the two supernatants were combined, evaporated under nitrogen flow, and reconstituted in of methanol for MS analysis.
Validation of hCES1 Hydrolytic Activity with Recombinant Enzyme
Because recombinant zebrafish CES is not available, we decided to use hCES1 to evaluate the structure-related hydrolysis of PFAS. Eleven PFAS were selected to evaluate the potential hydrolytic activities of recombinant hCES1, including six PFAS (16, 19, 31, 38, 39, and 60) exhibiting hydrolysis in in vivo experiments of this study, and five additional PFAS (10, 13, 36, 47, and 58) with amide or ester bonds. In vitro enzymatic activity experiments were carried out for 1 h in tubes with phosphate buffer ( sodium chloride, phosphate buffer, potassium chloride; pH 7.4) at 37°C with shaking. Reaction mixtures contained different concentrations of PFAS (1, 10, and ) and hCES1. Three replicates were used for each PFAS. To stop the hydrolysis reaction, four times the volume of ice-cold methanol was added. The hCES1 protein was precipitated out by centrifugation (, 10 min). The supernatant was transferred to a new tube and analyzed via MS for the analysis of parent compounds and suspected metabolites (i.e., carboxylates).
Metabolite Profiling with High-Resolution MS
Three microliters of each zebrafish extract was applied to a C18 column (; ; Thermo Scientific) and analyzed using a Vanquish ultra-HPLC system (Thermo Fisher Scientific) coupled to a Q Exactive high-resolution mass spectrometer (Thermo Fisher Scientific). The sampler and column compartments were maintained at 4°C and 40°C, respectively. The aqueous mobile phase solution (A) consisted of water, whereas the organic mobile phase solution (B) consisted of acetonitrile. The LC method was as follows: Solution B was increased from 10% to 80% from 0 to 3 min, kept static from 3 to 5.8 min, then returned to 2% from 5.8 to 6 min and maintained at 10% for 1 min. MS data was acquired in full scan mode (100–1000 m/z, 70,000 mass resolution, maximum ions collected per 100 ms), and tandem MS (MS/MS) data was recorded by all-ion fragmentation (AIF) mode. Negative and positive ion modes were carried out simultaneously at a 10-min method duration. Among 74 PFAS, 36 compounds showed detectable signals at under the current instrumental conditions. An overview of the analyses conducted on the various PFAS is available in Table S2.
Quality Assurance and Quality Control
In the case of an isotope-labeled standard being unavailable for an individual PFAS chemical, the mass-labeled PFAS chemical with the closest retention time (RT) was assigned as an internal standard, on account of their similar structures and HPLC behaviors. No PFAS were detected in procedure blanks. To determine method detection limits (MDLs) for each PFAS compound, PFAS standards were spiked to samples at , and MDLs were calculated at a 99% confidence level by dividing the calibration curve y-intercept by the slope. To determine the recoveries of PFAS, 1 nmol of the PFAS mixture was spiked into a tube with 10 zebrafish larvae from the controls. Three replicates were conducted. Then the spiked samples were extracted using the same method mentioned above. Recoveries were determined as 71–111% for all detectable PFAS (Table S3). Details regarding determined MDLs and recoveries are provided in the Table S3.
Nontargeted Analysis of Metabolites
Only the high-dose treatment groups () were used for metabolite identification while the treatment group was selected for PFOSA given that no zebrafish larvae from the group survived. A total of 243 raw MS files (74 PFAS and 3 replicates), including seven control groups, were converted to the mzXML format. Nontargeted data analysis was accomplished with R scripts that are available on Github (https://github.com/huiUofT/PFASmetabolite). In brief, peak features were detected with the XCMS package (Smith et al. 2006). The peak features were matched across samples with a mass tolerance of and a RT window of 20 s, after RT adjustment. The ratio of abundances of each feature in treatment groups relative to the control group (DMSO) was calculated. The -values of the difference between two groups were determined by student’s -tests. Only the features exhibiting greater peak intensities (, ) in PFAS treatment groups than controls were considered as potential metabolites. Isotopic peaks and adducts were excluded by matching chromatographic peaks and using the theoretical mass difference. The final differentiated peak list from the output of the R program was manually checked using m/z and RT. Formula and structure prediction were focused on the predominant metabolites with peak intensities above . As for PFAS (i.e., short-chained FTOHs) with no abundant metabolite detected (), formula and structures were predicted for the top five metabolites even if their absolute peak abundances were low. Minor impurities from authentic standards are common challenges that confound metabolite identification. To tackle this, we used two strategies: a) For all metabolites detected in the zebrafish, we also checked the impurities in the corresponding authentic standards to assure the metabolites were not impurities, and b) metabolic pathways reported in previous literature were incorporated to confirm metabolites, for instance, PFOA detected at a low abundance in some zebrafish exposed to 6:2 FTOH, which was attributed to metabolites from 8:2 FTOH impurity. Chemical formulas for metabolites were set to contain up to 100 carbon (C), 200 hydrogen (H), 0–10 nitrogen (N), 30 oxygen (O), and 0–2 sulfur (S) atoms per molecule. The fluorine number was set to be for the PFAS with fluorine atoms in their formulas.
Confidence levels were assigned to all identities according to the scale developed by Schymanski et al. (2014). In brief, a level 1 confidence was assigned to PFAS for which authentic standards were available for confirmation by matching RT, MS, and MS/MS. For instance, some perfluoroalkyl carboxylate metabolites from FTOHs and amides were confirmed by authentic standards. In the case of PFAS metabolites where authentic standards were unavailable, the confidence level fell to levels 2 or 3, in which molecular ions and fragmentation were matched to predicted fragmentation pathways (i.e., ). For instance, for level 2, the structures were supported by diagnostic fragments, for example, for fluorotelomer carboxylic acids (Barrett et al. 2021). For level 3, the structures were supported by MS/MS spectra with less informative fragments, for example, for perfluorooctane sulfonamide quaternary ammonium salt (PFOSAmS) metabolites.
Identification of Taurine Conjugates by the Data-Independent Precursor Isolation and Characteristic Fragment Method
To identify the taurine conjugates in zebrafish larvae exposed to PFAS, we used the data-independent precursor isolation and characteristic fragment (DIPIC-Frag) method developed in previous studies (Peng et al. 2015, 2016) to enhance the coverage inspired by the detection of the characteristic fragment from taurine conjugates (, m/z 124.0063). Then, the taurine fragment peak was extracted from each AIF window across all 243 raw MS data. Once the taurine fragment peak was detected, corresponding precursor ions were identified from the same window and sample by aligning their chromatographic peaks. The precursor ions were further confirmed by their co-occurrences with the taurine fragment across samples. Once precursor ions were identified, the compound formulas and structures were predicted by interpreting high-resolution MS and MS/MS spectra, as mentioned above.
Statistical Analyses
GraphPad Prism (version 7.0.4; GraphPad Software) and R studio (version 1.1.456; R Studio Inc.) software was used, and an ANOVA with Dunnett tests was employed to evaluate the statistical significance of the percentage hatched and mortality rate. Exponential regressions were used to determine the relationships between bioconcentration factor (BCF) and binding affinities () to L-FABP. The binding affinities of 74 PFAS to L-FABP were recently determined by Yang et al. (2020). In a recombinant hCES1 hydrolysis assay, a one-way ANOVA was also used to analyze the differences between the concentrations of treatment and control groups. were deemed statistically significant in all tests. In the calculation of mean values, all values below the limit of detection were treated as one half of the appropriate MDL value. BCF was calculated for each PFAS by considering analyte concentration (Table S3) in larvae and their surrounding media (Equation 1) as described in previous studies (Sanz-Landaluze et al. 2015; Vogs et al. 2019).
| (1) |
where is the wet weight concentration of PFAS in zebrafish larvae (), and represents the concentrations of PFAS exposure media at 120 hpf (), respectively.
Results
Bioaccumulation of PFAS in Zebrafish Larvae
Among the 74 PFAS standards prepared in DMSO, 36 PFAS with ionizable moieties were detectable at under electrospray ionization (ESI). Eight of the 36 PFAS were not detectable in zebrafish larvae, owing to their low BCFs or poor instrumental sensitivities (Excel Table S2). Perfluoro-3,6,9-trioxatridecanoic acid (34) was detected in zebrafish larvae with the highest BCF of at the low-dose treatment (), followed by PFOSA (60, ) and PFOS (6, ) (Table S4). When bioaccumulations of PFAS were compared between low ()- and high-dose () treatments, BCFs were generally lower at the treatment (Figure S1A), particularly for highly accumulative PFAS, following a stepwise linear relationship. For instance, the BCF of perfluoro-3,6,9-trioxatridecanoic acid (34) at was 7.2-fold higher than at . Four PFAS (32, 5, 14, and 38), especially FTOH 32, showed comparable or even higher BCFs at (Figure S1B), indicating their differential bioaccumulation mechanisms (e.g., dominated by metabolism).
Although PFAS binding to L-FABP generally showed stronger bioaccumulation potentials in zebrafish larvae, no significant trend (, ) was observed between L-FABP binding affinities and BCF (Figure 1B). Particularly, compounds 5 and 16 were strongly bioaccumulated in zebrafish larvae but they were not identified as L-FABP ligands (Yang et al. 2020). Similarly, only a weak exponential relationship (, ) was detected between and BCFs [calculated by the U.S. EPA’s Estimation Programs Interface (EPI) Suite] (Figure 1C), whereas reaching a threshold of calculated appeared to be required for significant bioconcentration. Previous studies have reported the poor prediction accuracy of the EPI Suite for PFAS given that established models were mainly trained by nonfluorinated compounds (Arp et al. 2006). Considering this, we used RTs of PFAS on a C18 column to approximate hydrophobicity (Krokhin and Spicer 2009). A clear exponential relationship (, ) was found between BCFs and RTs of PFAS on a C18 HPLC column after excluding PFAS prone to metabolism, as rationalized below (Figure 1D).
Characterization of PFAS Metabolites
Notably, 8 of 74 PFAS, including 16 and 24, from five structural categories (Triangles in Figure 1D and as labeled in Figure 1E) were hypothesized to be prone to metabolism, considering their lower BCFs compared with perfluoroalkyl acids with similar RTs. Therefore, high-resolution MS–based nontargeted analysis was employed to characterize their metabolites. Sulfonamides are of particular interest because sulfonamides 60 (PFOSA) and 16 (NMe-FOSA) showed the strongest lethal effects on zebrafish larvae among the 74 PFAS (Figure 2A; Table S4). All zebrafish larvae were dead after exposure to of PFOSA for 5 d. The strong lethal effects of sulfonamides seem to be mediated by a specific mode of action given that similar effects were not observed for other PFAS with comparable or even higher BCFs (e.g., 34 and 36). Another sulfonamide, N-ethylperfluorooctanesulfonamide (NEt-FOSA, 24), did not cause significant lethal effects at despite its similar structure to PFOSA and NMe-FOSA. Nontargeted analysis revealed PFOS and PFOSA as the predominant metabolites from NMe-FOSA and NEt-FOSA (Figure S2). Higher abundances of metabolites including PFOS () and PFOSA () were detected in zebrafish larvae exposed to NEt-FOSA, compared with NMe-FOSA ( and PFOSA).
Figure 2.
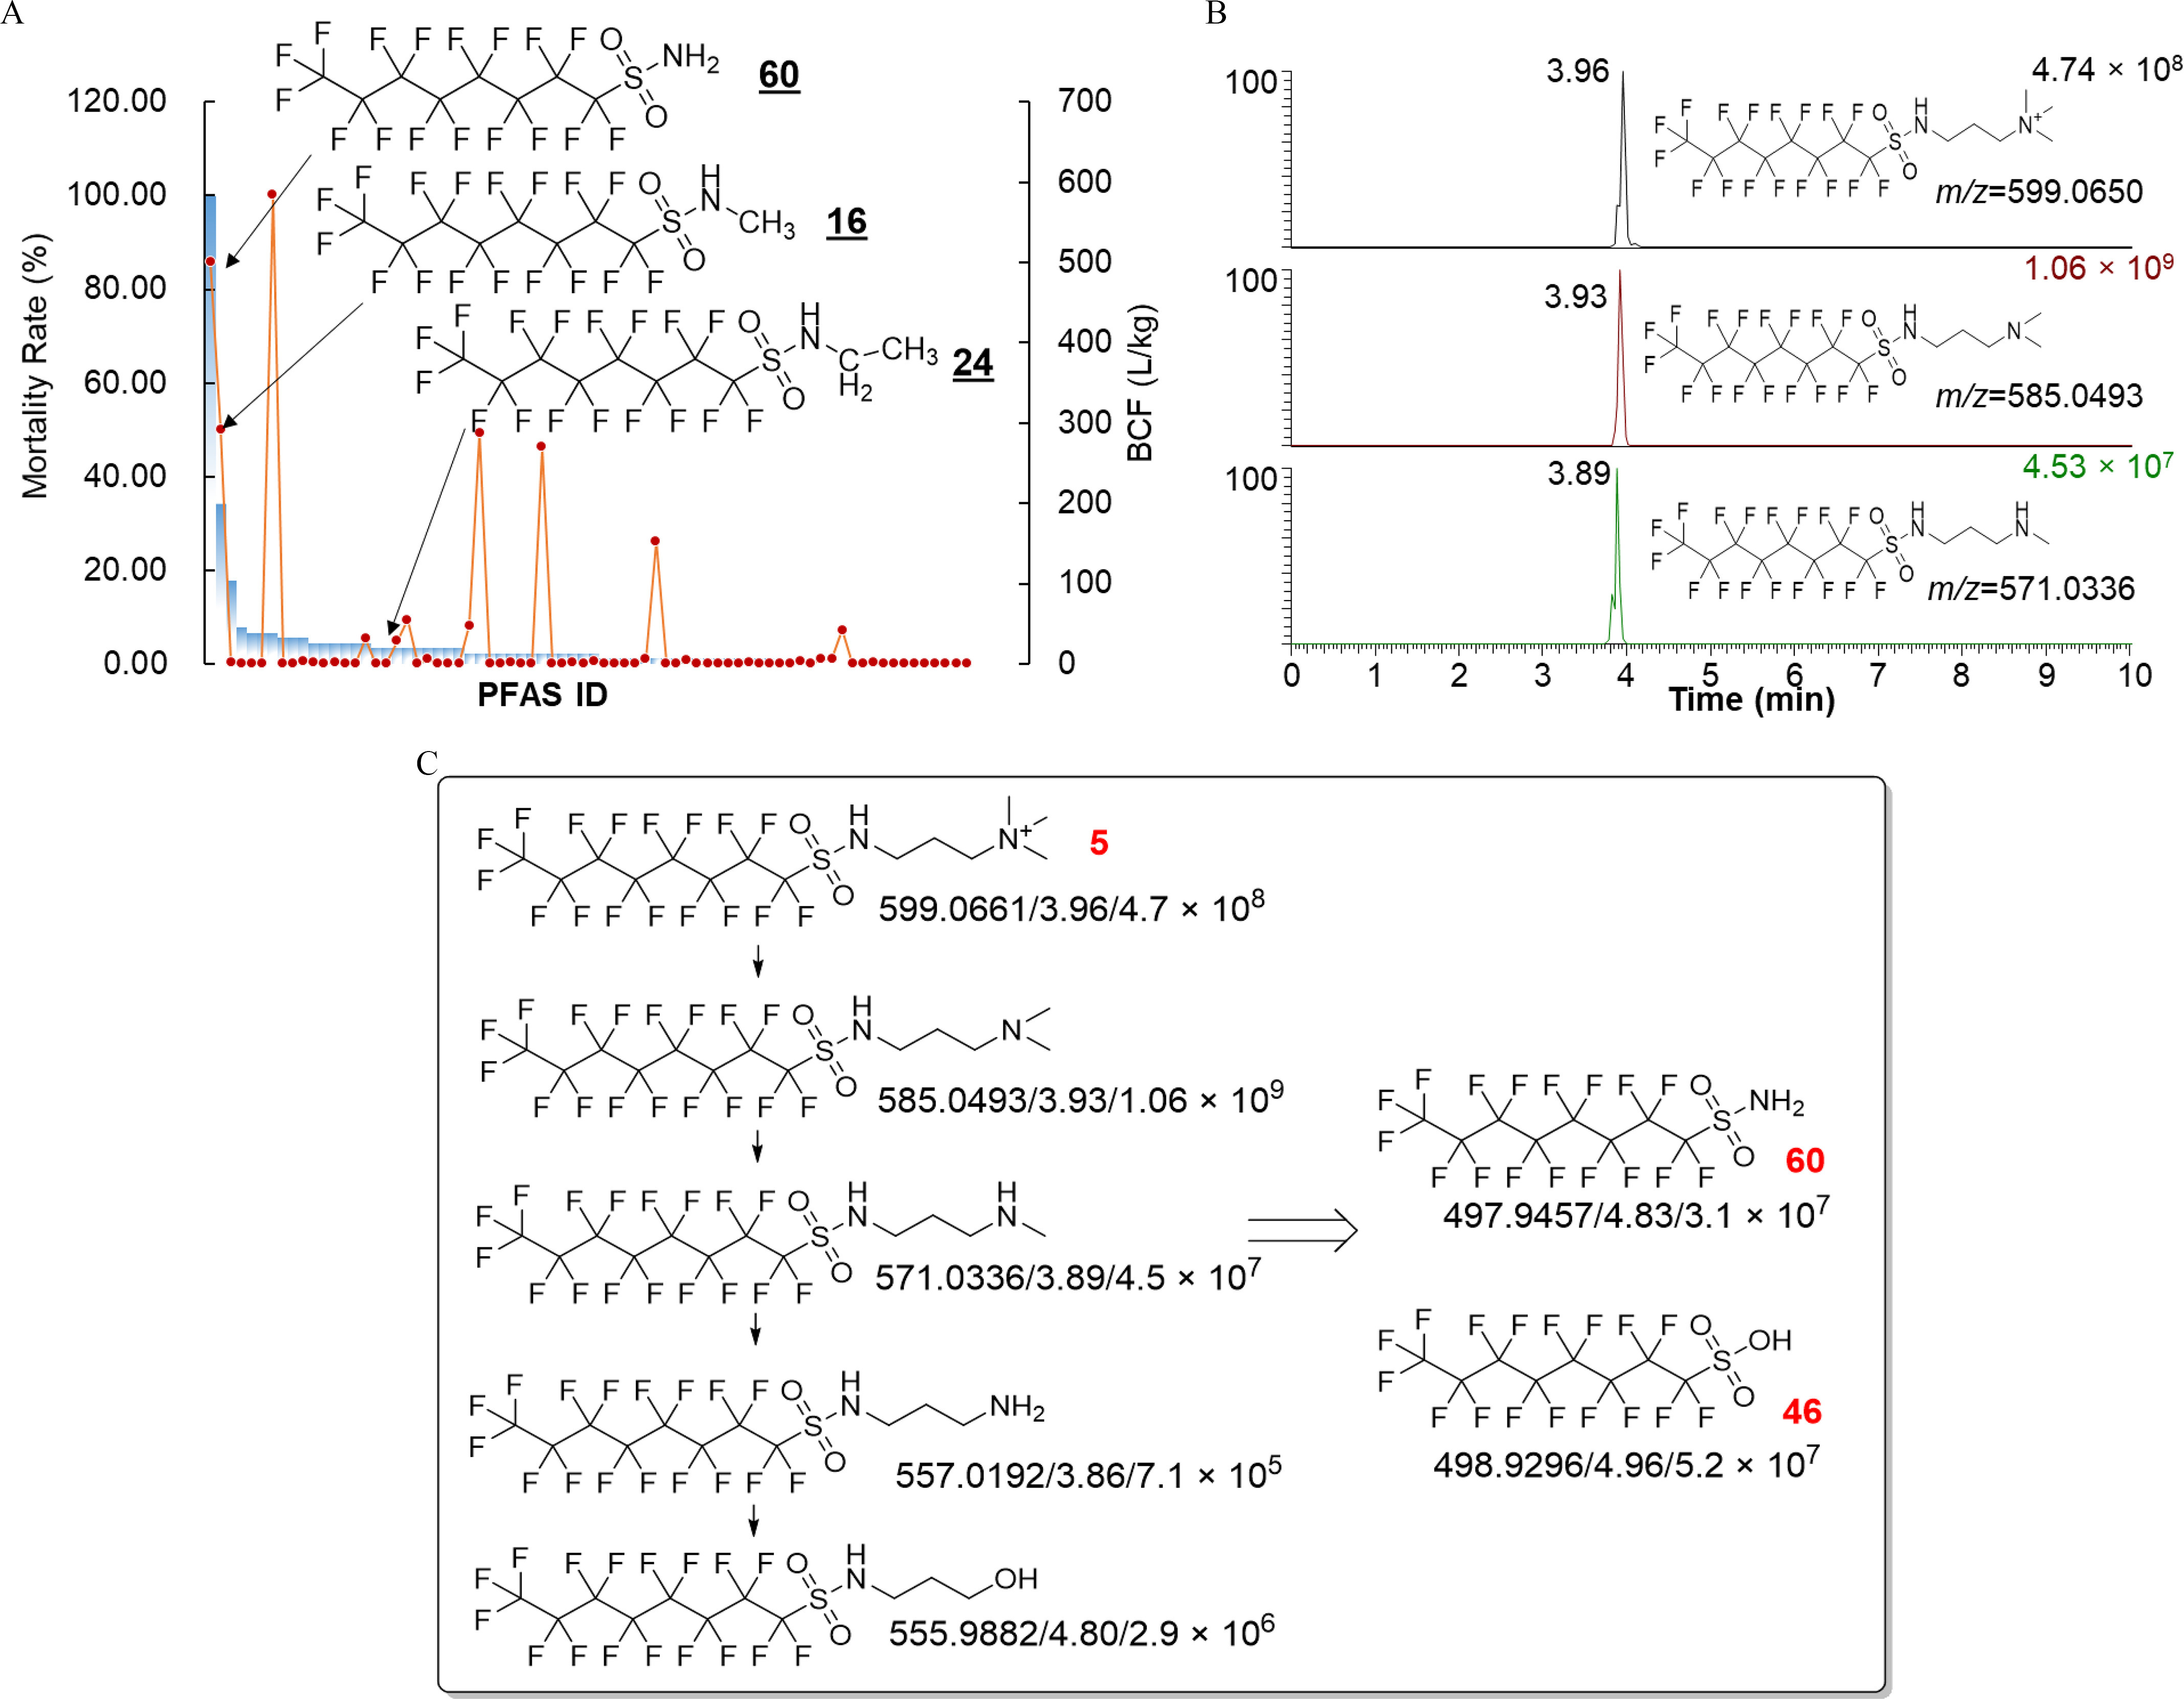
Lethal effects of sulfonamides and their metabolism pathways. (A) Mortality rates (percentage, blue bars) and BCFs (red closed circles) of PFAS. (B) Chromatograms of several high-abundant metabolites from perfluorooctane sulfonamide quaternary ammonium salt (PFOSAmS, 5). (C) Metabolism pathways of PFOSAmS (5) in zebrafish larvae. The exact mass, retention time, and peak intensity are shown for each detected metabolite. PFOS (46) and PFOSA (60) were confirmed with authentic standards (confidence level 1). The authentic standards of other metabolites were not available, so they were tentatively identified at confidence level 3. Note: BCF, bioconcentration factor; ID, identifier; PFOSA, perfluorooctanesulfonamide; PFAS, per- and polyfluoroalkyl substances; PFOS, perfluorooctanesulfonic acid.
Then, we applied a similar nontargeted analysis workflow to characterize the metabolism routes of PFOSAmS (5; Figure 2B), a common ingredient used in AFFF formulations (Barzen-Hanson et al. 2017), of which the metabolism routes remain unknown. Consistent with its relatively low BCF (), a total of 74 metabolite peak features were detected in zebrafish larvae exposed to of PFOSAmS by matching peaks across treatments and controls (see the “Materials and Methods” section). Sixteen high-abundant features were detected with peak abundances exceeding . The most abundant feature () detected at 3.93 min with was assigned as the tertiary amine product after demethylation (Figure 2B), with a formula of (). A further demethylated secondary amine metabolite was detected (3.89 min, ), albeit with lesser abundances (). In addition to the two most abundant metabolites, several other downstream metabolites, including PFOS and PFOSA, were also detected (Figure 2C). The proposed structures of the three most abundant metabolites were supported by characteristic fragments from MS/MS spectra (Figure S3).
Characterization of Metabolism Pathways of Perfluoroalkyl Carboxamides
Represented by chemical 38 (BCF of ), all four perfluoroalkyl carboxamides (19, 31, 38, and 58; structures shown in Figure 3A) showed very low bioaccumulation potentials () in zebrafish larvae. To investigate whether metabolism is responsible for their low bioaccumulation potentials, nontargeted analysis was employed to characterize potential metabolites. A carboxylate analog [perfluoroalkyl carboxylate (1H-PFHpA), ) was detected as the sole metabolite from amide 38 (Figure 3A; Figure S4), with relatively high peak abundances (). Similarly, corresponding carboxylate metabolites, perfluoropentanoic acid (PFPeA) and perfluorobutanoic acid (PFBA, 12), were also detected from two other perfluoroalkyl carboxamides, 19 and 31, respectively.
Figure 3.
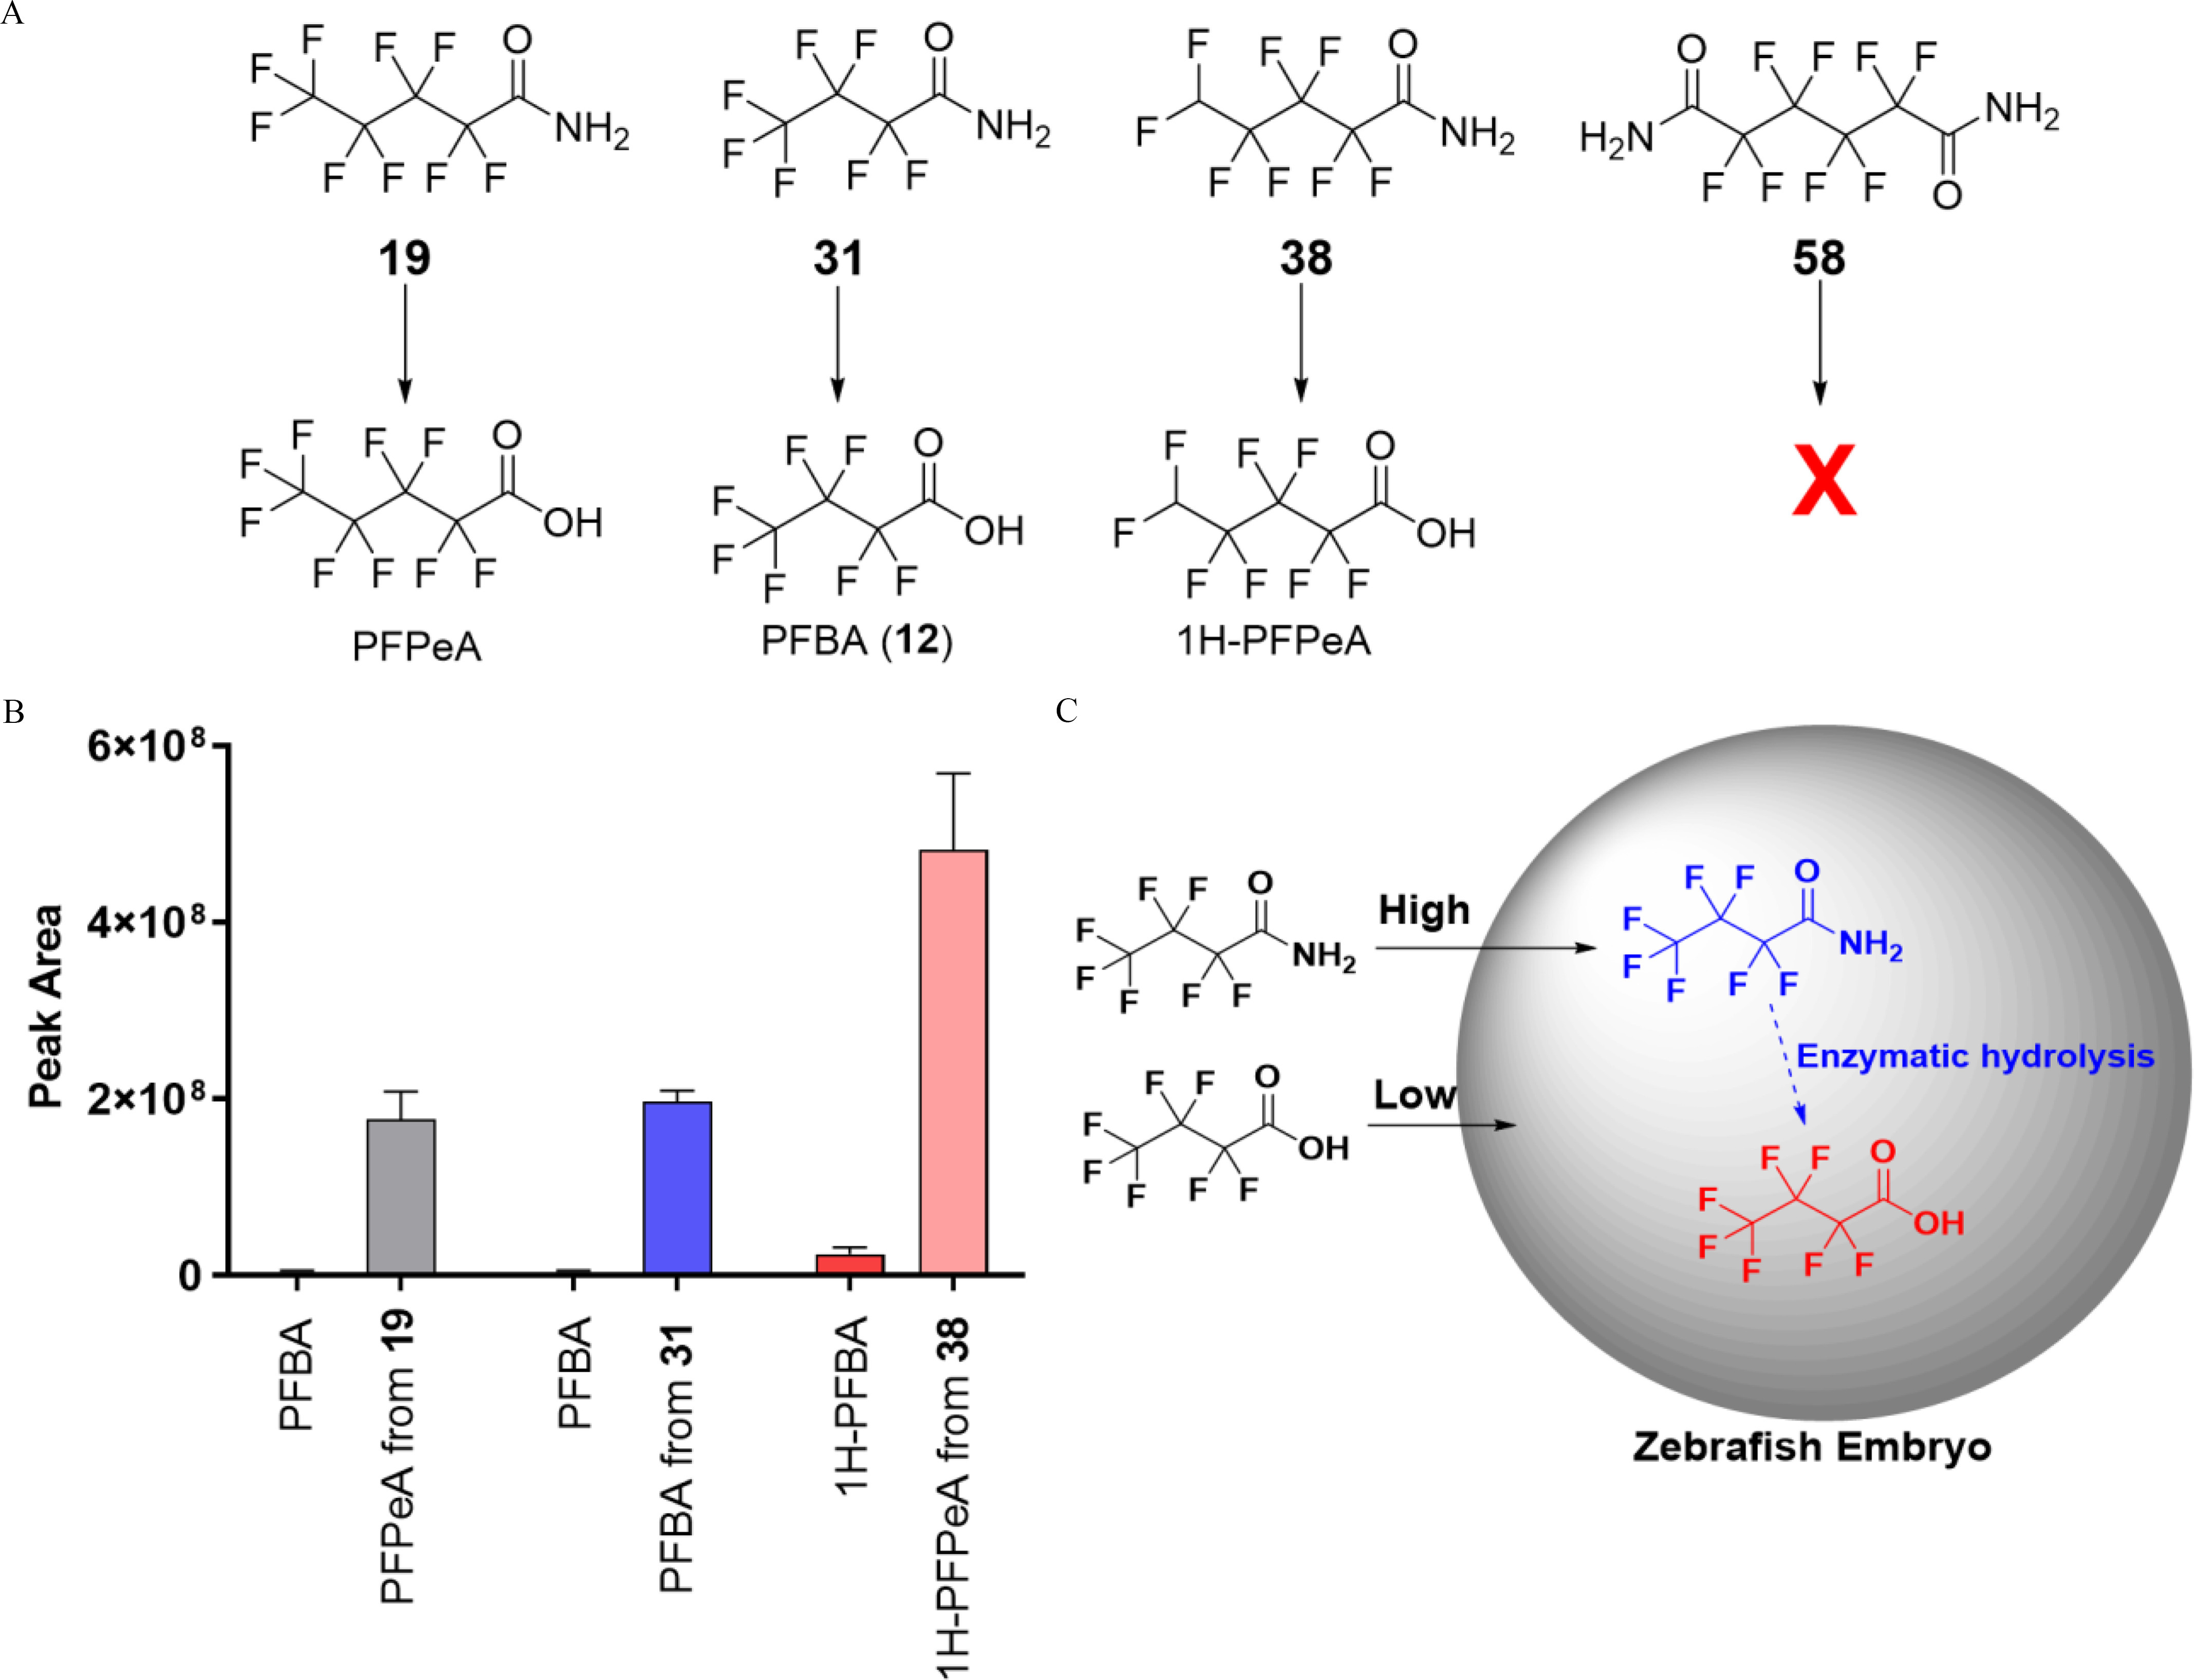
Metabolism of perfluoroalkyl carboxamides in zebrafish larvae. (A) Metabolism of carboxamides 19, 31, and 38 to corresponding shorter-chain PFCAs. (B) Levels of shorter-chain PFCAs derived from amide metabolism and direct exposure to perfluoroalkyl acids are indicated by their peak abundances. Bars represent (). The summary data can be found in Excel Table S3. (C) The proposed mechanisms for the enhanced bioaccumulations of shorter-chain PFCAs in zebrafish larvae via metabolism from perfluoroalkyl carboxamides. PFBA and PFPeA were confirmed with authentic standards (confidence level 1). The authentic standard of 1H-PFPeA was not available (confidence level 3). BCFs were not determined for PFPeA or 1H-PFPeA because they were not in the U.S. EPA’s PFAS library. PFBA and 1H-PFBA with similar structures are shown for comparison. Note: EPA, Environmental Protection Agency; PFBA, perfluorobutanoic acid; PFCA, perfluorinated carboxylic acid; PFPeA, perfluoropentanoic acid; SD, standard deviation.
Surprisingly, perfluoroalkyl carboxylate metabolites were detected with high concentrations in larvae exposed to perfluoroalkyl carboxamides. For instance, of PFBA were detected in zebrafish larvae exposed to of carboxamide 31, even higher than PFOA in zebrafish larvae () directly exposed to of PFOA. To investigate the mechanism, the concentrations of the analogs PFBA and 1H-PFBA were examined in zebrafish larvae directly exposed to of each of these shorter-chain PFCAs. Only minor concentrations were detected in zebrafish larvae at and , for PFBA and 1H-PFBA, respectively (Figure 3B; Figure S4). The BCFs () of shorter-chain PFCAs were one to two orders of magnitudes lower than those in zebrafish larvae exposed to corresponding perfluoroalkyl carboxamides (e.g., for PFBA from carboxamide 31).
To confirm the efficient biotransformation of polyfluoroalkyl carboxamides to shorter-chain PFCAs, we determined the kinetics by dosing carboxamides 19, 31, and 38 to zebrafish embryos and monitored parent carboxamides and corresponding PFCA metabolites across all development stages. Although the abundances of carboxamide 38 clearly decreased over time, the abundances of three short-chain PFCA metabolites correspondingly increased after 24 hpf (Figure S5), confirming the biotransformation of carboxamides to carboxylates.
Metabolism Pathways of FTOHs
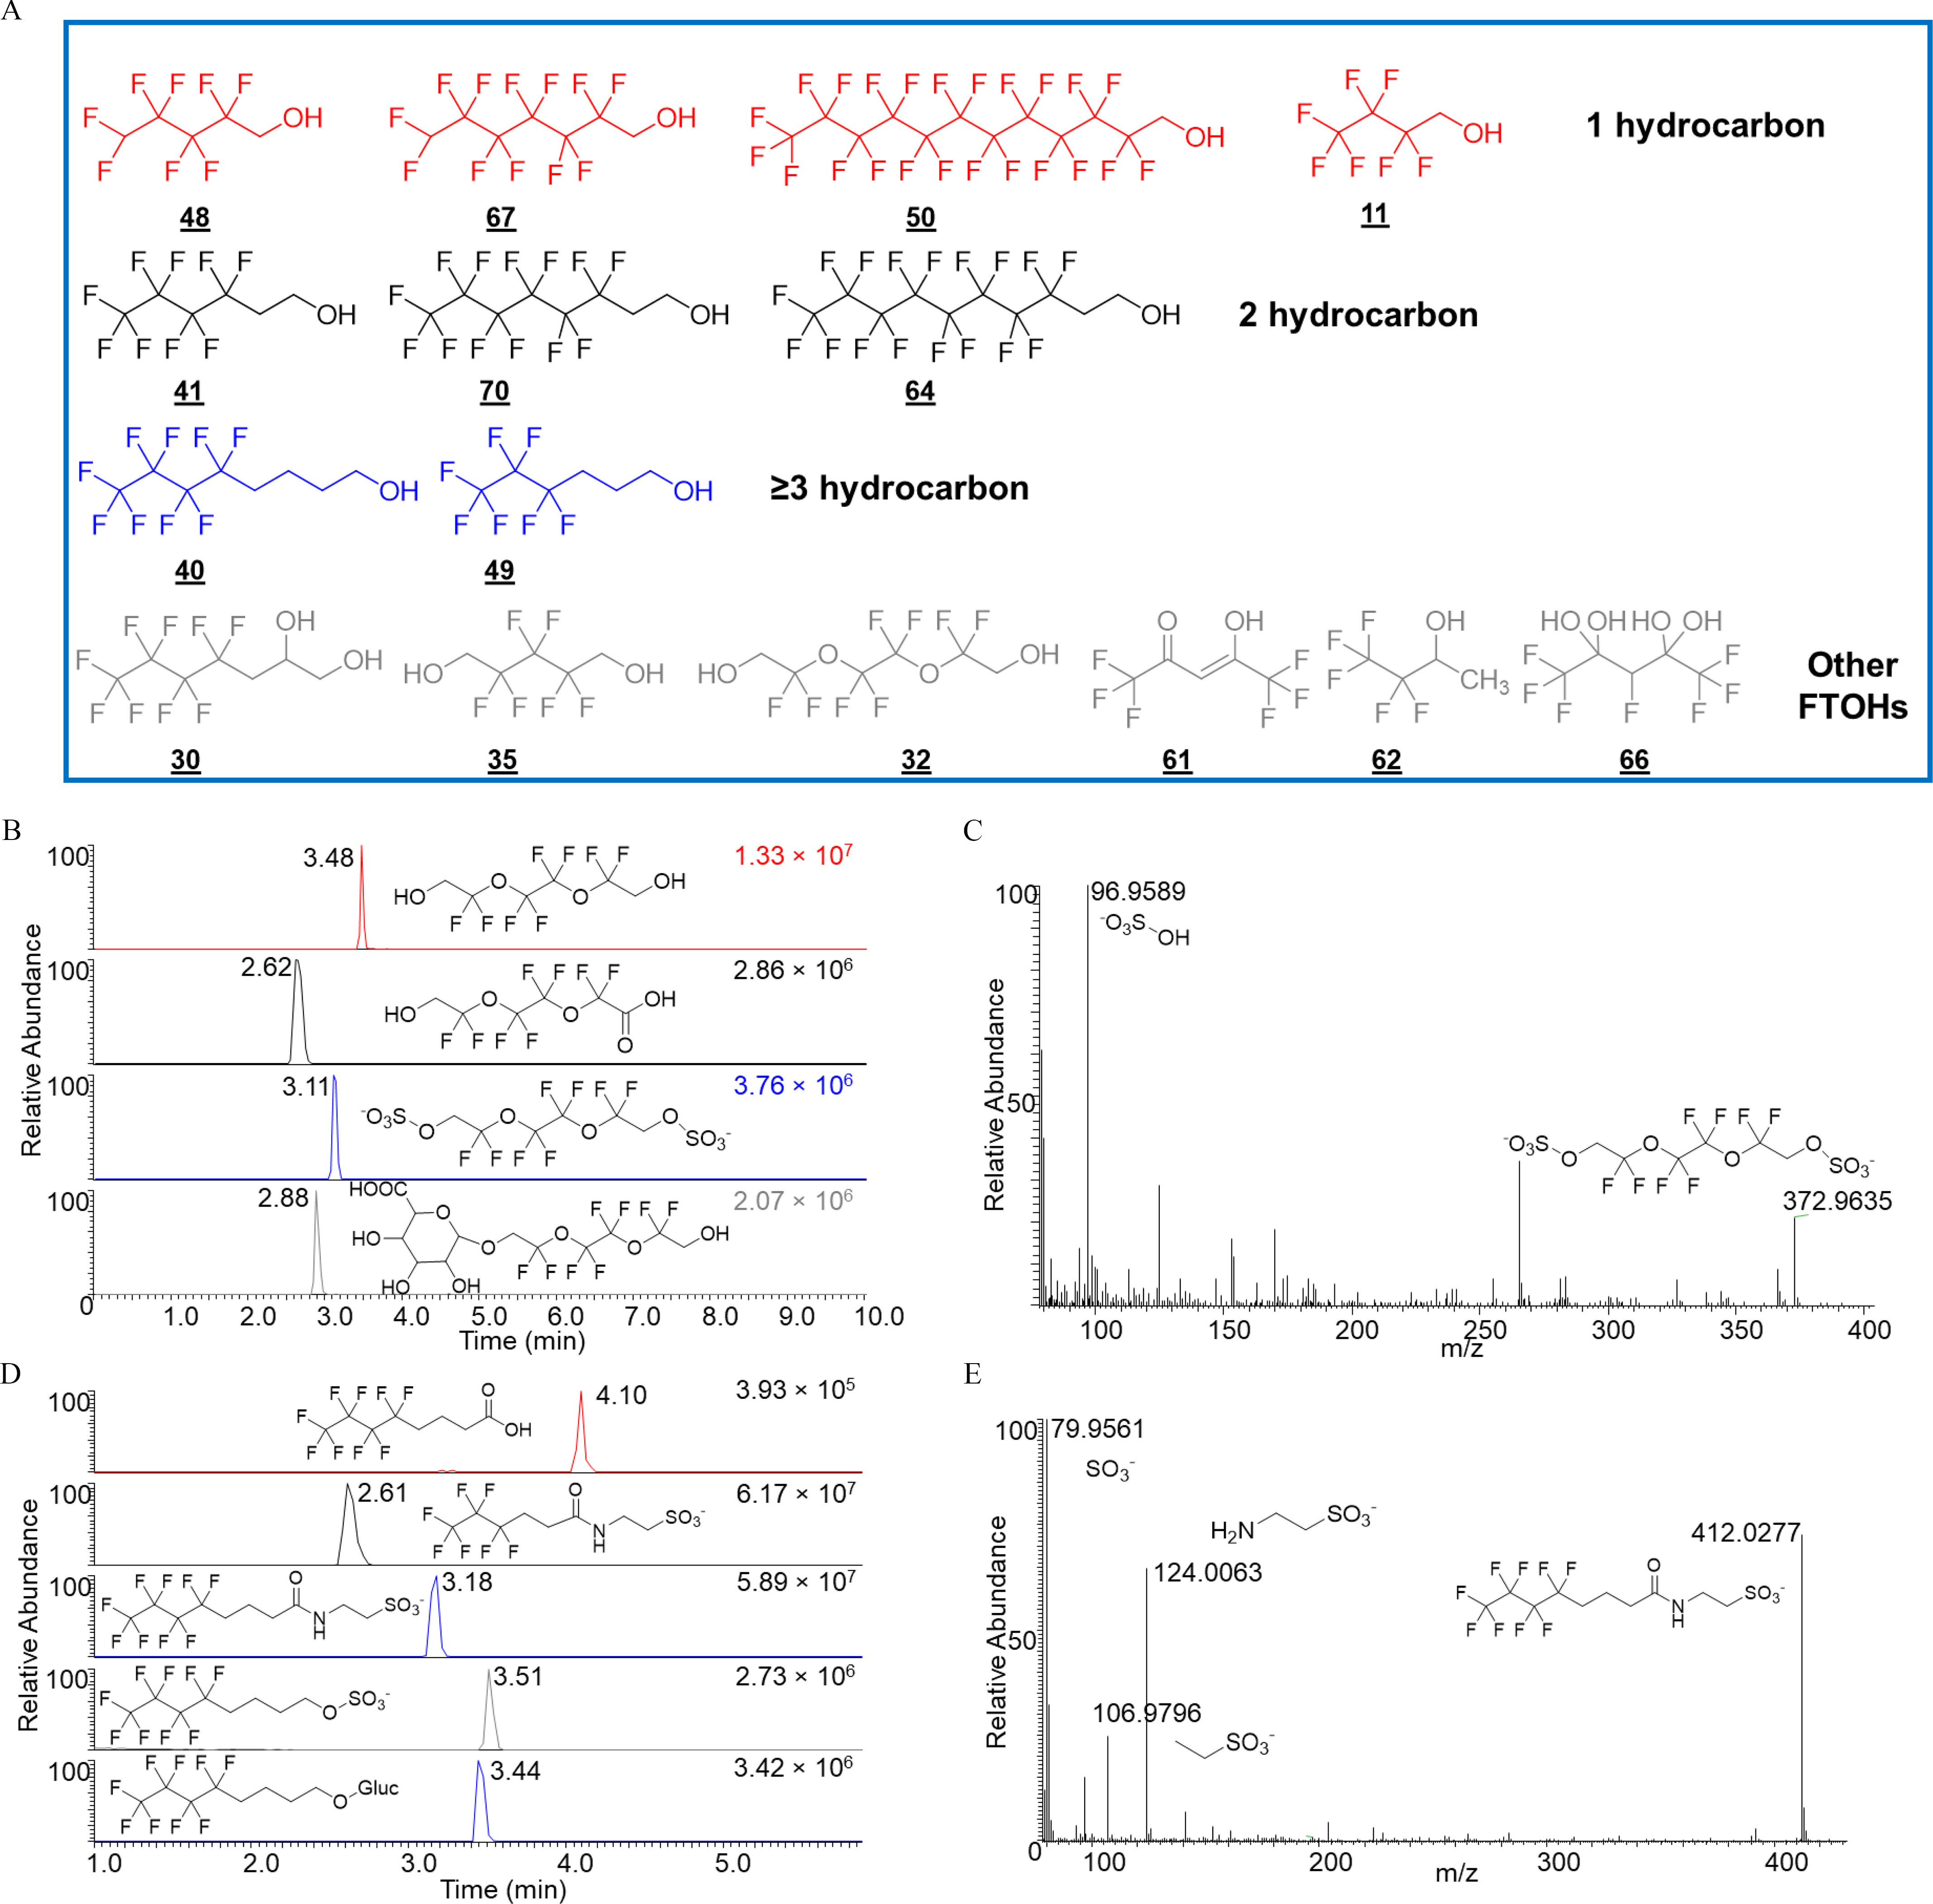
FTOHs are the biggest structural category included in this study, with 15 structurally diverse compounds being investigated (Figure 4A). This provided a unique opportunity to explore the structure-related metabolism pathways of FTOHs in zebrafish larvae. For proof of concept, we applied nontargeted analysis to characterize the metabolites of 8:2 FTOH (64), a well-studied FTOH. Well-known metabolites including PFOA and fluorotelomer unsaturated carboxylic acids (FTUCAs), as well as corresponding metabolites with cysteine adducts and sulfate and glucuronide conjugations, were detected in zebrafish larvae exposed to of 8:2 FTOH (Figure S6).
Figure 4.
Nontargeted identification of metabolites of FTOHs in zebrafish larvae. (A) Structures of 15 FTOHs investigated in the present study. Different colors represent varied numbers of hydrocarbons. (B) Chromatograms of three major metabolites from FTOH 32. (C) Representative MS/MS spectra of sulfate conjugate of FTOH 32. (D) Chromatograms of five major metabolites from 4:4 FTOH (40). (E) Representative MS/MS spectra of the taurine conjugate of 4:4 FTOH (40). Note that the fragment of taurine () was detected with high abundance. All metabolites were tentatively identified at confidence level 3. Note: FTOH, fluorotelomer alcohol; MS/MS, tandem mass spectrometry.
Nontargeted analysis was then applied to characterize the metabolism pathways of a novel FTOH (32) with two alcohol groups. Similar to 8:2 FTOH, carboxylate and sulfate and glucuronide conjugates were detected, albeit with lesser abundances than the parent FTOH (Figure 4B). The detection of the sulfate conjugate was supported by its high-resolution tandem MS spectra with a characteristic fragment of hydrogen sulfate (Figure 4C). The results clearly reflected the broad substrate specificity of Phase II enzymes. Not surprisingly, in contrast to 8:2 FTOH, carbon–carbon bond cleavage via a pathway was not observed for perfluoroalkyl carboxylate produced from FTOH (32).
1H-PFHpA was also detected from another single hydrocarbon 1H - 6:1 FTOH (67), together with two other Phase II metabolites (Figure S7). The peak abundance () of 1H-PFHpA was comparable to a sulfate conjugate () but significantly lower than a glucuronide conjugate (, ). Compared with FTOH 67, the ether FTOH (32) produced relatively high abundances of terminal perfluoroalkyl carboxylates.
In contrast to 8:2 FTOH, FTOH 32, and 1H-6:1 FTOH, polyfluoroalkyl carboxylates were only detected in minor amounts among metabolite features from 4:4 FTOH (40; Figure S7), a FTOH with four hydrocarbons. Instead, in addition to sulfate and glucuronide conjugates, another high-abundant metabolite was detected at and (Figure 4D). Elemental composition predicted this metabolite as a taurine conjugate of its corresponding carboxylate, which was supported by MS/MS spectra with a characteristic fragment of taurine at (Figure 4E). Similarly, another taurine conjugate was also detected with high abundance at .
As exemplified by the four FTOHs, their metabolism pathways varied largely depending on the number of hydrocarbons and the number of ether bonds (Figure 5A). For instance, carboxylates were detected as the predominant metabolites from FTOH 32, followed by Phase II conjugates, but taurine conjugates were not detected (Figure 5B). The profile of metabolites from a FTOH containing more hydrocarbons, 4:4 FTOH (40), was completely reversed, with a taurine conjugate detected as the most abundant metabolite. Similar trends were also observed for other FTOHs, as shown in Table S6. For instance, taurine conjugates were also detected as the predominant metabolites from FTOH (49) with three hydrocarbons, but not for 10 other FTOHs with one to two hydrocarbons.
Figure 5.
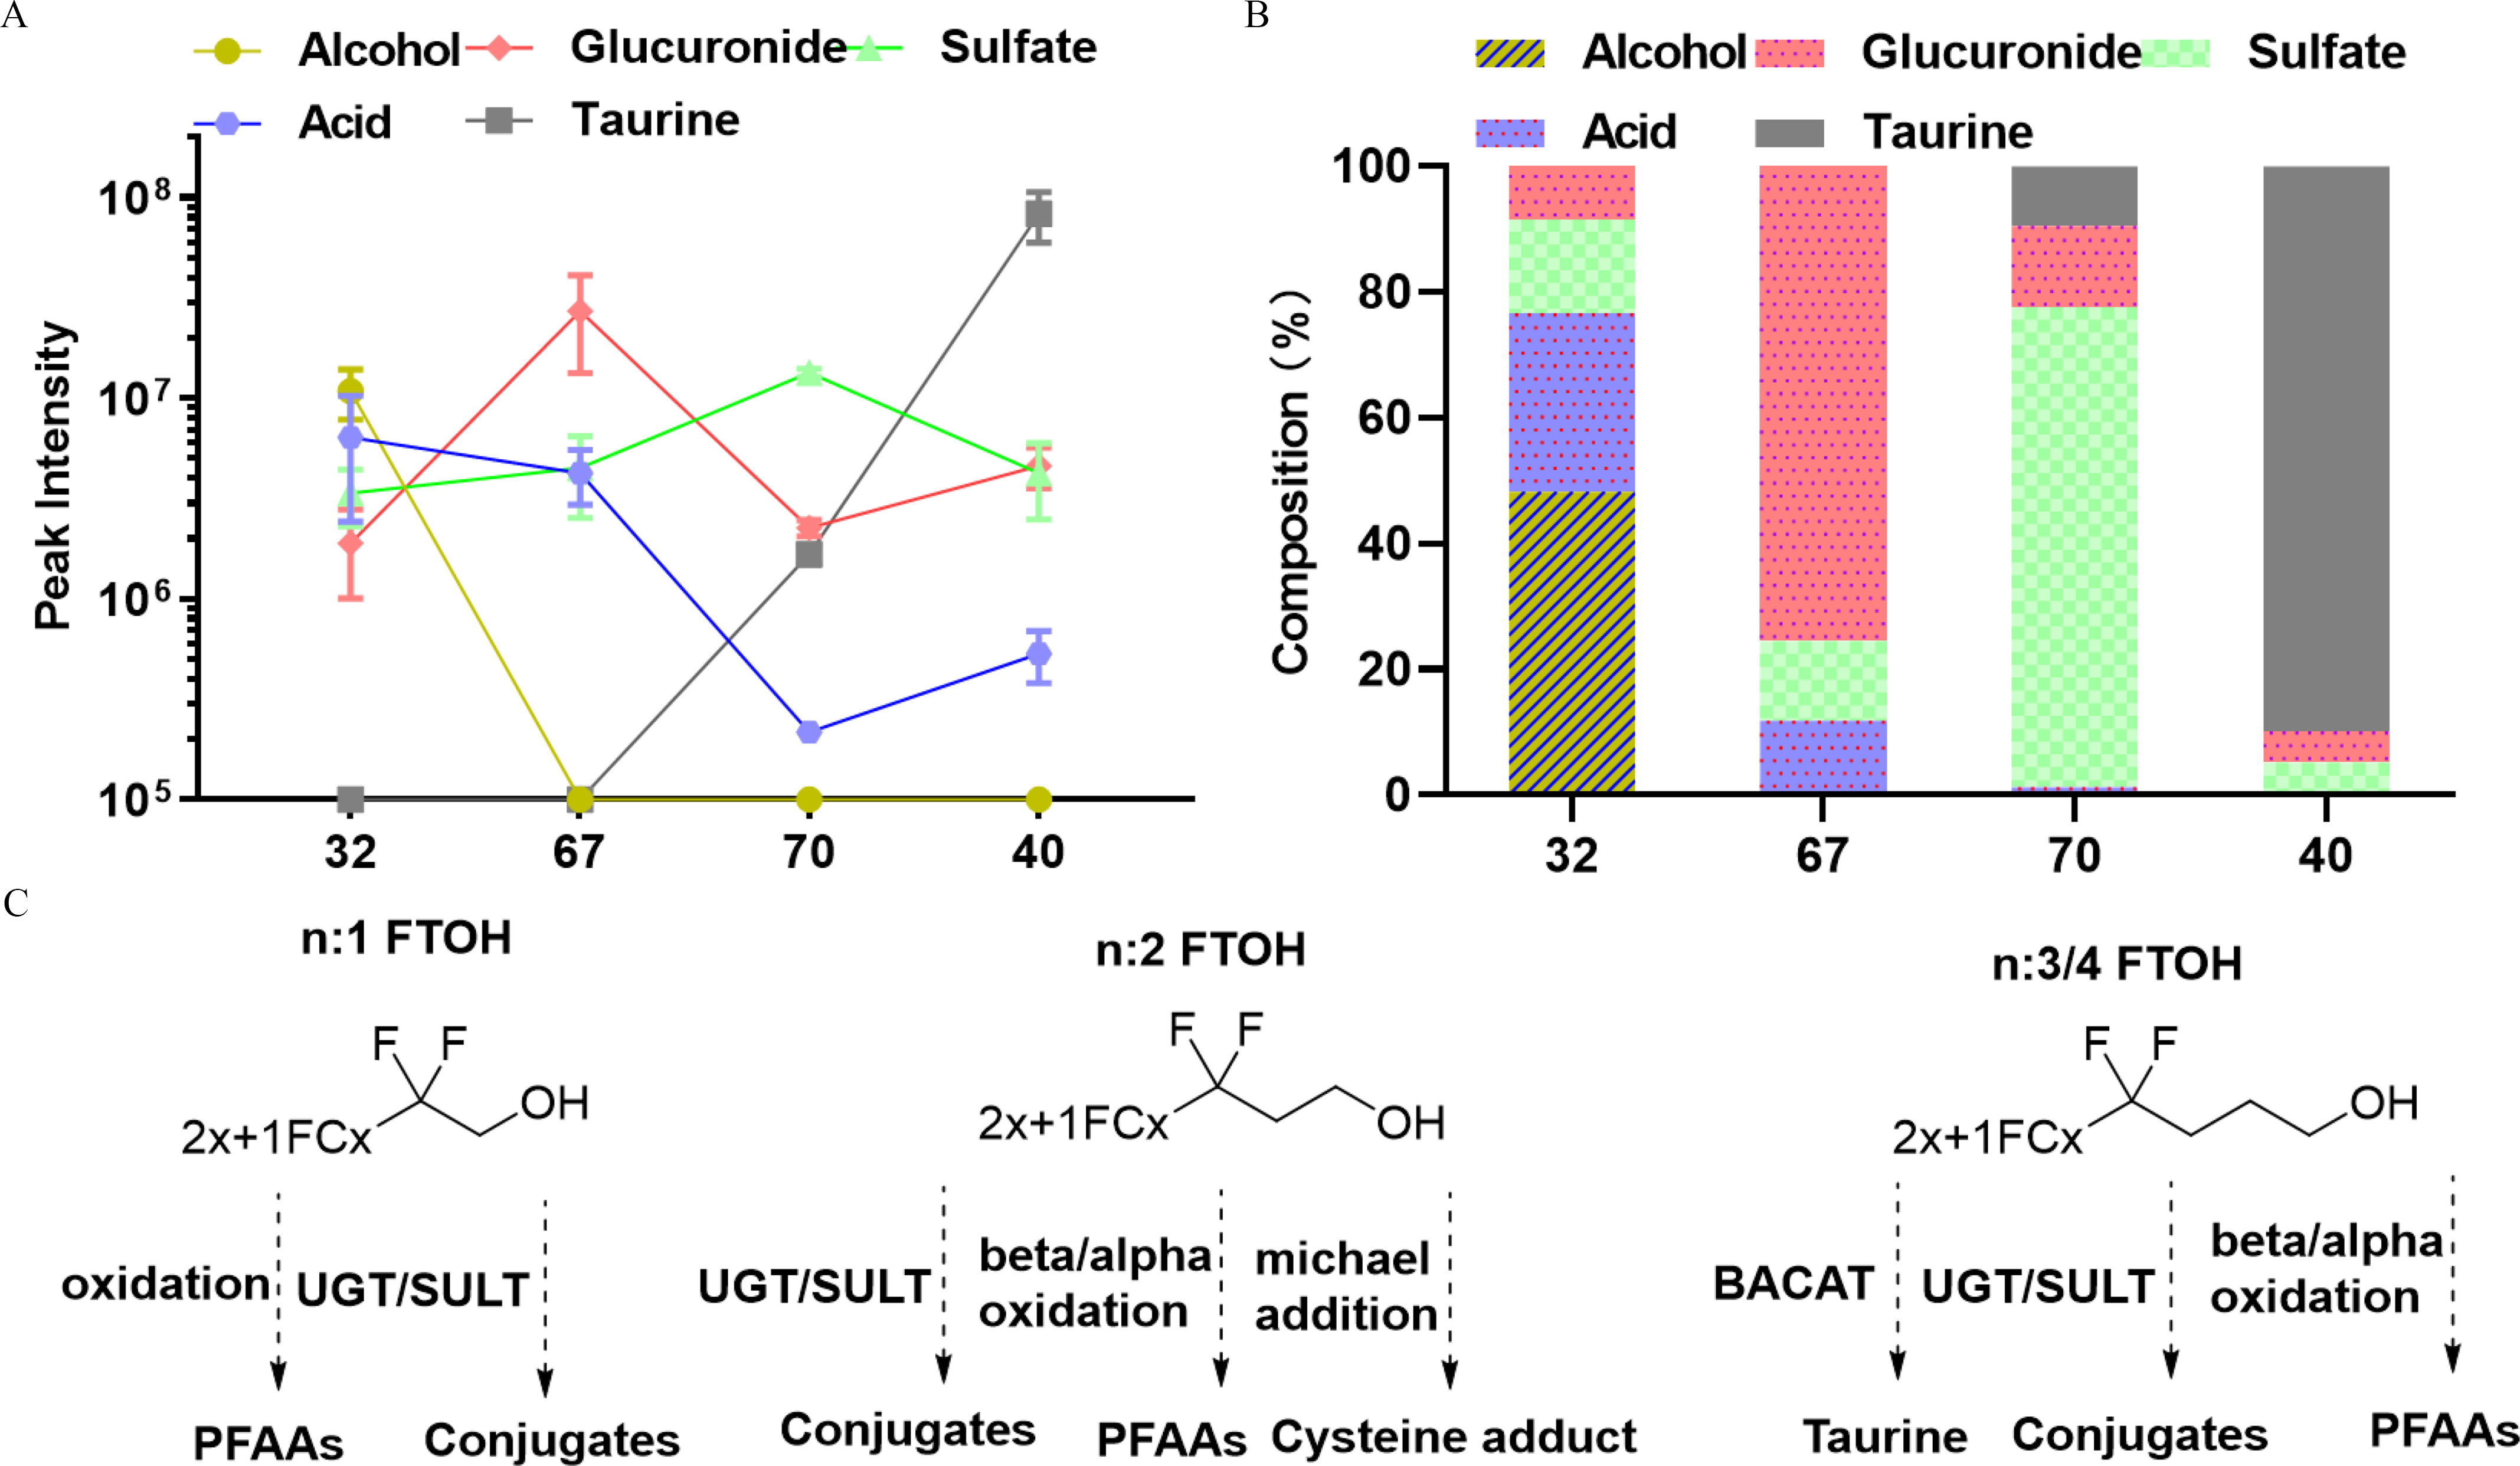
The metabolism pathways of FTOHs. (A) The peak intensities of FTOHs and their four major metabolites. Note that chemicals 32 and 67 are :1 FTOH, chemical 70 is :2 FTOH, and chemical 40 is :4 FTOH. Closed circles represent (). (B) The profiles of metabolites across four FTOHs. (C) Proposed metabolism pathways for FTOHs with different numbers of hydrocarbons. The summary data can be found in the Supplemental Data (Excel Table S4 and S5). 2x+1FCx, x represents the number of carbon atoms. Note: BACAT, bile acid-CoA:amino acid N-acyltransferase; FTOH, fluorotelomer alcohol; PFAA, perfluoroalkyl acids; SULT, sulfotransferases; UGT, UDP-glucuronosyltransferase.
Identification of Taurine Conjugates Using the DIPIC-Frag Method
Because of the unexpected high abundance of taurine conjugates, we sought to identify the potential formation of taurine conjugates from all 74 PFAS. A characteristic fragment of taurine was detected as the most abundant product ion from the taurine conjugate of FTOH 40, as mentioned above; therefore, we opted to use the DIPIC-Frag method developed in our previous studies (Peng et al. 2015, 2016) to specifically identify taurine conjugates by monitoring a taurine fragment () from DIA windows.
Among 74 PFAS, taurine conjugates were detected from 6 PFAS including 3 FTOHs (30, 40, and 49), 2 polyfluoroalkyl carboxylates (14 and 56), and 1 carboxyester compound (39). Consistent with the results above, all 6 PFAS producing taurine conjugates contain at least three hydrocarbons. Among 13 PFCAs and 5 PFSAs, taurine conjugates were detected from 2 carboxylates (14 and 56) by the DIPIC-Frag method. Two taurine conjugates were detected from 5:3 FTCA (14) (Figure 6A), with a high-abundant peak () at the RT of 3.36 min, and another lower abundant peak () at the RT of 3.22 min. Precursor ions were assigned as () and 464.0063 (), respectively, by aligning chromatographic peaks of the taurine fragment and putative ions from MS spectra (see the “Materials and Methods” section). According to exact masses, the two metabolites were predicted as taurine conjugates of the original 5:3 FTCA and hydroxylated 5:3 FTCA. With this information, we proposed the metabolism scheme of 5:3 FTCA as a step to produce unsaturated and hydroxylated carboxylates, followed by taurine conjugation (Figure 6B). Notably, taurine conjugates were not detected for unsaturated carboxylates, further confirming the high substrate specificity of taurine conjugation enzymes. Supporting this, a taurine conjugate was detected for another unsaturated polyfluorinated carboxylate (56), but only after saturation (Figure S8).
Figure 6.
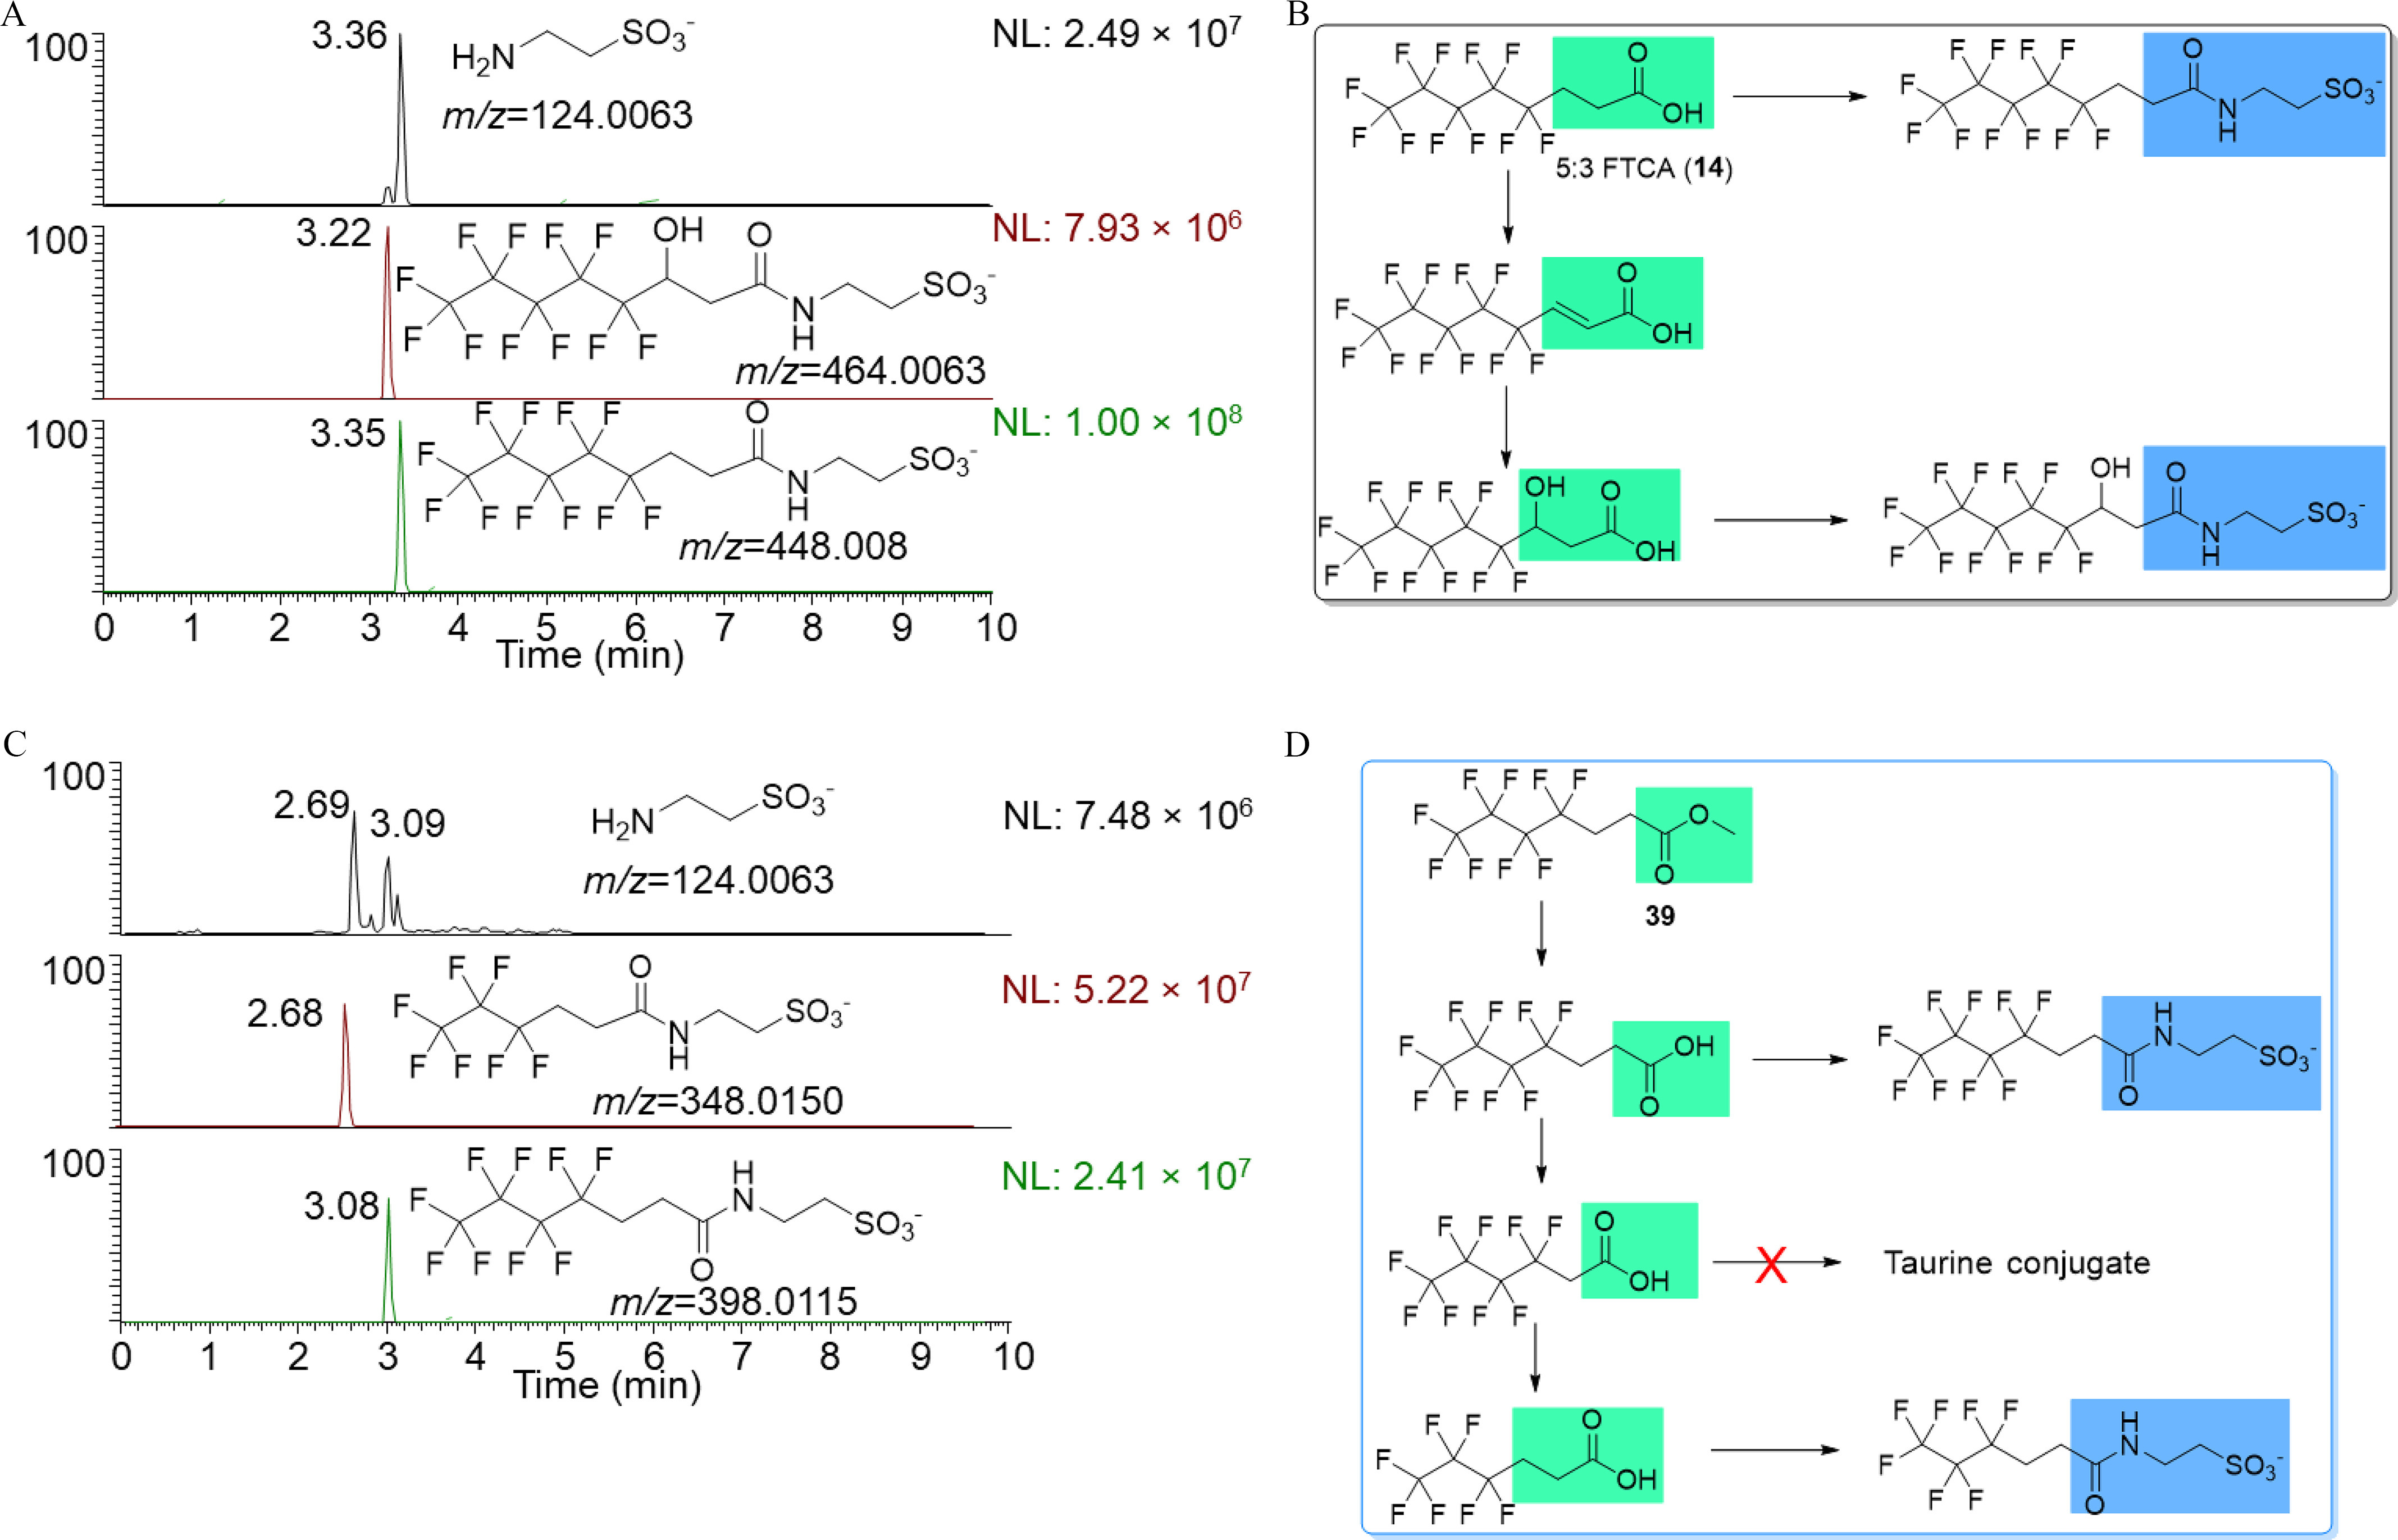
Taurine conjugates were detected from carboxylic acid and ester compounds by the DIPIC-Frag method. (A) Detection of two taurine conjugates (retention times are 3.22 and 3.36 min) from the 5:3 FTCA (14). (B) The proposed metabolism pathways of 5:3 FTCA (14). (C) Detection of two major taurine conjugates (retention times are 2.69 and 3.09 min, respectively) from the ester compound 39. (D) The proposed metabolism pathways of compound 39 via and taurine conjugation. The authentic standards of all metabolites were not available (confidence level 3). Note: DIPIC-Frag, data-independent precursor isolation and characteristic fragment; FTCA, fluorotelomer carboxylic acid.
Taurine conjugates were also detected for one carboxyester compound (39) among four examined carboxyesters, with two predominant peaks at RTs of 2.69 and 3.09 min (Figure 6C). Precursor ions were assigned as and 398.0115, corresponding to taurine conjugates of two carboxylates. This clearly demonstrated the hydrolysis of an ester bond of PFAS (39) in zebrafish larvae to form carboxylates, followed by and taurine conjugation (Figure 6D). Consistent with the results from FTOHs and PFCAs, as mentioned above, a taurine conjugate was not detected for an intermediate polyfluoroalkyl carboxylate with two hydrocarbons during .
Hydrolysis of 11 PFAS by hCES1
As mentioned above, hydrolysis was found to be a common metabolism pathway for diverse PFAS—including sulfonamides, carboxamides, and carboxyesters—in zebrafish larvae. Particularly, among four carboxyester compounds, in addition to compound 39, hydrolysis products (i.e., sulfated 6:2 FTOH) were also detected in zebrafish larvae exposed to carboxyester compound 2 (Figure S9), but not from 36 or 47. The in vivo results clearly demonstrated the variation of hydrolysis rates among and within structural categories. Therefore, we proceeded to determine whether liver CESs, a class of major xenobiotic hydrolysis enzymes with broad substrate specificity, would catalyze the hydrolysis of diverse PFAS. Because recombinant zebrafish CES is not available, we decided to use hCES1 to evaluate the structure-related hydrolysis of 11 PFAS, including 2 sulfonamides, 4 carboxamides, 3 carboxyesters, and 2 sulfonate esters.
The hydrolysis of 11 PFAS by hCES1 was observed to be highly related to structure, with only 2 perfluoroalkyl carboxamides, 19 () and 38 (), being significantly hydrolyzed, as indicated by the reduction in their amounts (Figure 7A). Particularly, carboxamide 19 was completely metabolized after incubation with hCES1 for 24 h, whereas carboxamide 38 was hydrolyzed by . The efficient hydrolysis of carboxamide 19 was confirmed at three different concentrations (1, 10, and ), whereas a smaller hydrolysis percentage was observed at , probably due to saturation of enzyme (Figure S10). Supporting this, high concentrations of hydrolysis products were detected from of carboxamides 19 (PFHpA, ) and 38 (1H-PFHpA, ) (Figure 7B; Figure S11). A hydrolysis product, PFBA, was also detected from carboxamide 31, albeit with a lesser amount at , but not from carboxamide 58. This is consistent with the in vivo experimental results wherein high abundances of metabolized carboxylates were detected in zebrafish larvae exposed to carboxamides 19, 38, and 31, but not from 58. A minor amount () of hydrolysis product was detected from carboxyester 39 (Figure 7B; Figure S11), another PFAS showing in vivo hydrolysis in zebrafish larvae. Hydrolysis products were not detected from carboxamide 58, carboxyesters 36 and 47, or sulfonate esters 10 and 13, which is also consistent with the in vivo experimental results that metabolites were not detected for these five PFAS.
Figure 7.
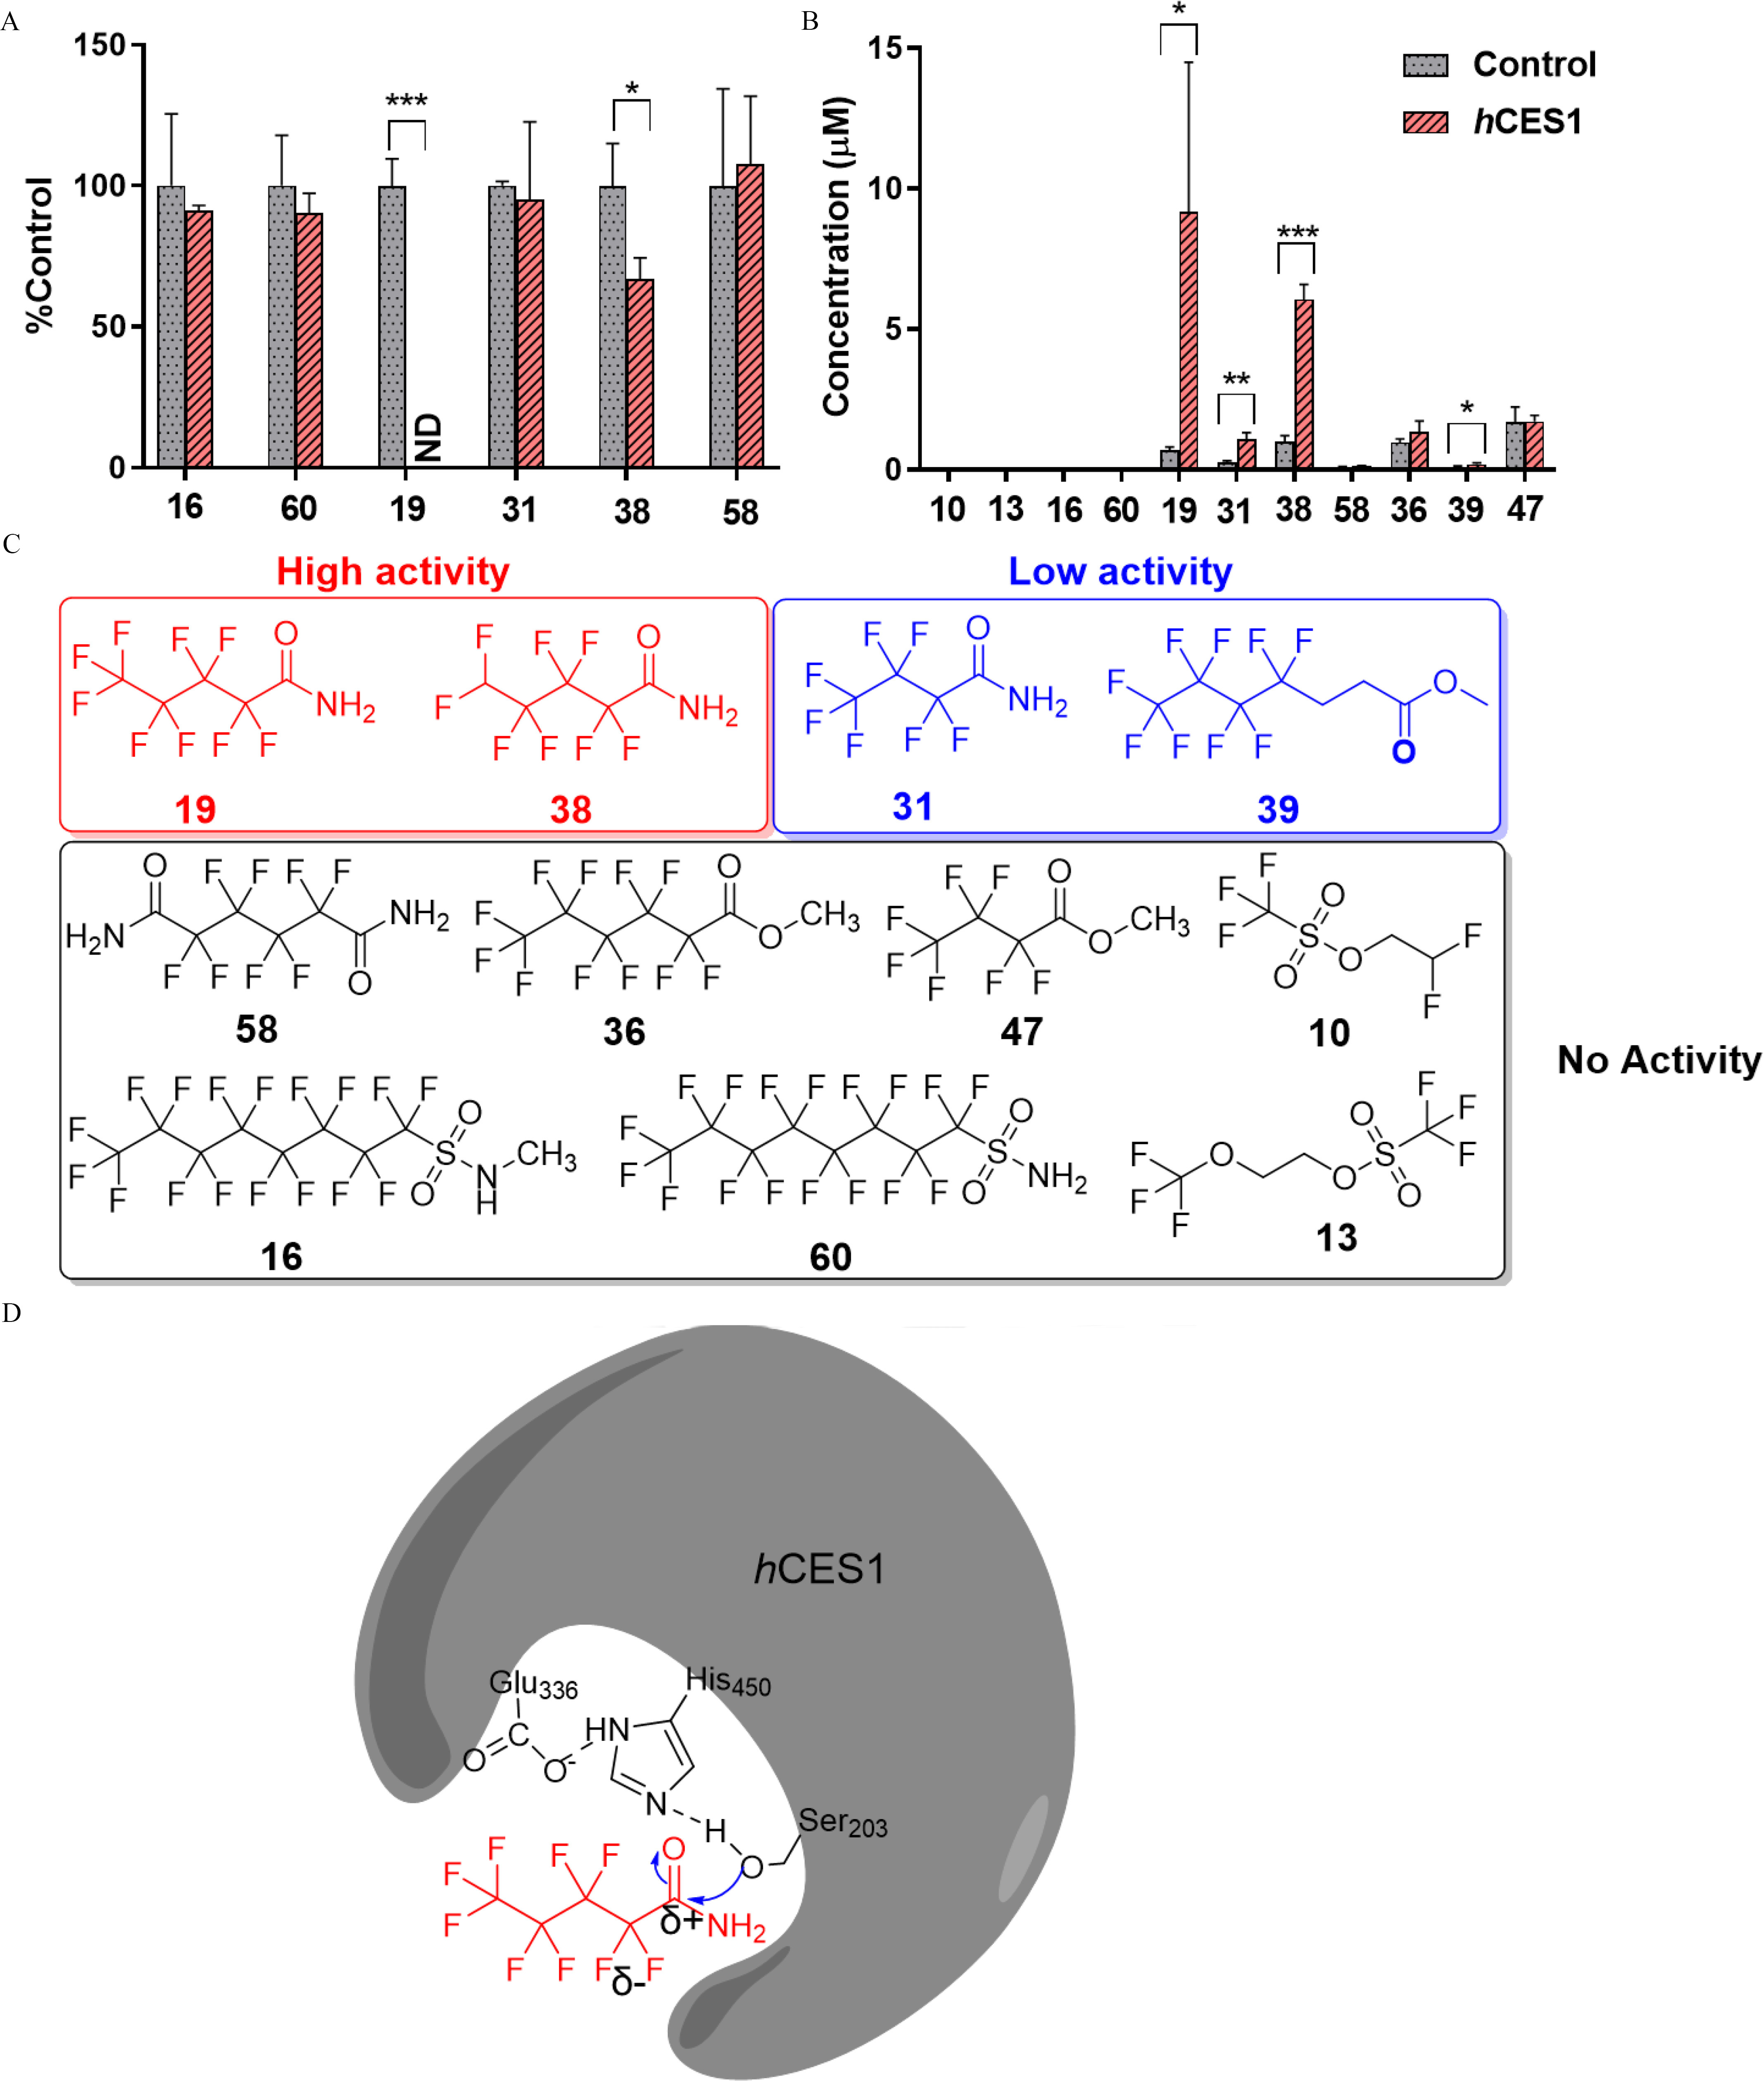
Hydrolysis of 11 biodegradable PFAS by recombinant human liver carboxylesterase 1 (hCES1). Reaction mixtures contained of each selected PFAS and hCES1 was incubated with phosphate buffer at 37°C for 1 h. Three replicates were used for each PFAS. (A) The percentages of parent PFAS hydrolyzed by hCES1. Note that the difference in hydrolysis between control and hCES1 for carboxamides 19 and 38 were statistically significant. (B) The concentrations of corresponding hydrolysis products detected from of parent compounds. One-way ANOVA with Dunnett tests was employed for the statistical test. *, ; **, ; and ***, . Bars represent (). (C) Grouping 11 PFAS into high, low, and no hydrolysis activity catalyzed by hCES1. (D) Proposed mechanism of PFAS hydrolyzation by hCES1. We hypothesized that the electronegative fluorines on the decrease the electron density of the amide moiety, for nucleophilic attack by Ser 203 on hCES1, which eventually leads to high hydrolytic activity of perfluoroalkyl carboxamides. Dashed lines represent electron donation from Glu336, and His450. The summary data for (A) and (B) can be found in Excel Tables S6 and S7, respectively. Note: ANOVA, analysis of variance; PFAS, per- and polyfluoroalkyl substances; SD, standard deviation.
According to hydrolysis rates with recombinant hCES1, 11 PFAS were grouped into compounds with high activity, low activity, and no activity (Figure 7C). Three carboxamides—19, 38, and 31—were grouped into high activity or low activity, whereas hCES1 hydrolytic activity was not detected for sulfonamides. Only one of the three carboxyester compounds, 39, was hydrolyzed by recombinant hCES1, with much lower yields of metabolites than amides.
Discussion
Nontargeted analysis has revealed the existence of thousands of PFAS in the environment (Gebbink et al. 2017; Liu et al. 2015; Newton et al. 2017; Wang et al. 2018), and prioritization of such PFAS according to their potential risks is of great importance. However, understanding the toxicokinetics of PFAS for risk assessment is challenging owing to their vast structural diversity. In this study, we systematically investigated the bioaccumulations, toxicities, and metabolism pathways of 74 structurally diverse PFAS in early life stages of zebrafish. In addition to hydrophobicity, we found that metabolism plays a vital role in determining the bioaccumulation of diverse PFAS grouped into five structural categories. We believe that the detailed structure-related metabolism routes of PFAS established in this study will provide an important starting point to inform the health risks of diverse PFAS in the environment.
PFAS Bioaccumulation Mechanisms
L-FABP is mainly expressed in liver, and previous studies have reported the importance of L-FABP in regulating tissue-to-liver partitioning (Cao et al. 2019). However, the contribution of the liver is only a minor fraction in terms of whole-body PFAS burdens, thus specific binding to L-FABP may not be primarily responsible for the bioaccumulations of diverse PFAS in zebrafish larvae. The simultaneous determination of L-FABP binding affinities (Yang et al. 2020) and BCFs for 74 PFAS provided an opportunity to evaluate the contributions of L-FABP to bioaccumulation of PFAS in zebrafish larvae. No clear trend was observed between L-FABP binding affinities and BCFs of PFAS. This demonstrated the minor contribution of L-FABP to the bioaccumulations of PFAS. Instead, hydrophobicity as indicated by RT on a C18 column was a major factor driving the bioaccumulation of PFAS in zebrafish larvae. The results are consistent with previous studies that nonspecific binding to lipids and proteins is a major factor for the bioaccumulation of PFAS (Kelly et al. 2009; Ng and Hungerbühler 2013).
Eight PFAS showed lower BCFs than perfluoroalkyl acids with similar hydrophobicity, demonstrating that other factors, in addition to hydrophobicity, impacted the bioaccumulations of PFAS. The eight PFAS were grouped into five structural categories: sulfonamides, carboxamides, alcohols, esters, and carboxylates (Figure 1E). Two of the five structural categories—alcohols and sulfonamides—have been well documented to be metabolized to perfluoroalkyl acids (Benskin et al. 2009; Dagnino et al. 2016). Therefore, we hypothesized that the five structural categories identified here might be prone to metabolism, which may lead to the low bioaccumulations of the parent structures in zebrafish larvae. Beyond the eight PFAS, 23 other PFAS with similar functional groups also fell into the five structural categories but were not shown in Figure 1D for two major reasons: a) The BCFs for some PFAS were not determined because they were not detectable due to poor ionization efficiency. For instance, 8:2 FTOH (64) was not detectable, whereas many metabolites, including PFCAs and FTCAs, were detected in zebrafish exposed to 8:2 FTOH. b) Even in the same structural category, certain PFAS might exhibit smaller metabolism rates. For example, PFOSA (60) was metabolized less rapidly than NEt-FOSA (24). Similarly, carboxamide 19 was metabolized more rapidly than another amide 31. Hence, nontargeted analysis was applied to characterize the metabolism routes of all 31 PFAS belonging to these five structural categories, including 15 alcohols, 3 polyfluorinated carboxylates, 5 sulfonamides, four carboxamides, and 4 carboxyesters.
The detection of well-known metabolites from FTOHs and sulfonamides confirmed the conservation of many xenobiotic-metabolizing enzymes in zebrafish and supported the use of zebrafish embryos as a high-throughput model to investigate the metabolism pathways of PFAS. The metabolism pathways of most PFAS were studied for the first time, as exemplified by PFOSAmS (5). A very recent study reported the biodegradation of PFOSAmS by soil microcosms, albeit with a long half-life (142 d) (Mejia-Avendaño et al. 2016). In contrast to microbial degradation, fast metabolism of PFOSAmS was observed in zebrafish larvae, with demethylation products detected as the major species. Because quaternary ammonium compounds are widely used in AFFF formulations, their fast biotransformation rates reported here highlight them as an important class of precursor compounds of PFOS.
Hydrolysis of Polyfluoroalkyl Carboxamides to Terminal Carboxylates
Although amide compounds were widely detected in AFFF formulations with diverse structures (Barzen-Hanson et al. 2017), this is the first study reporting the efficient hydrolysis of perfluoroalkyl carboxamides to carboxylates. The hydrolysis rates of carboxamides are highly related to their structures, as exemplified by another diamide chemical (58), for which no metabolite was detected in zebrafish larvae by nontargeted analysis (Figure 3A).
The detection of high concentrations of shorter-chain PFCAs in zebrafish larvae exposed to carboxamides was surprising because shorter-chain PFCAs have been well documented to be nonbioaccumulative (Shi et al. 2018). Acidic compounds in their deprotonated form have been reported to poorly bioaccumulate in cells and fish (Kozin and Gerweck 1998), partially due to the repulsion of negatively charged phospholipids during cell membrane penetration. Shorter-chain PFCAs are strong acids owing to the electronegativity of the fluorine on the . For instance, shorter-chain PFCAs are expected to be deprotonated at physiological pH () according to their calculated s (1.07, 0.34, and 0.94 for PFBA, PFPeA, and 1H-PFPeA, as predicted by ChemAxon), decreasing their bioaccumulation capability in zebrafish larvae, whereas the corresponding carboxamides should be present at least partially in their neutral form given that their s are predicted as 7.65 (38), 6.41 (19), and 7.26 (31). With this considered, we propose a schematic model (Figure 3C) wherein shorter-chain carboxamide compounds are bioaccumulative in zebrafish larvae and are then effectively metabolized to their corresponding carboxylates, eventually leading to the enhanced bioaccumulation of PFCAs in zebrafish larvae. Our findings demonstrate that indirect sources from precursor compounds may lead to even higher bioaccumulations of perfluoroalkyl acids. Considering the fact that amide compounds are common ingredients in AFFF formulations (Barzen-Hanson et al. 2017), future studies are warranted to clarify the contributions of amides to perfluoroalkyl acids in humans and wildlife.
Structure-Related Metabolism Pathways of FTOHs
FTOHs are one of the most studied precursor compounds of PFCAs. In addition to classic metabolism pathways to produce PFCAs, along with conjugate formation via and Phase II reactions, unexpected structure-related metabolism pathways were observed that were highly related to the number of hydrocarbons (Figure 5C). Taurine conjugation dominated the metabolism routes for FTOHs with more than two hydrocarbons, whereas and Phase II reactions were predominant for other FTOHs with one or two hydrocarbons. This implies that enzymes catalyzing taurine conjugation have a specific conformation restriction on substrates. Two taurine conjugation enzymes have been characterized, including bile acid-CoA:amino acid N-acyltransferase (BACAT) and acyl-coenzyme A:amino acid N-acyltransferase (ACNAT) (O’Byrne et al. 2003; Reilly et al. 2007). Unfortunately, information is not available for the structure-related enzymatic activities of BACAT or ACANT1. Our study clearly demonstrates the impacts of fluorinated carbons and hydrocarbons on taurine conjugation, and future mechanistic studies with recombinant enzymes are of great interest. Taurine conjugates from FTOHs were highly accumulated in zebrafish larvae, even more than well-studied perfluoroalkyl acids. In mammals and adult fish, taurine conjugates are hydrolyzed by gut microbes to release taurine (Koppel et al. 2017). The gut microbiome has not been established in zebrafish larvae (Stephens et al. 2016) and which may also contribute to the high bioaccumulations of taurine conjugates in zebrafish larvae. Because of the structural similarity between PFOS and taurine conjugates, future studies are needed to clarify whether taurine conjugates may lead to toxicity via similar toxicity pathways to PFOS by, for example, binding to L-FABP and PPAR receptors (Sheng et al. 2016; Takacs and Abbott 2007; Zhang et al. 2013).
Hydrolysis of PFAS by hCES1
Inspired by the detection of hydrolysis metabolites from diverse PFAS, we confirmed the structure-related hydrolysis of PFAS with a recombinant enzyme. Although the enzymes to hydrolyze PFAS have never before been reported, we decided to focus on the liver CESs, which are known as a class of major xenobiotic hydrolysis enzymes with broad substrate specificity (Hosokawa 2008). The hydrolysis rates of 11 selected PFAS from in vitro recombinant enzymatic activities and in vivo zebrafish experiments were consistent, implying that CES may be responsible for the metabolism of carboxyesters and carboxamides in zebrafish larvae.
Although carboxamides were found to be hydrolyzed by hCES1 with high efficiency, hCES1 hydrolytic activity was not detected for sulfonamides. CES1 is a serine hydrolase, and its hydrolytic mechanism is mediated by the nucleophilic attack via deprotonated –OH on Ser203, as shown in Figure 7D (Hosokawa 2008). The higher electron density of sulfur from sulfonamides, compared with amides, may limit the nucleophilic attack efficiency by serine. Indeed, although the biotransformation of sulfonamides to PFOS has been well documented in previous studies (Tomy et al. 2004), the responsible enzyme has not yet been identified. The much lower hydrolysis rates of carboxyesters than amides catalyzed by recombinant hCES is unexpected because carboxyester compounds are the most studied substrates for CES enzymes (Hosokawa 2008), whereas amine is a poor leaving group in hydrolysis reactions. Although amide compounds have been reported to be the substrates of CES enzymes (Hosokawa 2008), to our best knowledge, this is the first time that the hydrolysis of primary amides by CES enzymes has been reported. The unusual structure-related hydrolysis of PFAS by hCES1 may be related to the strong electronegativity of fluorine, which may decrease the electron density of a carboxamide moiety, and hence increase the hydrolytic rates of carboxamides (Figure 7D).
Conclusion
Our study of bioconcentration and metabolism of a diverse set of PFAS in early life stages zebrafish demonstrated a range of metabolic pathways influenced by structural categories. The impact of metabolism was shown to have dramatic effects on the toxicokinetics of many of the PFAS. Although shorter-chain PFCAs exhibit low bioaccumulation, their amide analogs appear to overcome the bioavailability limitations of the acids and bioaccumulate to high degrees, at the same time being converted to their corresponding carboxylic acid by metabolic pathways. The most toxic structures to the developing zebrafish tested were sulfonamides, whereas their carboxamide analogs had little bioactivity. The latter were shown to have low bioconcentration and extensive metabolism. The potential effect of the fluorine constituents of the molecules was illustrated through the activity of hCES1, which showed unexpected substrate preference compared with activity against nonfluorinated chemicals; this may be due to the influence of the strongly electronegative fluorine on the enzymatic mechanism. Together, these findings reinforce the notion that understanding the potential toxicities of PFAS will require careful analysis of toxicokinetic parameters for each experimental system in order to properly interpret actual exposures and bioactivity/toxicity effects. However, this study was limited to a short exposure to zebrafish embryos. Although 70% of human genes, including many xenobiotic metabolism enzymes, are conserved in zebrafish (Howe 2013), future studies are warranted to confirm the observed metabolism pathways of PFAS in adult fish and mammals.
Supplementary Material
Acknowledgments
We thank D. Nacci [U. S. Environmental Protection Agency (EPA)] and R. Kolanczyk (U. S. EPA) for critical reviews of the manuscript. This research was supported by the National Sciences and Engineering Research Council (NSERC) discovery grant RGPIN-2018-06 and Environment and Climate Change Canada grant GCXE19P017. The authors acknowledge the support of instrumentation grants from the Canada Foundation for Innovation, the Ontario Research Fund, and the NSERC Research Tools and Instrument grant.
The views expressed in this paper are those of the authors and do not necessarily reflect the statements, opinions, views, conclusions, or policies of the U.S. EPA.
References
- Anselmo CD, Sardela VF, de Sousa VP, Pereira HMG. 2018. Zebrafish (Danio rerio): a valuable tool for predicting the metabolism of xenobiotics in humans? Comp Biochem Physiol C Toxicol Pharmacol 212:34–46, PMID: 29969680, 10.1016/j.cbpc.2018.06.005. [DOI] [PubMed] [Google Scholar]
- Arp HPH, Niederer C, Goss K-U. 2006. Predicting the partitioning behavior of various highly fluorinated compounds. Environ Sci Technol 40(23):7298–7304, PMID: 17180981, 10.1021/es060744y. [DOI] [PubMed] [Google Scholar]
- Backe WJ, Day TC, Field JA. 2013. Zwitterionic, cationic, and anionic fluorinated chemicals in aqueous film forming foam formulations and groundwater from U.S. military bases by nonaqueous large-volume injection HPLC-MS/MS. Environ Sci Technol 47(10):5226–5234, PMID: 23590254, 10.1021/es3034999. [DOI] [PubMed] [Google Scholar]
- Barrett H, Du X, Houde M, Lair S, Verreault J, Peng H. 2021. Suspect and nontarget screening revealed class-specific temporal trends (2000-2017) of poly- and perfluoroalkyl substances in St. Lawrence beluga whales. Environ Sci Technol 55(3):1659–1671, PMID: 33444015, 10.1021/acs.est.0c05957. [DOI] [PubMed] [Google Scholar]
- Barzen-Hanson KA, Roberts SC, Choyke S, Oetjen K, McAlees A, Riddell N, et al. 2017. Discovery of 40 classes of per- and polyfluoroalkyl substances in historical aqueous film-forming foams (AFFFs) and AFFF-impacted groundwater. Environ Sci Technol 51(4):2047–2057, PMID: 28098989, 10.1021/acs.est.6b05843. [DOI] [PubMed] [Google Scholar]
- Beesoon S, Martin JW. 2015. Isomer-specific binding affinity of perfluorooctanesulfonate (PFOS) and perfluorooctanoate (PFOA) to serum proteins. Environ Sci Technol 49(9):5722–5731, PMID: 25826685, 10.1021/es505399w. [DOI] [PubMed] [Google Scholar]
- Benskin JP, Holt A, Martin JW. 2009. Isomer-specific biotransformation rates of a perfluorooctane sulfonate (PFOS)-precursor by cytochrome p450 isozymes and human liver microsomes. Environ Sci Technol 43(22):8566–8572, PMID: 20028053, 10.1021/es901915f. [DOI] [PubMed] [Google Scholar]
- Butt CM, Muir DCG, Mabury SA. 2010. Elucidating the pathways of poly- and perfluorinated acid formation in rainbow trout. Environ Sci Technol 44(13):4973–4980, PMID: 20518507, 10.1021/es100702a. [DOI] [PubMed] [Google Scholar]
- Cao H, Zhou Z, Wang L, Liu G, Sun Y, Wang Y, et al. 2019. Screening of potential PFOS alternatives to decrease liver bioaccumulation: experimental and computational approaches. Environ Sci Technol 53(5):2811–2819, PMID: 30735364, 10.1021/acs.est.8b05564. [DOI] [PubMed] [Google Scholar]
- Chen M, Qiang L, Pan X, Fang S, Han Y, Zhu L. 2015. In vivo and in vitro isomer-specific biotransformation of perfluorooctane sulfonamide in common carp (Cyprinus carpio). Environ Sci Technol 49(23):13817–13824, PMID: 26053759, 10.1021/acs.est.5b00488. [DOI] [PubMed] [Google Scholar]
- Chen Q, Yu L, Yang L, Zhou B. 2012. Bioconcentration and metabolism of decabromodiphenyl ether (BDE-209) result in thyroid endocrine disruption in zebrafish larvae. Aquat Toxicol 110–111:141–148, PMID: 22307006, 10.1016/j.aquatox.2012.01.008. [DOI] [PubMed] [Google Scholar]
- Cheng W, Ng CA. 2017. A permeability-limited physiologically based pharmacokinetic (PBPK) model for perfluorooctanoic acid (PFOA) in male rats. Environ Sci Technol 51(17):9930–9939, PMID: 28759222, 10.1021/acs.est.7b02602. [DOI] [PubMed] [Google Scholar]
- Dagnino S, Strynar MJ, McMahen RL, Lau CS, Ball C, Garantziotis S, et al. 2016. Identification of biomarkers of exposure to FTOHs and PAPs in humans using a targeted and nontargeted analysis approach. Environ Sci Technol 50(18):10216–10225, PMID: 27477586, 10.1021/acs.est.6b01170. [DOI] [PMC free article] [PubMed] [Google Scholar]
- D’Agostino LA, Mabury SA. 2014. Identification of novel fluorinated surfactants in aqueous film forming foams and commercial surfactant concentrates. Environ Sci Technol 48(1):121–129, PMID: 24256061, 10.1021/es403729e. [DOI] [PubMed] [Google Scholar]
- Dasgupta S, Reddam A, Liu Z, Liu J, Volz DC. 2020. High-content screening in zebrafish identifies perfluorooctanesulfonamide as a potent developmental toxicant. Environ Pollut 256:113550, PMID: 31706782, 10.1016/j.envpol.2019.113550. [DOI] [PMC free article] [PubMed] [Google Scholar]
- Droge STJ. 2019. Membrane–water partition coefficients to aid risk assessment of perfluoroalkyl anions and alkyl sulfates. Environ Sci Technol 53(2):760–770, PMID: 30572703, 10.1021/acs.est.8b05052. [DOI] [PubMed] [Google Scholar]
- Embry MR, Belanger SE, Braunbeck TA, Galay-Burgos M, Halder M, Hinton DE, et al. 2010. The fish embryo toxicity test as an animal alternative method in hazard and risk assessment and scientific research. Aquat Toxicol 97(2):79–87, PMID: 20061034, 10.1016/j.aquatox.2009.12.008. [DOI] [PubMed] [Google Scholar]
- Fu J, Han J, Zhou B, Gong Z, Santos EM, Huo X, et al. 2013. Toxicogenomic responses of zebrafish embryos/larvae to tris(1,3-dichloro-2-propyl) phosphate (TDCPP) reveal possible molecular mechanisms of developmental toxicity. Environ Sci Technol 47(18):10574–10582, PMID: 23919627, 10.1021/es401265q. [DOI] [PubMed] [Google Scholar]
- Fujii Y, Niisoe T, Harada KH, Uemoto S, Ogura Y, Takenaka K, et al. 2015. Toxicokinetics of perfluoroalkyl carboxylic acids with different carbon chain lengths in mice and humans. J Occup Health 57(1):1–12, PMID: 25422127, 10.1539/joh.14-0136-OA. [DOI] [PubMed] [Google Scholar]
- Gaballah S, Swank A, Sobus JR, Howey XM, Schmid J, Catron T, et al. 2020. Evaluation of developmental toxicity, developmental neurotoxicity, and tissue dose in zebrafish exposed to GenX and other PFAS. Environ Health Perspect 128(4):47005, PMID: 32271623, 10.1289/EHP5843. [DOI] [PMC free article] [PubMed] [Google Scholar]
- Gebbink WA, van Asseldonk L, van Leeuwen SPJ. 2017. Presence of emerging per- and polyfluoroalkyl substances (PFAS) in river and drinking water near a fluorochemical production plant in the Netherlands. Environ Sci Technol 51(19):11057–11065, PMID: 28853567, 10.1021/acs.est.7b02488. [DOI] [PMC free article] [PubMed] [Google Scholar]
- Giesy JP, Kannan K. 2002. Perfluorochemical surfactants in the environment. Environ Sci Technol 36(7):146A–152A, PMID: 11999053, 10.1021/es022253t. [DOI] [PubMed] [Google Scholar]
- Hosokawa M. 2008. Structure and catalytic properties of carboxylesterase isozymes involved in metabolic activation of prodrugs. Molecules 13(2):412–431, PMID: 18305428, 10.3390/molecules13020412. [DOI] [PMC free article] [PubMed] [Google Scholar]
- Houde M, De Silva AO, Muir DCG, Letcher RJ. 2011. Monitoring of perfluorinated compounds in aquatic biota: an updated review: PFCs in aquatic biota. Environ Sci Technol 45(19):7962–7973, PMID: 21542574, 10.1021/es104326w. [DOI] [PubMed] [Google Scholar]
- Howe K, Clark MD, Torroja CF, Torrance J, Berthelot C, Muffato M, et al. 2013. The zebrafish reference genome sequence and its relationship to the human genome. Nature 496(7446):498–503, PMID: 23594743, 10.1038/nature12111. [DOI] [PMC free article] [PubMed] [Google Scholar]
- Huang MC, Dzierlenga AL, Robinson VG, Waidyanatha S, DeVito MJ, Eifrid MA, et al. 2019. Toxicokinetics of perfluorobutane sulfonate (PFBs), perfluorohexane-1-sulphonic acid (PFHxS), and perfluorooctane sulfonic acid (PFOS) in male and female Hsd:Sprague Dawley SD rats after intravenous and gavage administration. Toxicol Rep 6:645–655, PMID: 31334035, 10.1016/j.toxrep.2019.06.016. [DOI] [PMC free article] [PubMed] [Google Scholar]
- Jantzen CE, Annunziato KA, Bugel SM, Cooper KR. 2016. PFOS, PFNA, and PFOA sub-lethal exposure to embryonic zebrafish have different toxicity profiles in terms of morphometrics, behavior and gene expression. Aquat Toxicol 175:160–170, PMID: 27058923, 10.1016/j.aquatox.2016.03.026. [DOI] [PMC free article] [PubMed] [Google Scholar]
- Jones PD, Hu W, De Coen W, Newsted JL, Giesy JP. 2003. Binding of perfluorinated fatty acids to serum proteins. Environ Toxicol Chem 22(11):2639–2649, PMID: 14587903, 10.1897/02-553. [DOI] [PubMed] [Google Scholar]
- Kelly BC, Ikonomou MG, Blair JD, Surridge B, Hoover D, Grace R, et al. 2009. Perfluoroalkyl contaminants in an Arctic marine food web: trophic magnification and wildlife exposure. Environ Sci Technol 43(11):4037–4043, PMID: 19569327, 10.1021/es9003894. [DOI] [PubMed] [Google Scholar]
- Kimmel CB, Ballard WW, Kimmel SR, Ullmann B, Schilling TF. 1995. Stages of embryonic development of the zebrafish. Dev Dyn 203(3):253–310, PMID: 8589427, 10.1002/aja.1002030302. [DOI] [PubMed] [Google Scholar]
- Koppel N, Rekdal VM, Balskus EP. 2017. Chemical transformation of xenobiotics by the human gut microbiota. Science 356(6344):eaag2770, PMID: 28642381, 10.1126/science.aag2770. [DOI] [PMC free article] [PubMed] [Google Scholar]
- Kozin SV, Gerweck LE. 1998. Cytotoxicity of weak electrolytes after the adaptation of cells to low pH: role of the transmembrane pH gradient. Br J Cancer 77(10):1580–1585, PMID: 9635832, 10.1038/bjc.1998.260. [DOI] [PMC free article] [PubMed] [Google Scholar]
- Krokhin OV, Spicer V. 2009. Peptide retention standards and hydrophobicity indexes in reversed-phase high-performance liquid chromatography of peptides. Anal Chem 81(22):9522–9530, PMID: 19848410, 10.1021/ac9016693. [DOI] [PubMed] [Google Scholar]
- Kudo N, Sakai A, Mitsumoto A, Hibino Y, Tsuda T, Kawashima Y. 2007. Tissue distribution and hepatic subcellular distribution of perfluorooctanoic acid at low dose are different from those at high dose in rats. Biol Pharm Bull 30(8):1535–1540, PMID: 17666816, 10.1248/bpb.30.1535. [DOI] [PubMed] [Google Scholar]
- Lau C, Anitole K, Hodes C, Lai D, Pfahles-Hutchens A, Seed J. 2007. Perfluoroalkyl acids: a review of monitoring and toxicological findings. Toxicol Sci 99(2):366–394, PMID: 17519394, 10.1093/toxsci/kfm128. [DOI] [PubMed] [Google Scholar]
- Li G, Ye H, Su G, Han Z, Xie C, Zhou B, et al. 2017. Establishment of a three-step method to evaluate effects of chemicals on development of zebrafish embryo/larvae. Chemosphere 186:209–217, PMID: 28780448, 10.1016/j.chemosphere.2017.07.163. [DOI] [PubMed] [Google Scholar]
- Liberatore HK, Jackson SR, Strynar MJ, McCord JP. 2020. Solvent suitability for HFPO-DA (“GenX” parent acid) in toxicological studies. Environ Sci Technol Lett 7(7):477–481, PMID: 32944590, 10.1021/acs.estlett.0c00323. [DOI] [PMC free article] [PubMed] [Google Scholar]
- Lin Y, Ruan T, Liu A, Jiang G. 2017. Identification of novel hydrogen-substituted polyfluoroalkyl ether sulfonates in environmental matrices near metal-plating facilities. Environ Sci Technol 51(20):11588–11596, PMID: 28918639, 10.1021/acs.est.7b02961. [DOI] [PubMed] [Google Scholar]
- Liu H, Ma Z, Zhang T, Yu N, Su G, Giesy JP, et al. 2018. Pharmacokinetics and effects of tetrabromobisphenol A (TBBPA) to early life stages of zebrafish (Danio rerio). Chemosphere 190:243–252, PMID: 28992476, 10.1016/j.chemosphere.2017.09.137. [DOI] [PubMed] [Google Scholar]
- Liu Y, Pereira ADS, Martin JW. 2015. Discovery of C5-C17 poly- and perfluoroalkyl substances in water by in-line SPE-HPLC-Orbitrap with in-source fragmentation flagging. Anal Chem 87(8):4260–4268, PMID: 25818392, 10.1021/acs.analchem.5b00039. [DOI] [PubMed] [Google Scholar]
- Lu Y, Liang Y, Zhou Z, Wang Y, Jiang G. 2019. Possible fluorinated alternatives of PFOS and PFOA: ready to go? Environ Sci Technol 53(24):14091–14092, PMID: 31790205, 10.1021/acs.est.9b06323. [DOI] [PubMed] [Google Scholar]
- Martin JW, Mabury SA, Solomon KR, Muir DCG. 2003. Bioconcentration and tissue distribution of perfluorinated acids in rainbow trout (Oncorhynchus mykiss). Environ Toxicol Chem 22(1):196–204, PMID: 12503765, 10.1002/etc.5620220126. [DOI] [PubMed] [Google Scholar]
- Martin JW, Smithwick MM, Braune BM, Hoekstra PF, Muir DCG, Mabury SA. 2004. Identification of long-chain perfluorinated acids in biota from the Canadian Arctic. Environ Sci Technol 38(2):373–380, PMID: 14750710, 10.1021/es034727+. [DOI] [PubMed] [Google Scholar]
- Mejia-Avendaño S, Duy SV, Sauvé S, Liu J. 2016. Generation of perfluoroalkyl acids from aerobic biotransformation of quaternary ammonium polyfluoroalkyl surfactants. Environ Sci Technol 50(18):9923–9932, PMID: 27477739, 10.1021/acs.est.6b00140. [DOI] [PubMed] [Google Scholar]
- Moody CA, Martin JW, Kwan WC, Muir DCG, Mabury SA. 2002. Monitoring perfluorinated surfactants in biota and surface water samples following an accidental release of fire-fighting foam into Etobicoke Creek. Environ Sci Technol 36(4):545–551, PMID: 11883418, 10.1021/es011001+. [DOI] [PubMed] [Google Scholar]
- Newton S, McMahen R, Stoeckel JA, Chislock M, Lindstrom A, Strynar M. 2017. Novel polyfluorinated compounds identified using high resolution mass spectrometry downstream of manufacturing facilities near Decatur, Alabama. Environ Sci Technol 51(3):1544–1552, PMID: 28084732, 10.1021/acs.est.6b05330. [DOI] [PMC free article] [PubMed] [Google Scholar]
- Ng CA, Hungerbühler K. 2013. Bioconcentration of perfluorinated alkyl acids: how important is specific binding? Environ Sci Technol 47(13):7214–7223, PMID: 23734664, 10.1021/es400981a. [DOI] [PubMed] [Google Scholar]
- O’Byrne J, Hunt MC, Rai DK, Saeki M, Alexson SEH. 2003. The human bile acid-CoA: amino acid N-acyltransferase functions in the conjugation of fatty acids to glycine. J Biol Chem 278(36):34237–34244, PMID: 12810727, 10.1074/jbc.M300987200. [DOI] [PubMed] [Google Scholar]
- OECD (Organisation for Economic Co-operation and Development). 2012. OECD Guideline for the Testing of Chemicals. Fish Embryo Acute Aquatic Toxicity (FET) Test. Draft Proposal for a New Guideline. https://www.oecd.org/env/ehs/testing/Draft_FET_TG_v9_Draft%2014%20Dec%202012_CLEAN.pdf [accessed 1 July 2021].
- OECD. 2015. Risk Reduction Approaches for PFAS—A Cross-Country Analysis. Series on Risk Management, No. 29. https://www.oecd.org/chemicalsafety/risk-management/Risk_Reduction_Approaches%20for%20PFASS.pdf [accessed 1 July 2021].
- Patlewicz G, Richard AM, Williams AJ, Grulke CM, Sams R, Lambert J, et al. 2019. A chemical category-based prioritization approach for selecting 75 per- and polyfluoroalkyl substances (PFAS) for tiered toxicity and toxicokinetic testing. Environ Health Perspect 127(1):014501, PMID: 30632786, 10.1289/EHP4555. [DOI] [PMC free article] [PubMed] [Google Scholar]
- Peng H, Chen CL, Saunders DMV, Sun J, Tang S, Codling G, et al. 2015. Untargeted identification of organo-bromine compounds in lake sediments by ultrahigh-resolution mass spectrometry with the data-independent precursor isolation and characteristic fragment method. Anal Chem 87(20):10237–10246, PMID: 26379008, 10.1021/acs.analchem.5b01435. [DOI] [PubMed] [Google Scholar]
- Peng H, Saunders DMV, Sun J, Jones PD, Wong CKC, Liu H, et al. 2016. Mutagenic azo dyes, rather than flame retardants, are the predominant brominated compounds in house dust. Environ Sci Technol 50(23):12669–12677, PMID: 27934287, 10.1021/acs.est.6b03954. [DOI] [PubMed] [Google Scholar]
- Peng H, Zhang S, Sun J, Zhang Z, Giesy JP, Hu J. 2014. Isomer-specific accumulation of perfluorooctanesulfonate from (N-ethyl perfluorooctanesulfonamido)ethanol-based phosphate diester in Japanese medaka (Oryzias latipes). Environ Sci Technol 48(2):1058–1066, PMID: 24364678, 10.1021/es404867w. [DOI] [PubMed] [Google Scholar]
- Place BJ, Field JA. 2012. Identification of novel fluorochemicals in aqueous film-forming foams used by the US military. Environ Sci Technol 46(13):7120–7127, PMID: 22681548, 10.1021/es301465n. [DOI] [PMC free article] [PubMed] [Google Scholar]
- Reilly S-J, O’Shea EM, Andersson U, O’Byrne J, Alexson SEH, Hunt MC. 2007. A peroxisomal acyltransferase in mouse identifies a novel pathway for taurine conjugation of fatty acids. FASEB J 21(1):99–107, PMID: 17116739, 10.1096/fj.06-6919com. [DOI] [PubMed] [Google Scholar]
- Sanz-Landaluze J, Pena-Abaurrea M, Muñoz-Olivas R, Cámara C, Ramos L. 2015. Zebrafish (Danio rerio) eleutheroembryo-based procedure for assessing bioaccumulation. Environ Sci Technol 49(3):1860–1869, PMID: 25590991, 10.1021/es504685c. [DOI] [PubMed] [Google Scholar]
- Schymanski EL, Jeon J, Gulde R, Fenner K, Ruff M, Singer HP, et al. 2014. Identifying small molecules via high resolution mass spectrometry: communicating confidence. Environ Sci Technol 48(4):2097–2098, PMID: 24476540, 10.1021/es5002105. [DOI] [PubMed] [Google Scholar]
- Sheng N, Li J, Liu H, Zhang A, Dai J. 2016. Interaction of perfluoroalkyl acids with human liver fatty acid-binding protein. Arch Toxicol 90(1):217–227, PMID: 25370009, 10.1007/s00204-014-1391-7. [DOI] [PubMed] [Google Scholar]
- Shi Y, Vestergren R, Nost TH, Zhou Z, Cai YQ. 2018. Probing the differential tissue distribution and bioaccumulation behavior of per- and polyfluoroalkyl substances of varying chain-lengths, isomeric structures and functional groups in Crucian carp. Environ Sci Technol 52(8):4592–4600, PMID: 29611424, 10.1021/acs.est.7b06128. [DOI] [PubMed] [Google Scholar]
- Shi Y, Wang J, Pan Y, Cai Y. 2012. Tissue distribution of perfluorinated compounds in farmed freshwater fish and human exposure by consumption. Environ Toxicol Chem 31(4):717–723, PMID: 22431138, 10.1002/etc.1758. [DOI] [PubMed] [Google Scholar]
- Smith CA, Want EJ, O’Maille G, Abagyan R, Siuzdak G. 2006. XCMS: processing mass spectrometry data for metabolite profiling using nonlinear peak alignment, matching, and identification. Anal Chem 78(3):779–787, PMID: 16448051, 10.1021/ac051437y. [DOI] [PubMed] [Google Scholar]
- Stephens WZ, Burns AR, Stagaman K, Wong S, Rawls JF, Guillemin K, et al. 2016. The composition of the zebrafish intestinal microbial community varies across development. ISME J 10(3):644–654, PMID: 26339860, 10.1038/ismej.2015.140. [DOI] [PMC free article] [PubMed] [Google Scholar]
- Sun J, Tang S, Peng H, Saunders DMV, Doering JA, Hecker M, et al. 2016. Combined transcriptomic and proteomic approach to identify toxicity pathways in early life stages of Japanese medaka (Oryzias latipes) exposed to 1,2,5,6-tetrabromocyclooctane (TBCO). Environ Sci Technol 50(14):7781–7790, PMID: 27322799, 10.1021/acs.est.6b01249. [DOI] [PubMed] [Google Scholar]
- Takacs ML, Abbott BD. 2007. Activation of mouse and human peroxisome proliferator-activated receptors (α, β/δ, γ) by perfluorooctanoic acid and perfluorooctane sulfonate. Toxicol Sci 95(1):108–117, PMID: 17047030, 10.1093/toxsci/kfl135. [DOI] [PubMed] [Google Scholar]
- Thornton LM, Path EM, Nystrom GS, Venables BJ, Jeffries MKS. 2016. Early life stage exposure to BDE-47 causes adverse effects on reproductive success and sexual differentiation in fathead minnows (Pimephales promelas). Environ Sci Technol 50(14):7834–7841, PMID: 27326452, 10.1021/acs.est.6b02147. [DOI] [PubMed] [Google Scholar]
- Tiefenbach J, Moll PR, Nelson MR, Hu C, Baev L, Kislinger T, et al. 2010. A live zebrafish-based screening system for human nuclear receptor ligand and cofactor discovery. PLoS One 5(3):e9797, PMID: 20339547, 10.1371/journal.pone.0009797. [DOI] [PMC free article] [PubMed] [Google Scholar]
- Tomy GT, Tittlemier SA, Palace VP, Budakowski WR, Braekevelt E, Brinkworth L, et al. 2004. Biotransformation of N-ethyl perfluorooctanesulfonamide by rainbow trout (Onchorhynchus mykiss) liver microsomes. Environ Sci Technol 38(3):758–762, PMID: 14968861, 10.1021/es034550j. [DOI] [PubMed] [Google Scholar]
- Villeneuve D, Volz DC, Embry MR, Ankley GT, Belanger SE, Léonard M, et al. 2014. Investigating alternatives to the fish early-life stage test: a strategy for discovering and annotating adverse outcome pathways for early fish development. Environ Toxicol Chem 33(1):158–169, PMID: 24115264, 10.1002/etc.2403. [DOI] [PMC free article] [PubMed] [Google Scholar]
- Vogs C, Johanson G, Näslund M, Wulff S, Sjödin M, Hellstrandh M, et al. 2019. Toxicokinetics of perfluorinated alkyl acids influences their toxic potency in the zebrafish embryo (Danio rerio). Environ Sci Technol 53(7):3898–3907, PMID: 30844262, 10.1021/acs.est.8b07188. [DOI] [PubMed] [Google Scholar]
- Volz DC, Belanger S, Embry M, Padilla S, Sanderson H, Schirmer K, et al. 2011. Adverse outcome pathways during early fish development: a conceptual framework for identification of chemical screening and prioritization strategies. Toxicol Sci 123(2):349–358, PMID: 21750347, 10.1093/toxsci/kfr185. [DOI] [PubMed] [Google Scholar]
- Wang Q, Lam JC-W, Man Y-C, Lai NL-S, Kwok KY, Guo Y, et al. 2015. Bioconcentration, metabolism and neurotoxicity of the organophorous flame retardant 1,3-dichloro 2-propyl phosphate (TDCPP) to zebrafish. Aquat Toxicol 158:108–115, PMID: 25461749, 10.1016/j.aquatox.2014.11.001. [DOI] [PubMed] [Google Scholar]
- Wang Y, Yu N, Zhu X, Guo H, Jiang J, Wang X, et al. 2018. Suspect and nontarget screening of per- and polyfluoroalkyl substances in wastewater from a fluorochemical manufacturing park. Environ Sci Technol 52(19):11007–11016, PMID: 30211545, 10.1021/acs.est.8b03030. [DOI] [PubMed] [Google Scholar]
- Weaver YM, Ehresman DJ, Butenhoff JL, Hagenbuch B. 2010. Roles of rat renal organic anion transporters in transporting perfluorinated carboxylates with different chain lengths. Toxicol Sci 113(2):305–314, PMID: 19915082, 10.1093/toxsci/kfp275. [DOI] [PMC free article] [PubMed] [Google Scholar]
- White RJ, Collins JE, Sealy IM, Wali N, Dooley CM, Digby Z, et al. 2017. A high-resolution mRNA expression time course of embryonic development in zebrafish. Elife 6:e30860, PMID: 29144233, 10.7554/eLife.30860. [DOI] [PMC free article] [PubMed] [Google Scholar]
- Yang D, Han J, Hall DR, Sun J, Fu J, Kutarna S, et al. 2020. Nontarget screening of per- and polyfluoroalkyl substances binding to human liver fatty acid binding protein. Environ Sci Technol 54(9):5676–5686, PMID: 32249562, 10.1021/acs.est.0c00049. [DOI] [PMC free article] [PubMed] [Google Scholar]
- Zhang L, Ren X-M, Guo L-H. 2013. Structure-based investigation on the interaction of perfluorinated compounds with human liver fatty acid binding protein. Environ Sci Technol 47(19):11293–11301, PMID: 24006842, 10.1021/es4026722. [DOI] [PubMed] [Google Scholar]
- Zhao W, Zitzow JD, Weaver Y, Ehresman DJ, Chang S-C, Butenhoff JL, et al. 2017. Organic anion transporting polypeptides contribute to the disposition of perfluoroalkyl acids in humans and rats. Toxicol Sci 156(1):84–95, PMID: 28013215, 10.1093/toxsci/kfw236. [DOI] [PMC free article] [PubMed] [Google Scholar]
Associated Data
This section collects any data citations, data availability statements, or supplementary materials included in this article.