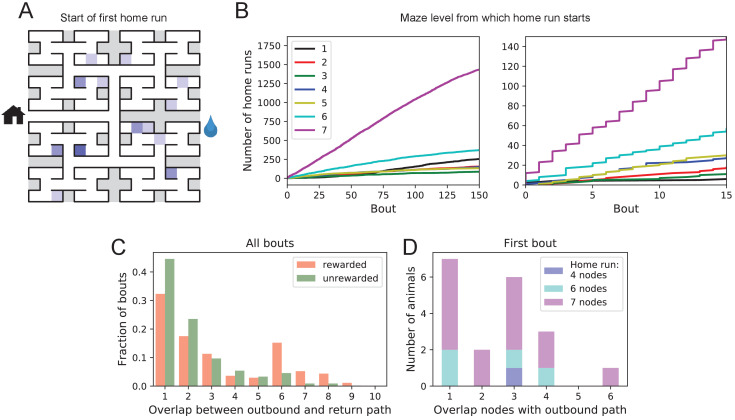
Figure 6. Homing succeeds on first attempt.
(A) Locations in the maze where the 19 animals started their first return to the exit (home run). Some locations were used by two or three animals (darker color). (B) Left: The cumulative number of home runs from different levels in the maze, summed over all animals, and plotted against the bout number. Level 1 = first T-junction, level 7 = end nodes. Right: Zoom of (Left) into early bouts. (C) Overlap between the outbound and the home path. Histogram of the overlap for all bouts of all animals. (D) Same analysis for just the first bout of each animal. The length of the home run is color-coded as in panel B.

