. 2021 Jul 1;10:e66175. doi: 10.7554/eLife.66175

Figure 8. Exploration covers the maze efficiently.

(A) The number of distinct end nodes encountered as a function of the number of end nodes visited for: mouse C1 (red); the optimal explorer agent (black); an unbiased random walk (blue). Arrowhead: the value N32=76 by which mouse C1 discovered half of the end nodes. (B) An expanded section of the graph in A including curves from 10 rewarded (red) and nine unrewarded (green) animals. The efficiency of exploration, defined as E=32/N32, is 0.385±0.050 (SD) for rewarded and 0.384±0.039 (SD) for unrewarded mice. (C) The efficiency of exploration for the same animals, comparing the values in the first and second halves of the time in the maze. The decline is a factor of 0.74±0.12 (SD) for rewarded and 0.81±0.13 (SD) for unrewarded mice.

Figure 8.

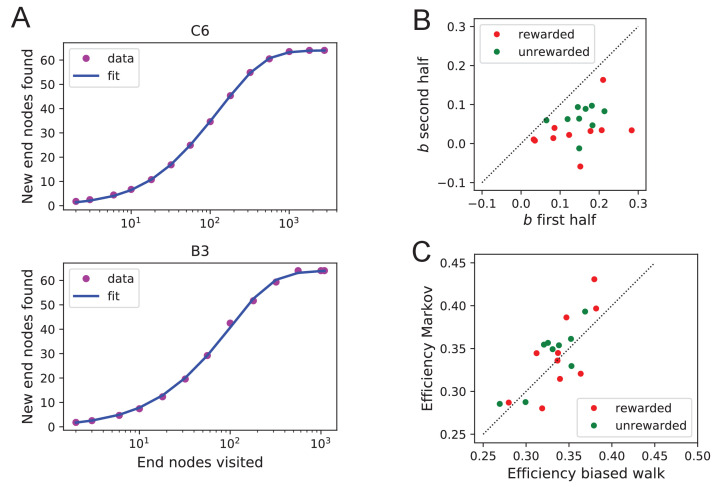
Figure 8—figure supplement 1. Efficiency of exploration.

Figure 8—figure supplement 1.

Functional fits to measure exploration efficiency (A) Fitting Equation 12 to the data from the mouse’s exploration. Animals with best fit (top) and worst fit (bottom). The relative uncertainty in the two fit parameters a and b was only 0.0038±0.0020 (mean ± SD across animals). (B) The fit parameter b for all animals, comparing the first to the second half of the night. (C) The efficiency E (Equation 1) predicted from two models of the mouse’s trajectory: The 4-bias random walk (Figure 11D) and the optimal Markov chain (Figure 11C).