. 2021 Jul 20;10:e66834. doi: 10.7554/eLife.66834

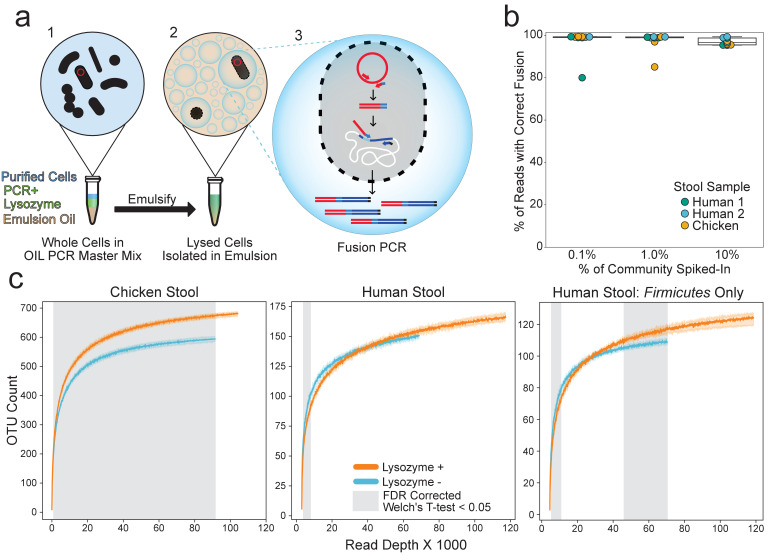
Figure 1. OIL-PCR can specifically link plasmid-encoded genes with their hosts.

(a) Depiction of the OIL-PCR method. (1) Nycodenz-purified cells are mixed with PCR master mix, lysozyme, and emulsion oil and shaken to create an emulsion. (2) Cells are lysed within the emulsion. (3) Fusion PCR is performed in droplets containing cells harboring the targeted gene. Fused amplicons between the gene of interest and the 16S rRNA gene are the product. (b) A boxplot showing the percent of Illumina reads containing correct fusion products, namely the fusion of plasmid-borne cmR and the 16S rRNA gene of E. coli MG1655. OIL-PCR was performed on two individuals’ and one chicken’s gut microbiome sample in triplicate, spiked with varying concentrations of E. coli. (c) Rarefaction analysis of chicken (left) or human gut microbiome sample (middle) with (orange) and without (blue) lysozyme treatment. At right is the rarefaction analysis performed on Firmicutes only in the human stool sample. Grayed regions in the plot represent areas where the curves, each composed of four technical replicates, are significantly different (p<0.05) from one another, according to an FDR-corrected Welch’s t-test.

Figure 1.

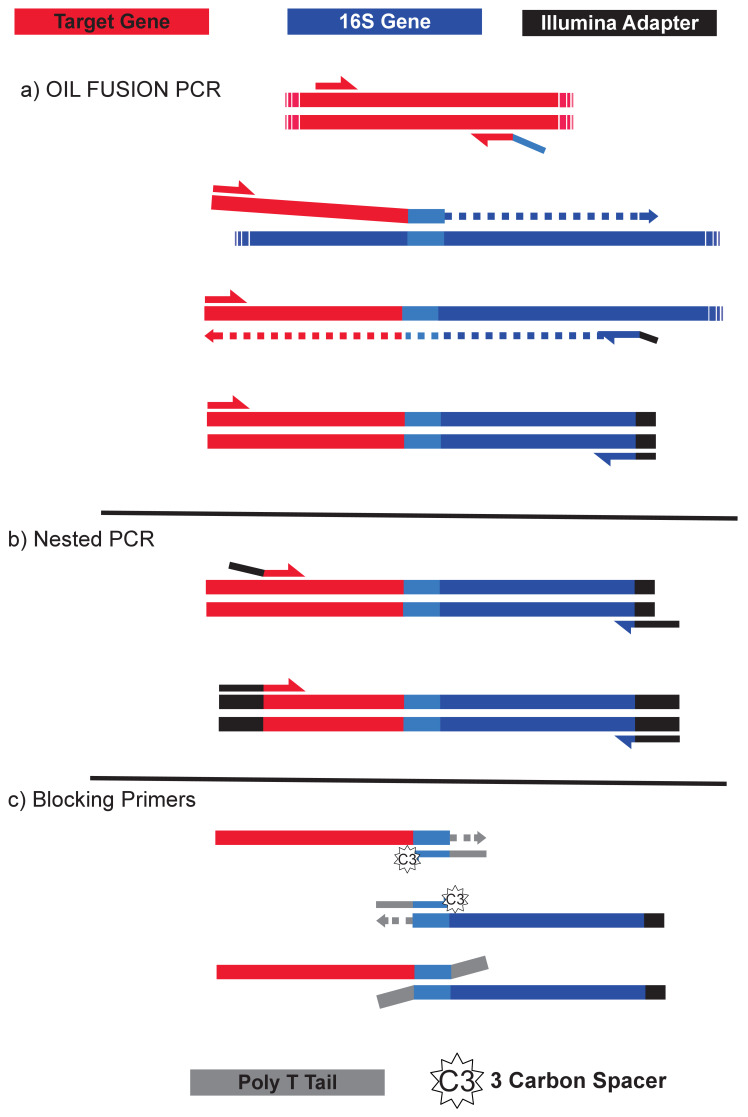
Figure 1—figure supplement 1. Depiction of the fusion PCR.

Figure 1—figure supplement 1.

(a) PCR is initialized with primers to a target gene (red). The reverse primer contains a 5’ overhang complimentary to the universal V4 16S primer 519F (light blue). The product of this first amplification step can act as a forward primer for the 16S rRNA gene (blue). After extension of the full fusion product, the forward target primer can pair with the universal 16S reverse primer 786R (with a portion of an Illumina TruSeq adapter sequence) to amplify the fully fused PCR product. (b) Nested PCR is performed on the fused PCR products from (a) in order to filter out non-specific priming from the fusion PCR. The forward primer anneals within the target gene and has a TruSeq adapter at the 5’ end. The reverse primer also has the Illumina adapter sequence at it is 5’; end and anneals to the non-degenerate portion of 786R and the partial Illumina adapter sequence appended in (a). (c) Two blocking primers, both complementary to the 519F priming region, are included in the nested PCR to prevent unfused PCR products from annealing during the nested reaction. Blocking primers have a three-carbon spacer on the 3’ end to prevent extension and a poly-T tail that appends 10 As to the 3’ end of any unfused products, thus inactivating them from annealing or extension.
Figure 1—figure supplement 2. BSA and excess MgCl2 improve the efficiency of OIL-PCR and Ready Lyse Lysozyme remains active in OIL-PCR master mix.
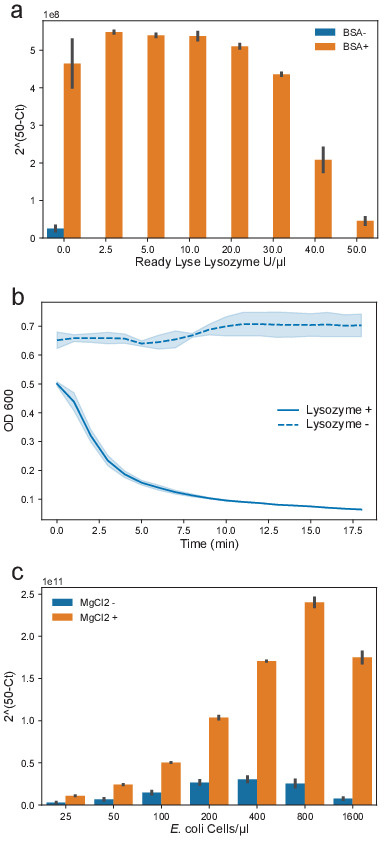
Figure 1—figure supplement 2.

(a) Sybr-based qPCR was performed on the cmR gene carried on pBAD33 with varying concentrations of lysozyme in the presence (orange) or absence (blue) of BSA. Higher 2(50-Ct) values represent greater amplification. (b) Lysozyme activity against B. subtilis suspended in the OIL-PCR optimized reaction mix with (solid line) and without (dashed line) lysozyme. (c) Sybr-based qPCR was performed on the cmR gene carried on the pBAD33 plasmid in E. coli MG1655 cells at increasing cell concentrations with (orange) and without (blue) additional MgCl2. Higher 2(50-Ct) values represent greater amplification.
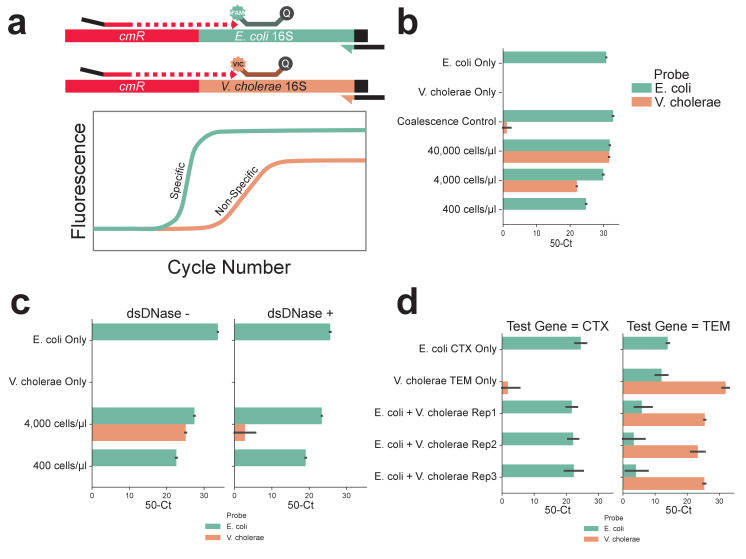
Figure 1—figure supplement 3. Cell concentration of 400 cells/μl, DNase treatment, and multiplexing PCR result in accurate OIL-PCR results.

Figure 1—figure supplement 3.

(a) Diagram of the Taqman assay used to monitor OIL-PCR results. Briefly, Taqman probes were designed to be complementary for the 16S rRNA genes in either E. coli or V. cholerae, each with its own fluorophore. OIL-PCR was performed on E. coli carrying the cmR gene on the pBAD33 plasmid but not present in V. cholerae. Fusion PCR products were recovered and nested probe-based qPCR was performed. Upon amplification of the gene, the probe is cleaved by Taq polymerase releasing the fluorophore from the quencher. Specific amplification of the designated region is measured by fluorescence of the expected fusion product vs the non-specific product. (b) OIL-PCR with primers targeting a plasmid-borne cmR gene was performed with a 1:1 mix of cmR positive E. coli and cmR negative V. cholerae cell suspensions with. A gradient of cell concentrations was tested (400–40,000 cells/μl), in addition to E. coli and V. cholerae suspensions alone as positive and negative controls. Control emulsions were mixed 1:1 after emulsification to test for droplet coalescence. (c) OIL-PCR with primers targeting a plasmid-borne cmR was performed after pretreating cells with (right) and without (left) dsDNase at two different 1:1 E. coli to V. cholerae cell suspension concentrations as well as on the individual bacterial strains for controls. (d) Multiplexed OIL-PCR was performed with primer sets targeting a genomic blaCTX-M gene in E. coli and a plasmid-borne blaTEM gene in V. cholerae. Experiments were performed in triplicate and on each of the organisms separately. Results are shown for the blaCTX-M (left) and blaTEM (right).
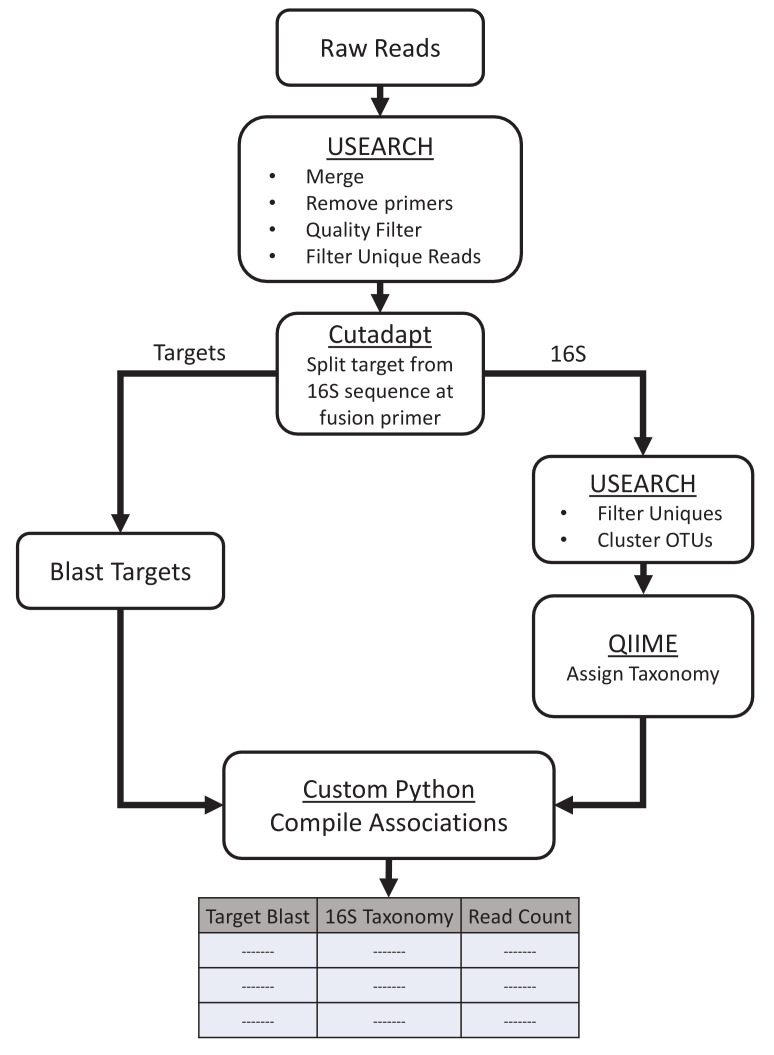
Figure 1—figure supplement 4. Computational workflow.

Figure 1—figure supplement 4.

Paired-end reads were merged, quality filtered, and filtered for unique reads before splitting them at the fusion primer junction with Cutadapt. The target portion of each read was blasted to confirm the sequence while the 16S portion was clustered into OTUs and assigned taxonomy with the QIIME RDP classifier and Silva database. The target and 16S assignments were then compiled together in python for analysis.
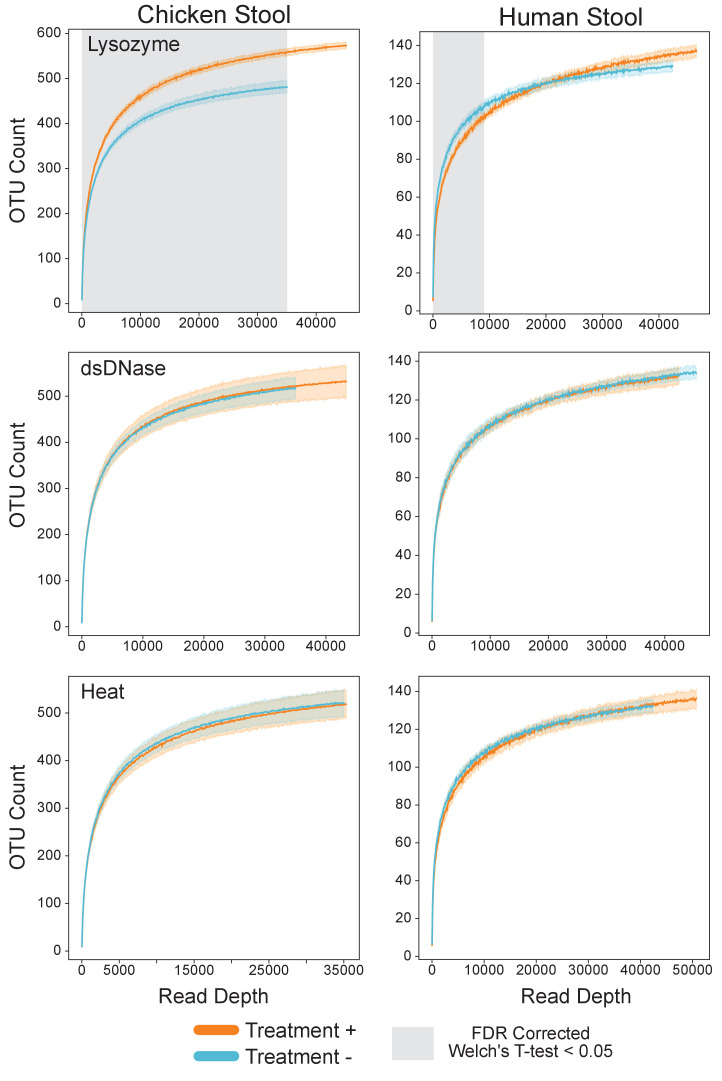
Figure 1—figure supplement 5. Lysozyme alone improved recovery of species.

Figure 1—figure supplement 5.

Rarefaction analysis of chicken (left) or human (right) gut microbiome samples with (orange) and without (blue) lysozyme (top), dsDNA treatment (middle) and heat (bottom). Grayed regions in the plot represent areas where the curves are significantly different from one another (p<0.05), according to an FDR-corrected Welch’s t-test.
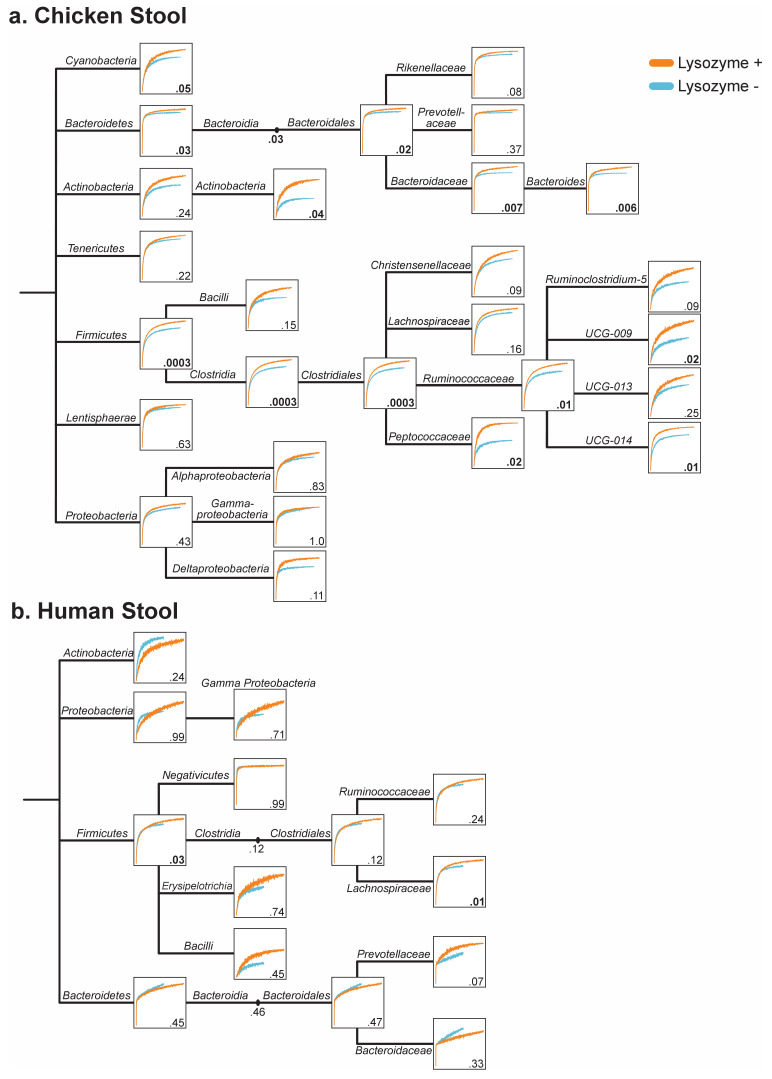
Figure 1—figure supplement 6. Lysozyme treatment improves OTU capture of most taxonomic groups in chicken and human stool.

Figure 1—figure supplement 6.

Rarefaction trees for (a) chicken, and (b) human stool generated for samples with and without lysozyme treatment. Rarefaction curves were generated at each taxonomic level containing 10 or more OTUs from Phylum to Genus and organized on the phylogenetic tree. Numbers within each box indicate the FDR-corrected Welch’s t-test score at the greatest sampling depth for each curve. Three redundant curves were left out for clarity.
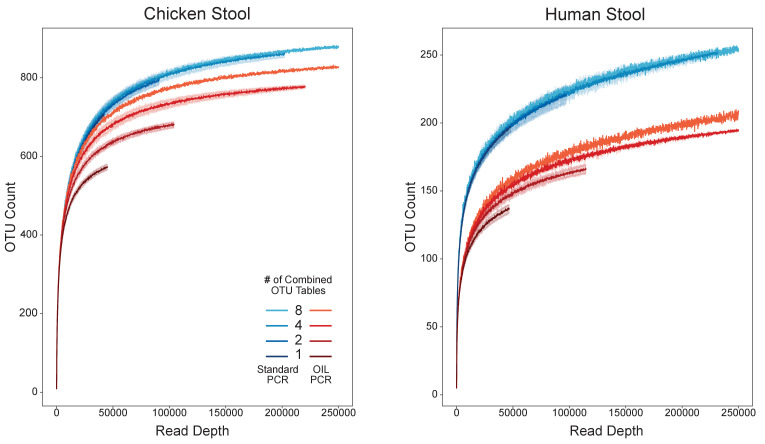
Figure 1—figure supplement 7. Combining replicates for increased depth improved recovery of species and reduced stochastic sampling bias.

Figure 1—figure supplement 7.

Rarefaction analysis of chicken (left) or human (right) gut microbiome samples performed with OIL-PCR (red) or standard DNA extraction and library prep (blue). OTU tables were repeatedly subsampled in groups of two, four, or eight replicates from eight total replicate 16S libraries.