

Abstract
The current ML approaches do not fully focus to answer a still unresolved and topical challenge, namely the prediction of priorities of COVID-19 vaccine administration. Thus, our task includes some additional methodological challenges mainly related to avoiding unwanted bias while handling categorical and ordinal data with a highly imbalanced nature. Hence, the main contribution of this study is to propose a machine learning algorithm, namely Hierarchical Priority Classification eXtreme Gradient Boosting for priority classification for COVID-19 vaccine administration using the Italian Federation of General Practitioners dataset that contains Electronic Health Record data of 17k patients. We measured the effectiveness of the proposed methodology for classifying all the priority classes while demonstrating a significant improvement with respect to the state of the art. The proposed ML approach, which is integrated into a clinical decision support system, is currently supporting General Pracitioners in assigning COVID-19 vaccine administration priorities to their assistants.
Keywords: COVID-19, Vaccination, Machine learning, XGBoost, Clinical decision support system, Model interpretability
1. Introduction
General Practitioners (GPs) will inevitably be involved in the mass vaccination against coronavirus 2019 (COVID-19). This is a substantially inevitable step, considering the widespread distribution of GPs in the territory, the knowledge of the clinical and care history of individual patients, the identification of frailty patients and, above all, the situations that should be more quickly protected by vaccination coverage. Unlike the flu vaccine, this vaccination campaign has been carried out with less rapidity for many reasons: for greater complexity in the procedure of creating the vaccine, for the contingent availability of vaccine doses, for the worldwide scope/global reach of this care strategy, for the necessity of carrying out the consequent administration of doses. This runs the risk of creating inequalities both in terms of health protection and in terms of social benefits among individuals who receives a vaccination at different times and with different priorities. In the light of these considerations, it seems appropriate, therefore, to hypothesize solutions that offer greater objectivity in assigning priority to vaccine administration. Support in this direction can be expected from artificial intelligence (AI) and machine learning (ML) solutions that, applied to the clinical-assistance Electronic Health Record (EHR) data of GPs, could provide indications that, although not definitive, would help the doctor to establish priorities to vaccine administration [1], [2].
Starting from a unified GPs data sharing protocol, the aim of this paper is to design and develop a ML algorithm, namely Hierarchical Priority Classification eXtreme Gradient Boosting (HPC-XGB), for classifying priorities for COVID-19 vaccine administration using the EHR data collected by GPs. The ML model learns prioritizing subjects according to the priority selection criteria defined by the Interim Recommendations on the target groups of the anti-SARS CoV-2/Covid19 vaccination issued by the Italian Ministry of Health (10/03/2021), which have been submitted to the attention of the State-Regions Conference and that identifies the prioritized categories for the vaccination1 .
This work contributes to the pattern recognition and clinical field for the following reasons: (i) it introduces a novel data-driven methodology for severity assessment and stratification of COVID-19 disease. The proposed ML approach seeks to provide indications that, although not definitive, would help the GP to establish the priority for vaccine administration; (ii) it measures the effectiveness of the proposed methodology for classifying all the priority classes across new unseen patients from different GPs and demonstrates a significant improvement with respect to the state of the art. In particular, the proposed method learns simultaneously discriminative pattern by taking into account all of these priority criteria (i.e. Age, Dysautonomia, Chronic pathologies and Obesity), thus avoiding specific bias on a single criteria; (iii) it evaluates the reliability of the proposed approach in the novel Italian Federation of GP EHR dataset (namely, FIMMG_COVID) composed of 17,147 patients collected from 11 different GPs’ (Core Data Team). The clinical significance of the proposed approach is confirmed by the integration as a clinical decision support system (CDSS) of the NetMedica Italia (NMI) platform for all NMI GPs. The CDSS is currently supporting the GPs for assigning COVID-19 vaccine administration priorities to their assistants2 .
Moreover, an in-depth analysis provided evidence on how the proposed method can be exploited to localize the most discriminative predictors for predicting priority classes. Such insight could further support the finer-grained priority classification for vaccine administration.
The paper is organized as follows: in Section 2, we provide a review of vaccine administration and Machine Learning based CDSS for clinical diagnosis. We describe the FIMMG_COVID EHR dataset 3 which we use for our investigation and the formulation and evaluation for our methodology described in Section 4. The results of our method are reported in Section 5, and we provided the clinical impact and conclusions in Sections 6 and 7.
2. Related work
2.1. Vaccine administration
Clinical literature offers several works with the aim of providing an affordable immunization program against different diseases by monitoring the vaccine administration [3]. In addition to that, research has been conducted even on vaccine prioritization, allocation and rationing [4] with a specific age-dependent mathematical model at the base. These works include also a Social Media sentiment analysis in order to seize public opinion on different vaccines and promote the campaign vaccination at a very large scale [5]. However, none of these works focus directly on the prediction of classes priority using ML models and data collected from GPs. Recently, the potential of ML application on the healthcare scenario gives a new angle to fight against the novel Coronavirus outbreak [6]. The ongoing COVID-19 pandemic is a reminder of the importance of vaccination. Indeed, it is a current and crucial priority to develop an effective and timely vaccine administration campaign towards this highly contagious disease [7]. For that reason, differently, from the current application of ML and AI for COVID-19 [6], we aim to answer this still unresolved and topical challenge, i.e. the prediction of priorities of COVID-19 vaccine administration.
2.2. Machine learning based clinical decision support system
Beyond clinical diagnosis, disease modeling and risk stratification, the employment of machine learning for designing CDSS is of practical interest. In this context, research is currently focusing on bridging the gap between development and implementation of clinical AI, by ensuring a still central position to human beings [8]. The generation of staggering volumes of EHR data along with the increase in computational power, storage and memory allow ML methodologies to create a great opportunity to perform a wide range of complex tasks with impressive accuracy in healthcare and epidemiological contexts[9]. Health informatics technology is crucial for predictive medicine providing clinicians tools that are able to give information about individuals at risk, disease onset and how to intervene. Data-driven techniques were used to analyze this multifactorial temporal data stored in EHR to discover complex patterns and set up advanced ML models, which can manage this enormous amount of data by predicting clinical outcomes and interpreting particular patterns sometimes unsighted by physicians. Moreover, these predictive ML models can help physicians to predict early-stage diseases by also detecting the most relevant clinical factors associated with a risk condition profile. ML techniques have been widely used for extracting information from such a large amount of data and have proven useful in improving diagnosis, outcome prediction, and management of chronic diseases. This includes a possibility for the identification of high risk for medical emergencies such as transition into another disease state, for example, the progression from pre-diabetes to T2D using routinely collected EHR data. The state of the art ML models employed in literature for disease modeling, disease prediction and risk stratification include Decision Tree [10], [11], RF [11], [12], XGB [13], [14], Linear Support Vector Machine (Li-SVM), Gaussian Support Vector Machine (G-SVM) [10], [11] and Lasso Support Vector Machine (La-SVM) [1]. Real-world datasets extracted from EHRs usually own high dimensionality data and several noisy and/or redundant features. Managing and modeling this amount of information may lead to several challenges such as i) overfitting; ii) reduction of interpretability; iii) data heterogeneity and iv) missing values. Recent research in this direction overcome the interpretability and data heterogeneity issues by proposing a feature selection and encoding approach which correspond respectively to correntropy regularized joint learning and deep polynomial network [15]. Still in[15], the authors proposed a predictive model based on a support set made by vector regression models for predicting the status of Alzheimer’s disease. Similarly, the authors in [16], leveraged a multiple kernel learning (MKL) to predict Alzheimer’s disease by modeling features of different nature and selecting kernels with more discriminative power. With the aim to improve the generalization performance by learning a shared structure, multi-task learning (MTL) based approaches were proposed in [17], [18] to model spatial correlation existing in Magnetic Resonance Imaging and cognitive measures. Accordingly, in [2] MTL was introduced to model a spatio-temporal relationship among laboratory exams and in presence of missing annotations [19] in order to predict complications related to type 2 diabetes and the evolution of kidney disease. Differently from all the above-cited work, our task aims to predict priorities for COVID-19 vaccine administration for patients cared by GP. Because of these differences in the task definition with respect to other state of the art work, our task includes some additional methodological challenges mainly related to: (i) avoiding possible bias in the prediction rule. Notice how the solution of this task mainly depends on multiple clinical criteria such as Age, Dysautonomia, Chronic pathologies and Obesity and (ii) handling categorical and ordinal data with highly imbalanced classes. This fact includes the possibility to have a greater focus (greater bias) on the largest priority classes than the minority classes. This paper has the ambition to overcame these challenges by proposing a Hierarchical Priority Classification-XGBoost. Differently from feature selection [15] and MKL strategies [16], our approach demonstrated a natural ability to handle heterogeneous data. Moreover, in contrast to MTL approaches [17], [18], our procedure allows to simultaneously predict multiple priority classes while avoiding unwanted bias in the prediction rule. Furthermore, alternatively to linearized sparse models, the approach proposed in [18] performs non-linear feature selection by associating a base kernel for each feature (non-linear multiple-kernel strategy), thus decreasing the overall interpretability. It is worth noting here that, baseline ordinal regression model may not overcome these challenges, thus providing a bias in the prediction rule and on the largest priority classes. Taking into account these differences in the task definition, with the main objective to demonstrate the effectiveness of the proposed solution, we decided to compare the proposed ML model with respect to other regression algorithms employed in literature for disease modeling, disease prediction and risk stratification. In particular, in Section 5.3 we have provided evidence of the superiority of our proposed approach.
2.3. Distance based methods for pattern recognition
Some distance-based methodology widely used for pattern recognition tasks, could be potentially tailored to provide indications and establish priorities for vaccine administration. These methods may include the complex evidential distance [20], the complex evidential quantum dynamical model [21] and a complex mass function [22] that are proposed to measure the difference or dissimilarity among pieces of evidence. In particular, the totality of these approaches were embedded in the decision-making algorithm for the purpose of solving a pattern recognition task in a medical diagnosis scenario. Despite the fact that all these methodologies produced a promising way of modeling and handling uncertain information that can be integrated as loss functions in a distance metric learning[23], the so-called curse of dimensionality problem can emerge. In our task indeed, the nature of the problem arises with a high dimensionality and a heterogeneous set of predictors. For this reason, our methodology is specifically conceived to manage data heterogeneity issues by reducing overfitting.
3. Materials
The proposed HPC-XGB methodology learns to classify priority for COVID-19 vaccine administration using the Italian Federation of General Practitioners dataset, which is an Electronic Health Record data of 17k patients collected by 11 General Practitioners.
3.1. FIMMG Netmedica cloud architecture
Nowadays, information systems that can support the territorial clinical network and potentially manage the entire clinical history of an individual where the information is shared are needed. The Italian Federation of General Practitioners (FIMMG), through NMI (a FIMMG Company), has designed an initiative of IT sharing among physicians, with an interface available to interoperate with the rest of the healthcare ecosystem. The most suitable solution was the adoption of a SaaS (Software as a Service) Cloud-based information system. The Saas Cloud aims to provide users an application accessible anywhere an Internet connection is available. The software and data reside on clusters of servers that deliver the service without the need to store data locally. The management of this initiative has been entrusted to NMI, with the aim of sharing the data in a safe way, providing a series of services and utilities available to the general practitioner who wants to join. NMI’s intervention is focused on the replication in a cloud of physicians’ EHR data, according to a standardized language. Physicians can access the database remotely, both with a PC and with mobile devices. The NMI Cloud Platform provides functionality for the individual physician but also for territorial aggregations. The most significant health events of non-hospitalized patients are stored in standardized EHR tables. Thus, EHR data allow tracing the particular conditions of patients such as rare and chronic diseases, disabilities and medical prescriptions. The heterogeneity of the collected EHR fields permits an analysis of the evolution of the disease progression, patient treatment and patient care. Timely observation of health status data in primary care, even in association with prolonged lifestyle and socio-economic information, is promising for predictive purposes and risk factors identification. Territorial care ensures continuity of care both in the management of patients discharged from hospitals after the post-COVID-19 acute phases and in the treatment of less severe post-COVID-19 follow-up at home. The criteria that have to be satisfied are the following: usability of data, security in the transmission and storage of data, inaccessibility of the cloud managers, accessibility to the components of the territorial care only through the release of individual credentials, compliance for the patients’ rights to control their personal data in the cloud and the possible partial or total obscuration. In addition, it is necessary that the provider of cloud computing services guarantees compliance with the organizational and functional methods defined by current European regulatory requirements, also in terms of integration between companies’ information systems and general practice information systems. Citizens are informed by their physicians, on the purposes for which their sensitive data are collected. Currently, the FIMMG NMI system manages more than 15 thousand GPs with approximately 15 million patients in total [24].
3.2. FIMMG EHR Database
FIMMG EHR database mainly consists of (i) patient-oriented data, which includes personal data, a series of fixed medical data (e.g. blood group, normal values for weight and pressure, etc.), medical history, exemptions, intolerances and allergies. and (ii) GP-oriented data, which include data produced by the GP’s activity, such as outpatient visits, prescriptions for therapies or specialist visits, illnesses or various certificates, vaccinations, extra services performed by the GP and patient monitoring. The standardized FIMMG EHR tables are summarized below: Anagraphic: the table includes the patient’s personal information, identification data and basic health information, Monitoring: the table stores demographic, anthropometric and pressure monitoring data, Examination Prescriptions: the table includes a prescription diary provided for the storage of all clinical prescriptions related to laboratory, instrumental, specialist, rehabilitation and hospital visits, Drug Prescriptions: the table stores data related to drug prescriptions, e-Prescriptions: the table stores data related to electronic prescriptions, Pathologies: the table contains the patient’s pathologies, Exemptions: the table stores data related to patient exemptions in terms of exemption codes, Laboratory: the table includes the results of any clinical exams prescribed by the GP, Illness/accident certificates: the table includes the medical certificates issued for any patient, Family History: the table contains family history data for each patient, Assistance periods: the table identifies the period of assistance that binds the GP to their patients, Intolerance-Allergies: the table stores data related to a patient’s allergies or intolerances, Clinical Diary: the table contains the GP’s clinical diary, Lifestyle: the table stores information on the patient’s lifestyle, with a particular focus on alcohol and smoking habits, Admission: the table stores admission information related to the diagnosis and identification of the facility is stored, Schedule: the table contains some planning activities for each patient, Vaccination: the table contains information related to vaccine administration.
3.3. FIMMG_Covid dataset
The FIMMG_COVID dataset originated from a subset of the FIMMG EHR database in use at FIMMG Netmedica cloud architecture. The FIMMG_COVID dataset consists of 17147 patients collected from 11 different GPs’ EHR data (see Table 1 ). The mean and standard deviation of the age of each GP’s patient group were also reported. The 11 GPs (Core Data Team) were selected from those enrolled in the NMI cloud platform and they actively participated in defining the priority criteria. The Core Data Team is located in the North (4 GPs), the Center (4 GPs) and the South (3 GPs) of Italy and they assisted all the patients considered in the study. Additionally, among the hundreds of GPs enrolled in the NMI platform, these 11 selected are intensively involved in improving all the NMI cloud platform services. The Ethical Committees of University approved the experimental study and its guidelines as a clinical noninterventional (observational) study. FIMMG_COVID dataset is anonymous and their use, detention and conservation are regulated by an agreement between the FIMMG, NMI and University. All the process is inside the European General Data Protection Regulation (GDPR). Standard medical care (prophylactic, diagnostic and therapeutic) will remain under the responsibility of the individual’s GP team. All the performed analysis and the proposed ML methodology are in compliance with the AI guidelines related to AI management plan toward a trustworthy AI, promoting human agency and oversight, robustness and safety, privacy and data governance, transparency, diversity, non-discrimination and fairness, societal and environmental well-being and accountability [25].
Table 1.
Number of patients (# pat) for each GP included in the NMI_FIMMG dataset. Mean and standard deviation of the age (mean[std]) of each GP’s patient group.
| GP | 1 | 2 | 3 | 4 | 5 | 6 | 7 | 8 | 9 | 10 | 11 |
|---|---|---|---|---|---|---|---|---|---|---|---|
| # pat | 1505 | 1497 | 1498 | 1491 | 1444 | 1533 | 1630 | 1855 | 1559 | 1600 | 1535 |
| Age | 55(20) | 50(19) | 51(19) | 52(19) | 55(20) | 53(21) | 46(20) | 51(20) | 47(21) | 47(20) | 43(18) |
The Anagraphic, Monitoring and Pathologies tables are included in the FIMMG_COVID dataset. The Anagraphic, Monitoring, and Pathologies tables were selected according to 11 THE GP’s indications as to the most potential discriminative field for classifying the severity of chronic disease and thus the PC classes. These tables result in the candidate features displayed in Table 2 . The patient and GP id are the key columns that are common for all tables. The GP id models the annotations variability and data collection among different GPs. The id DB takes into account the different NMI interfaces the GPs can handle during annotations and data collection procedures. The employed EHR reflects the clinical use-case scenario, where not all monitoring features are annotated uniformly across patients. As a consequence, a very sparse observation per patient corresponds to each different type of monitoring feature. The pathologies are classified according to the International Classification of Disease (ICD-9).
Table 2.
The list of tables and candidate features included in the FIMMG_COVID dataset. The candidate features are Patient id, GP id, Sex, Age, id Database employed by GP (id Db), Weight, Height, Waist circumference (WC), Systolic Blood Pressure (SBP), Diastolic Blood Pressure (DBP), International Classification of Disease code (ICD-9). The type of the features (dtype) and the % of missing values for each patient (% missing) are listed in the Table.
| Field | Anagraphic | Monitoring | Pathologies | |||||||
|---|---|---|---|---|---|---|---|---|---|---|
| Name | GP id | Sex | Age | id Db | Weight | Height | WC | SBP | DBP | ICD9 |
| dtype | Int | Cat | Int | Cat | Float | Float | Float | Int | Int | Cat |
| % missing | 0 | 0 | 0 | 0 | 64.3 | 63.8 | 80.3 | 45.5 | 45.5 | 0 |
3.4. Priority classes
The target variable is represented by the priority classes defined by the Core Data Team to their outpatient EHR data (FIMMG_COVID dataset) according to a unified priority selection criteria. These priority selection criteria take into account the Interim Recommendations on the target groups of the anti-SARS CoV-2/Covid19 vaccination issued by the Ministry of Health (document of 10/03/2021), submitted to the attention of the State-Regions Conference, which identifies the categories that should be prioritized for vaccination3 . Due to the large population included in the categories identified by the document, a further stratification is necessary in order to proceed with extreme rationality to the progression of vaccine administration. Thus the priority classes annotations were performed by GPs following these clinical criteria: Age: one of the parameters that most influence the risk of the disease; Dysautonomia: it requires the presence of assistants for daily life activities (e.g. bedding), thus leading to the high exposure of infection; Chronic pathologies: The concomitance of chronic pathologies (cardiovascular, respiratory, neoplastic, metabolic, neurological diseases) represents an element that significantly affects the prognosis; Obesity: it is identified from the epidemiological data and the recent clinical literature as one of the risk factors for greater COVID-19 severity and mortality [26]. The definition of these clinical criteria are in line with the recent clinical findings [27] that demonstrate how the age-related comorbidities have a more important weight than the age itself. All the considered criteria (Age, Dysautonomia, Chronic Pathologies and Obesity) are high-level clinical criteria that are not encoded as annotations in the FIMMG_COVID dataset. For that reason, a ML-based approach could be suitable in order to capture discriminative and high-level patterns within the EHR features that are hardly discoverable using ruled-based approaches.
All of these criteria should be taken into account for designing a ML model for predicting priority classes. In particular, the ML model should be addressed to focus simultaneously on finding a discriminative pattern on all of these criteria without reflecting a more focus on a single criterion, thus avoiding specific bias on Age, Dysautonomia, Chronic pathologies and Obesity. Following these criteria, Table 3 reported the priority classes identified by GPs and the number of patients attributed to each priority class by the Core Data Team in the FIMMG_COVID dataset. Notice how the priority class 23 is not affected by clinical criteria and thus not considered in the performed analysis. Chronic pathologies include cardiovascular, respiratory, neoplastic, metabolic, neurological disorders of different entities: small, medium and severe entities. The severe entity reflects an unstable clinical condition often following a recent episode of illness or aggravation of the underlying disease, with the compromised general condition and/or obvious organ failure. The medium entity reflects stable clinical conditions with a history of recent instability, risk factors with high unpredictability of evolution. The low entity reflects stable clinical conditions, the presence of morbid conditions characterizing risk factors and chronic diseases at the lowest stage.
Table 3.
The priority classes (PC) identified by GPs and the number of patients (# pats) attributed to each priority class by the Core Data Team in the FIMMG_COVID dataset.
| Category | PC | Description | # pats |
|---|---|---|---|
| Over 80 | 1 | Patients 90 years with Dysautonomia | 156 |
| 2 | Patients 80–90 years with Dysautonomia | 277 | |
| 3 | Patients 90 years | 123 | |
| 4 | Patients 80–89 years suffering from chronic pathologies of severe entity or severe obesity | 328 | |
| 5 | Patients 80–89 years suffering from chronic pathologies of medium entity or severe obesity. | 345 | |
| 6 | Patients 85–89 years | 40 | |
| 7 | Patients 80–84 years | 120 | |
| Highly Vulnerable | 8 | Highly Vulnerable Patients: Respiratory Diseases Cardiovascular Diseases Neurological Diseases/Disabilities Endocrinologic Diseases and Diabetes Renal Diseases Autoimmune Diseases Liver Diseases Cerebrovascular disease Oncologic/Ematologic diseases Down’s Syndrome Transplanted Severe Obesity: BMI >35 | 1425 |
| 75–79 | 9 | Patients 75–79 years suffering from chronic pathologies of severe-medium entity | 160 |
| 10 | Patients 75–79 years suffering from chronic pathologies of low entity | 217 | |
| 11 | Patients 75–79 years | 88 | |
| 70–74 | 12 | Patients 70–74 years suffering from chronic pathologies of severe-medium entity | 148 |
| 13 | Patients 70–74 years suffering from chronic pathologies of low entity | 358 | |
| 14 | Patients 70–74 years | 144 | |
| Vulnerable < 70 | 15 | Patients 60–69 years suffering from chronic pathologies of severe entity | 152 |
| 16 | Patients 50–59 years suffering from chronic pathologies of severe-medium entity | 527 | |
| 17 | Patients 60–69 years suffering from chronic pathologies of low entity | 951 | |
| 18 | Patients 50–59 years suffering from chronic pathologies of low entity | 818 | |
| 19 | Patients 30–49 years suffering from chronic pathologies of low entity | 779 | |
| 20 | Patients 16–29 years suffering from chronic pathologies of low entity | 132 | |
| 55–69 | 21 | Patients 60–69 years | 707 |
| 22 | Patients 55–59 years | 828 | |
| 18–54 | 23 | School personnel (<55 yrs.), Armed forces and police, Prison, Community places, Other essential services | None |
| 18–54 | 24 | Patients 50–54 years | 715 |
| 25 | Patients 30–49 years | 4215 | |
| 26 | Patients 16–29 years | 3276 |
4. Methods
The proposed HPC-XGB predicts the priority classes (labels) defined in Table 3 using as predictors (features) the candidate features listed in Table 2. The overall approach is depicted in Fig. 1 : a feature extraction based on a GP’s suggestion is followed by the proposed HPC-XGB. The provided ML methodology comprise of two hierarchical layers, i.e. layer A and layer B, for predicting vulnerable class (task A) and age-dependent class (task B) respectively. The way each model solved independently a different classification task related to the level of vulnerability (task A) and the severity of disorders (task B) has to be noticed.
Fig. 1.

The overall proposed method for classifying priorities of COVID-19 vaccine administration. The feature extraction is based on GP’s suggestion. Afterward, the proposed machine learning methodology comprised of two hierarchical layers, for solving task A (vulnerability) and subtasks B (severity of disorders).
4.1. Features extraction
Following state of the art works for predictive medicine [19], [28] the average of each Monitoring feature (Weight, Height, Waist circumference, Systolic Blood Pressure and Diastolic Blood Pressure) was computed for each patient. A missing values occurrence (NaN) highlights that the monitoring exam is not available for the patient and thus was replaced with zero values (0-value imputation).
Although the baseline XGB has a natural ability to handle missing values, by learning the best direction to handle missing values [29], the 0-value imputation allows to better characterize the meaning of the missing occurrences, i.e. that the monitoring exam is not available for the patient and thus was replaced with 0-value. Moreover, all the patients who do not have the Age feature are excluded. This fact leads to consider 17062 out of 17147 patients. The one-hot hierarchical encoding procedure was used on categorical features (i.e., ICD9 code of Pathologies features). Hence, the 1 and 0 display the presence or absence of a specific ICD9 pathology for each subject respectively. Since the level of detail among code categories varies greatly [30], the 20 most frequent ICD9-macro categories (i.e. the first 3 digits of ICD9 codes) were encoded (see Table 4 ).
Table 4.
The list of encoded ICD9 pathology using a one-hot hierarchical encoding procedure: for the 20 most frequent ICD9-macro-categories (ICD9-MC) (i.e. the first 3 digits of ICD9 codes). The 1 displays the presence of at least one of the ICD9 codes.
| ICD9-MC | Description | ICD9 codes |
|---|---|---|
| 780 | General symptoms | 780.0–780.99 |
| 462 | Acute Pharyngitis | 462.0 |
| 595 | Cystitis | 595.0, 595.1, 595.82 |
| 522 | Diseases of pulp and periapical tissues | 522.0 |
| 724 | Other and unspecified disorders of back | 724.0–724.8 |
| 464 | Acute laryngitis and tracheitis | 464.0, 464.3, 464.4 |
| 401 | Essential hypertension | 401.0, 401.1, 401.9 |
| 466 | Acute bronchitis and bronchiolitis | 466.0, 466.11 |
| 789 | Other symptoms involving abdomen and pelvis | 789.0–789.6 |
| 715 | Osteoarthrosis and allied disorders | 715.09, 715.11–715.17, 715.9 |
| 530 | Diseases of esophagus | 530.0, 530.1, 530.3, 530.8 |
| 719 | Other and unspecified disorders of joint | 719.0–719.5, 719.7 |
| 272 | Disorders of lipoid metabolism | 727.0–272.8 |
| 465 | Acute upper respiratory infections of multiple or unspecified sites | 465.9 |
| 788 | Symptoms involving urinary system | 788.0–788.6 |
| 723 | Other disorders of cervical region | 723.0–723.7 |
| 799 | Other ill-defined and unknown causes of morbidity and mortality | 799.0–799.4, 799.8 |
| 521 | Diseases of hard tissues of teeth | 521.0–521.8 |
4.2. Baseline XGBoost
The proposed HPC-XGB consists of two hierarchical layers of different XGBoost models. The XGBoost method was applied as a prediction model for each layer in consideration of its characteristics of high generalization performance, and the low risk of overfitting and high interpretability that outperforms other data mining methods widely used for solving predictive medicine tasks using tabular data, i.e. EHR data [13], [14]. The gradient tree boosting algorithms extend the concept of adaptive boosting by sequentially adding predictors and correcting previous models using the gradient descent algorithm [29]. Although traditional methods employed univariate and multivariate statistical analysis to answer pattern discrimination questions, the application of a machine learning approach based on the XGB model improves the sensitivity of detection and generalization performance by combining multiple information across several variables (i.e., high dimensional problem and data heterogeneity) with relative low samples data. Moreover, the exact aim of our work was to create a model that could be integrated into a Clinical Decision Support System (CDSS) with no need to apply human intervention during the preprocessing stage. Indeed, since XGB makes no assumption on data distribution and uses individual decision trees, it is potentially unaffected by multi-collinearity.
For the FIMMG_COVID dataset examples/patients with features were considered for the training stage. The is the label of the th patient sample . The tree ensemble model uses additive functions to predict the output as follows:
| (1) |
where is the space of regression trees. Therefore the following regularized empirical loss function was minimized:
| (2) |
where
| (3) |
is the depth of the tree, is a differentiable convex loss function that measures the difference between the prediction and the target , is the regularization term which controls the complexity of the model via the and hyperparameters. The hyperparameters and are optimized in the validation set in terms of maximum depth of a tree and penalty (see Table 5 ).
Table 5.
Range of Hyperparameters (Hyp) for each model: HPC-XGB (our), Decision Tree (DT), Random Forest (RF), XGB with different losses functions (mean square error, tweedie and gamma), Linear Support Vector Machine (Li-SVM), Gaussian Support Vector Machine (G-SVM) and Lasso Support Vector Machine (La-SVM).
| Model | Hyp | Range |
|---|---|---|
| HPC-XGB (our) | learning rate of estimators/iterations () max depth () of predictors to select penalty () | {5, 10, 15, 20, 25, 29} |
| XGB [13], [14] | learning rate of estimators/iterations () max depth () of predictors to select penalty () | {5, 10, 15, 20, 25, 29} |
| DT [10], [11] | max depth | |
| RF [11], [12] | of DT of predictors to select max depth | |
| Li-SVM [10], [11] | Box Constraint | |
| G-SVM [10], [11] | Box Constraint Kernel Scale | |
| La-SVM [1] | Lambda | |
| Ensemble La-SVM [15] | Lambda | |
| MTL [18] | penalty penalty |
The loss function is minimized in an iterative manner as follows:
| (4) |
where is the prediction of the -th instance at the -th iteration. The standard exact greedily algorithm enumerates over all the possible splits on all the features and selects the best split for minimizing the Eq. 4. Since it is computationally demanding to enumerate all the possible splits for candidate features the XGBoost extension introduces a theoretically justified weighted quantile sketch for approximate learning. Moreover, a sparsity-aware algorithm for handling sparse data (missing values) is adopted [29].
4.3. Hierarchical priority classification XGBoost
The proposed HPC-XGB is described in Fig. 2 and all the calculation steps are described in Algorithm 1 . The Age is one of the parameters that most influence the risk of the disease and thus the classification of priority classes. However, the aim is to enforce the ML algorithm to focus not only on a single criteria (e.g. thus avoiding specific bias on Age), but instead to learn discriminative pattern on specific patient conditions also related to Dysautonomia, Chronic pathologies and Obesity. For that reason, our ordinal problem was split into two classification layers (Layer A and Layer B). In the first layer, task A is defined as the classification between the high vulnerable patients and the other categories. Notice how this task does not only depend on age but on all considered clinical criteria:
| (5) |
where , . The weighted logistic loss function was used as the objective function of the XGB A:
| (6) |
where and are the number of training patients belonging to and respectively. Following the rationale described by Eq. 4, the second layer B was designed by clustering each sub-task Bs related to the where the target classes are independent with the Age features for at least one subset of patients collected by one GP:
| (7) |
where is the total number of sub-tasks B, is the GP id, is the associated labels for the sub-task Bs and GP id and is the predictors for the sub-task Bs and GP id. The independence of binary subtasks was measured according to a Mann-Whitney U test, a nonparametric statistical significance test for determining whether two independent samples were drawn from a population with the same distribution. In particular, the statistical test pointed out that for each sub-task there is at least one subpopulation from one GP where it is not possible to reject the null hypothesis () that there is no difference in the distribution of the between the two associated label (). Similarly, the independence of multiclass subtasks was measured according to a Kruskal Wallis test, a generalization of the Mann-Whitney U test for the case of multiple distributions. Notice how each subtask is focused to discriminate the PC in a specific age range. Indeed, this classification is mainly dependent from the other clinical criteria (i.e. dysautonomia, chronic pathologies and obesity). The weighted logistic loss function was used as the objective function of the XGB B for solving binary sub-tasks:
| (8) |
where are the number of training patients for the subtask , and are the number of patients belonging to the binary classes (). The weighted categorical cross-entropy loss (soft-max loss) was used as the objective function of the XGB B models for solving multi-class sub-tasks:
| (9) |
Fig. 2.

The proposed Hierarchical Priority Classification XGBoost methodology for COVID-19 vaccine administration. The first layer A focuses on the classification between the high vulnerable patients and the other categories. The second layer focuses on discriminating the PC in a specific age range categories. In particular PCs with the same age range are highlighted with the same color.
Algorithm 1.
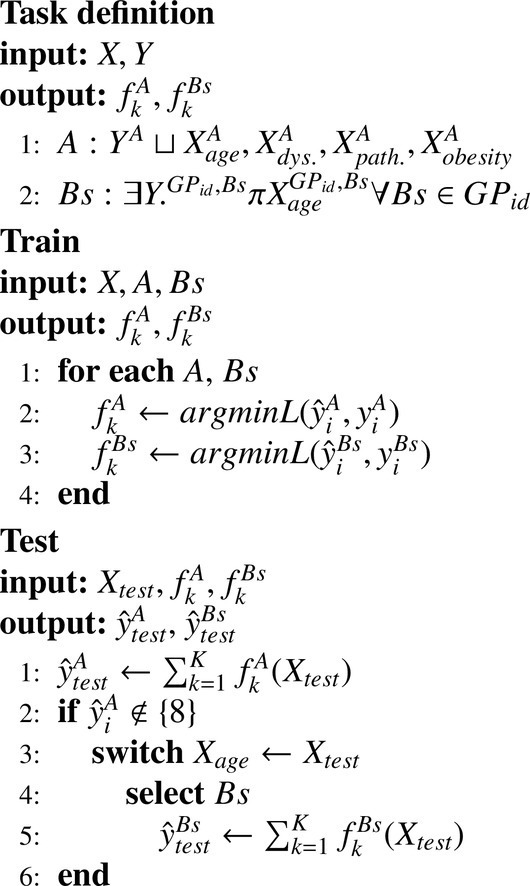
Hierarchical Priority Classification XGBoost methodology.
Notice how the additional weight introduced in the employed loss function (see (6), (8), (9)), allows to deal with the naturalistic imbalanced setting of this task.
4.4. Experimental procedure
The performance of the proposed HPC-XGB was evaluated using a Leave One General Practitioner Out (LOGPO) procedure (see Fig. 3 )4 . In particular, patients collected from ten GP and one GP were alternately selected for training and testing respectively. The optimization of the HPC-XGB hyperparameters was performed by implementing a grid-search and optimizing the macro-recall score in a nested LOGPO. Hence, each split of the outer loop was trained with the optimal hyperparameters tuned in the inner loop. Although this procedure is computationally expensive, it allows obtaining an unbiased and robust performance evaluation [31]. The experimental procedure is closer to priority stratification purposes, since the HPC-XGB model needs to generalize the decision rules, learned from subjects who already have the PC, across new unseen patients.
Fig. 3.

Overview of the performed experimental procedure. A Leave One General Practitioner Out (LOGPO) procedure was implemented. The optimization of the HPC-XGB hyperparameters was performed by implementing a grid-search and optimizing the macro-recall score in a nested LOGPO. Hence, each split of the outer loop was trained with the optimal hyperparameters tuned in the inner loop.
4.4.1. Measures
The predictive performance of the proposed HPC-XGB was evaluated for solving task A (vulnerability) and subtasks B (severity of disorders). The predictive performance was evaluated according to the following measures: accuracy: the percentage of correct predictions; macro-recall: the recall is calculated for each class and then take the unweighted mean. The recall reflects the percentage of true positive over the condition positive (sensitivity); confusion matrix: the square matrix that shows the type of error in a supervised paradigm; false Positive Rate: the false positive rate for task A; false Negative Rate (FNR): the false negative rate for task A; receiver operating characteristic (ROC) curve: is designed by plotting the true positive rate (TPR) against the false positive rate (FPR) at various threshold settings. It illustrates the performance of a binary classifier as its discrimination threshold is varied. From now on we refer to the recall, False Positive Rate and False Negative Rate as recall, FPR and FNR respectively.
4.5. Experimental comparisons
It is worth noting here that, the goal of our paper is to establish the priorities to COVID-19 vaccine administration and the FIMMG_COVID dataset is currently the only dataset for this. However, we decided to compare the proposed HPC-XGB with respect to other ML algorithms employed in literature for disease modeling, disease prediction and risk stratification. These state of the art ML models include Decision Tree [10], [11], RF [11], [12], XGB with different losses functions (mean square errro, tweedie and gamma) [13], [14], Linear Support Vector Machine (Li-SVM), Gaussian Support Vector Machine (G-SVM) [10], [11] and Lasso Support Vector Machine (La-SVM) [1]. Since our goal is to solve an ordinal regression task (classification of 25 PCs), as comparisons, the regression formulation of these models was adopted. In the experimental comparison we have further included the features selection and ensemble of support vector regression approach proposed in [15] along with the multi-task regression-based approach proposed in [17] [18]. Similarly to [15], we trained different La-SVM using different feature modalities (Anagraphic, Monitoring and Pathologies). The final prediction is achieved by average the single model prediction. As a comparison, we also employ a similar MTL strategy employed in [18]. Different from the linearized sparse models, the approach proposed in [18] performs non-linear feature selection by associating a base kernel for each feature (non-linear multiple-kernel strategy), thus decreasing the interpretability. Hence, we adopt as a comparison the linearized MTL strategy for feature learning (MTL). Notice how in the MTL comparison the task A and task B are solved simultaneously by learning a similar sparse feature structure. The experimental comparisons aim to evaluate the potential of the proposed HPC-XGB for classifying all 25 PCs. By performing these comparisons the aim is to measure how the HPC-XGB is able to improve the state-of-the-art methodologies in order to firstly discriminate the highly vulnerable class (PC=8) and at the same time to provide a classification among different age-dependent PCs. Hence, three different testing procedures were performed and they are related to: (i) testing procedure a): performances were evaluated with respect to the state-of-the-art regression model (trained on all PC classes) for predicting PC 8 with respect to the other PC classes. We measured the performance of testing procedure a) in terms of overall accuracy, recall, FPR and FNR; (ii) testing procedure b) the performance were evaluated with respect to the state-of-the-art regression model (trained on all PC classes except class 8) for predicting all PC classes except class 8. We measured the performance of testing procedure b) in terms of overall accuracy and recall. Since the testing procedure b) can be conceived as a standard regression task we also evaluated the performance in terms of Mean Absolute Error (MAE), Mean Square Error (MSE) and coefficient of determination (R2 score); (iii) testing procedure c) the performance was evaluated with respect to the best competing state-of-the-art classification model trained for each subtask. The performance of testing procedure were measured c) in terms of average accuracy and recall. For all the experimental comparisons and testing procedures, the recall was the selected metric optimized in the validation set. The rationale behind the optimization of the recall in the validation set is justified by the fact to achieve an objective that is more clinically relevant for a screening purpose. Thus, the authors, following this rationale, preferred to minimize the false negatives and achieve a trade-off between sensitivity and specificity. This choice has been also performed according to the most recent state-of-the-art approaches in predictive medicine scenario [1], [2]. Hence, to test HPC-XGB for a significant difference from chance-level classification, the one-sided Wilcoxon signed-rank test (significance level = 0.05) was performed comparing the recall distribution with respect to the level of chance (i.e. 0.5 for the binary task and for the multi-class task). Moreover, the non-parametric one-sided Wilcoxon signed-rank test (significance level = 0.05) was also used to test the overall performance of the HPC-XGB for a significant difference from the general performance of the state of the art models (testing procedure a) and b)) and to perform a statistical comparison between the HPC-XGB and the best standard supervised learning competitor (testing procedure c). Table 5 summarizes the range of the hyperparameters optimized for each ML model during the LOGPO procedure.
5. Results
Results of the proposed HPC-XGB and the comparisons with respect to the state of the art were evaluated in 5.1, 5.2 and Section 5.3 respectively. Afterwards, the model interpretability was evaluated in terms of the most discriminative features that influence the prediction of HPC-XGB in Section 5.4.
5.1. Predictive performance
Table 6 shows the predictive performance of the HPC-XGB for each task. We reported the average and the standard deviation of accuracy and recall across all runs of the LOGPO procedure. For the task A the HPC-XGB achieved the best performance (accuracy = , recall = ). For all the B subtasks except B1, the performance of HPC-XGB is significantly higher than the chance level. This fact can be motivated by the high imbalanced setting of task B1: only a few patients (131, less than 4%) have the PC equals to 20. With the purpose of providing additional proof behind our feature extraction step, we performed additional experiments by (i) considering all ICD-9 pathology categories and (ii) including the one-hot hierarchical encoding of Exemptions and Drug Prescriptions with all ICD-9 pathology categories. The additional experiment (i) and (ii) highlighted a decreasing of the averaged-recall of and respectively, for solving Task A. As a result, the 29 features constitute the most discriminative predictors to feed our HPC-XGB methodology
Table 6.
Performances in terms of average accuracy and average recall of the LOGPO evaluation procedure for HPC-XGB for each task. Stars indicate whether the recall distribution over the 11 GPs (Core Data Team) is significantly higher than chance level (i.e. 0.5 for binary task and for multi-class task) according to the one-sided Wilcoxon signed-rank test (). The # number of patients refers to the total number of patients for the selected task. The labels refer to the considered PCs for the selected task.
| Model | # of patients | Labels | Accuracy (mean [std]) | Recall (mean [std]) |
|---|---|---|---|---|
| HPC-XGB A | 17,062 | {8,others} | 0.854 (0.060) | 0.768 (0.109) |
| HPC-XGB B1 | 3392 | {20,26} | 0.661 (0.327) | 0.493 (0.092) |
| HPC-XGB B2 | 4972 | {19,25} | 0.764 (0.230) | 0.701 |
| HPC-XGB B3 | 2872 | {16,18,22,24} | 0.652 (0.148) | 0.553 (0.099) |
| HPC-XGB B4 | 1796 | {15,17,21} | 0.573 (0.213) | 0.468 (0.077) |
| HPC-XGB B5 | 1104 | {9,10,11,12,13,14} | 0.301 (0.202) | 0.266 (0.155) |
| HPC-XGB B6 | 1110 | {2,4,5,6,7} | 0.453 (0.263) | 0.369 (0.139) |
| HPC-XGB B7 | 279 | {1,3} | 0.734 (0.141) | 0.750 (0.117) |
Fig. 4 shows the recall and the ROC and the Area Under Curve (AUC) of HPC-XGB for each subset of patients assigned by different GP in each run of LOGPO procedure for solving task A. Notice how the recall and the AUC remain always above chance level.
Fig. 4.

ROC and Area Under Curve (AUC) of HPC-XGB for each subset of patients assigned by different GP in each run of LOGPO procedure for solving task A.
5.2. Computation time
The theoretical complexity of the proposed model depends on the maximum depth of the tree () and the # of estimators (). However, the block structure for parallel learning and the approximate algorithm [29] were employed for reducing the training complexity, especially when is higher. The time complexity can be computed as where B is the maximum number of rows in each block and depends on the number of the CPU cores, thus achieving, a competitive gain with respect to standard gradient boosting algorithm . The experimental computation time analysis for the training and for the testing stage are performed in Table 7 . The computation time for the training stage was computed by considering only the outer loop of the LOGPO procedure, i.e. once the hyperparameter tuning procedure was completed) (see Fig. 3). The proposed HPC-XGB algorithm achieved a competitive computation time for both the training (less than 0.350 sec) and testing stage (less than 0.003 sec) for solving Task A and each B subtasks. All the experiments are reproducible, and they were performed using a 2.3 GHz Intel Core i7 quad-core with 16GB of RAM.
Table 7.
Results performance in terms of computation time: training and testing time. The average (mean) and the standard deviation (std) were reported for each run of the LOGPO procedure.
| Model | # of patients | Labels | Training time | Testing time |
|---|---|---|---|---|
| mean [sec x fold] std | mean [sec x fold] std | |||
| HPC-XGB A | 17,062 | {8,others} | 0.347 0.030 | 0.002 0.000 |
| HPC-XGB B1 | 3392 | {20,26} | 0.064 0.005 | 0.000 0.000 |
| HPC-XGB B2 | 4972 | {19,25} | 0.100 0.005 | 0.001 0.000 |
| HPC-XGB B3 | 2872 | {16,18,22,24} | 0.246 0.009 | 0.001 0.000 |
| HPC-XGB B4 | 1796 | {15,17,21} | 0.199 0.014 | 0.001 0.000 |
| HPC-XGB B5 | 1104 | {9,10,11,12,13,14} | 0.291 0.064 | 0.001 0.000 |
| HPC-XGB B6 | 1110 | {2,4,5,6,7} | 0.173 0.012 | 0.001 0.000 |
| HPC-XGB B7 | 279 | {1,3} | 0.010 0.002 | 0.000 0.000 |
5.3. Comparisons with respect to the state of the art
The comparisons with respect to the state of the art were performed using the testing procedure a), b) and c) described in 4.5. In the testing procedure a) (see Table 8 ) we evaluated the performance with respect to the state-of-the-art regression model (trained on all PC classes) for predicting PC 8 with respect to the other PC classes. The proposed HPC-XGB model overcomes the best competitors (i.e. DT [10], [11]) and the baseline XGB in terms of recall of about 29.4% and 47.7% respectively for classifying high vulnerable subjects (PC=8).
Table 8.
Comparison of HPC-XGB with respect to the state-of-the-art regression model for predicting PC 8 with respect to the other PC classes. We measured the performance of testing procedure a) in terms of overall accuracy, recall, FPR and FNR. indicates whether the overall recall of the proposed HPC-XGB is significantly higher than other state of the art models according to the one-sided Wilcoxon signed-rank test (significance level = 0.05).
| Model | # FPR | FNR | Accuracy | Recall |
|---|---|---|---|---|
| HPC-XGB | 0.137 | 0.234 | 0.855 | 0.814 |
| XGB (MSE) [13], [14], [32] | 0.008 | 0.891 | 0.918 | 0.551 |
| XGB (tweedie) [13], [14], [32] | 0.007 | 0.930 | 0.916 | 0.531 |
| XGB (gamma) [13], [14], [32] | 0.007 | 0.902 | 0.918 | 0.546 |
| DT [10], [11] | 0.086 | 0.656 | 0.866 | 0.629 |
| RF [11], [12] | 0.011 | 0.910 | 0.913 | 0.539 |
| Li-SVM [10], [11] | 0.016 | 0.954 | 0.905 | 0.515 |
| G-SVM [10], [11] | 0.012 | 0.973 | 0.907 | 0.507 |
| La-SVM [1] | 0.019 | 0.988 | 0.899 | 0.496 |
| Ensemble SVR [15] | 0.024 | 0.947 | 0.898 | 0.514 |
| MTL [18] | 0.020 | 0.971 | 0.900 | 0.504 |
In the testing procedure b) (see Table 9 ) we evaluated the performance with respect to the state-of-the-art regression model (trained on all PC classes except class 8) for predicting all PC classes except class 8. The proposed HPC-XGB model overcomes the best competitors (i.e. DT [10], [11]) and the baseline XGB in terms of recall of about 24.3% and 114.6% respectively for classifying all age-related classes.
Table 9.
Comparison of HPC-XGB with respect to the state-of-the-art regression model for predicting all classes except class 8. We measured the performance of testing procedure b) in terms of overall accuracy and recall, Mean Absolute Error (MAE), Mean Square Error (MSE) and coefficient of determination (R2 score). indicates whether the overall recall of the proposed HPC-XGB is significantly higher than other state of the art models according to the one-sided Wilcoxon signed-rank test (significance level = 0.05).
| Model | MAE | MSE | R2 | Accuracy | Recall |
|---|---|---|---|---|---|
| HPC-XGB | 1.585 | 8.581 | 0.812 | 0.646 | 0.470 |
| XGB (MSE) [13], [14], [32] | 1.264 | 4.002 | 0.912 | 0.460 | 0.207 |
| XGB (tweedie) [13], [14], [32] | 1.262 | 3.963 | 0.913 | 0.462 | 0.219 |
| XGB (gamma) [13], [14], [32] | 1.279 | 3.973 | 0.913 | 0.436 | 0.218 |
| DT [10], [11] | 1.459 | 7.573 | 0.835 | 0.622 | 0.378 |
| RF [11], [12] | 1.376 | 4.920 | 0.892 | 0.453 | 0.236 |
| Li-SVM [10], [11] | 2.742 | 12.887 | 0.718 | 0.124 | 0.057 |
| G-SVM [10], [11] | 2.173 | 12.154 | 0.734 | 0.340 | 0.128 |
| La-SVM [1] | 2.737 | 12.357 | 0.730 | 0.133 | 0.060 |
| Ensemble SVR [15] | 3.318 | 19.316 | 0.578 | 0.043 | 0.034 |
| MTL [18] | 3.111 | 15.258 | 0.716 | 0.108 | 0.080 |
In the testing procedure c) (see Table 10 ) we compared the best performing state of the art model (DT [10], [11]) trained for each subtask with respect to the proposed HPC-XGB. The proposed HPC-XGB model overcomes significantly the best competitors (i.e. DT [10], [11]) in terms of recall for classifying subtask B2,B3,B4,B6 and B7.
Table 10.
Comparison of HPC-XGB with respect to the best-performing state of the art model (DT [10], [11]) trained for each subtask. We measured the performance of testing procedure c) in terms of average accuracy and average recall. indicates whether the recall distribution of the proposed HPC-XGB over the 11 GPs (Core Data Team) is significantly higher than DT according to the one-sided Wilcoxon signed-rank test (significance level = 0.05).
| Model | # of patients | Labels | Accuracy (mean [std]) | Recall (mean rev[std]) |
|---|---|---|---|---|
| HPC-XGB B1 | 3392 | {20,26} | 0.661 (0.327) | 0.493 (0.092) |
| DT [10], [11] B1 | 3392 | {20,26} | 0.912 (0.113) | 0.499 (0.024) |
| HPC-XGB B2 | 4972 | {19,25} | 0.764 (0.230) | 0.701 (0.155) |
| DT [10], [11] B2 | 4972 | {19,25} | 0.801 (0.082) | 0.674 (0.116) |
| HPC-XGB B3 | 2872 | {16,18,22,24} | 0.652 (0.148) | 0.553 (0.099) |
| DT [10], [11] B3 | 2872 | {16,18,22,24} | 0.535 (0.163) | 0.458 (0.105) |
| HPC-XGB B4 | 1796 | {15,17,21} | 0.573 (0.213) | 0.468 (0.077) |
| DT [10], [11] B4 | 1796 | {15,17,21} | 0.477 (0.152) | 0.401 (0.064) |
| HPC-XGB B5 | 1104 | {9,10,11,12,13,14} | 0.301 (0.202) | 0.266 (0.155) |
| DT [10], [11] B5 | 1104 | {9,10,11,12,13,14} | 0.277(0.148) | 0.268 (0.143) |
| HPC-XGB B6 | 1110 | {2,4,5,6,7} | 0.453 (0.263) | 0.369 (0.139) |
| DT [10], [11] B6 | 1110 | {2,4,5,6,7} | 0.377 (0.159) | 0.289 (0.097) |
| HPC-XGB B7 | 279 | {1,3} | 0.734 (0.141) | 0.750 (0.117) |
| DT [10], [11] B7 | 279 | {1,3} | 0.661 (0.121) | 0.643 (0.110) |
5.4. Model interpretability
To provide insight into the model interpretability (see Fig. 5 ), the most discriminative predictors for classifying priority classes were highlighted. In particular, we computed the importance of each input feature in our HPC-XGB by considering the number of times a feature is used to split the data across all trees. Then, we averaged the importance across each LOGPO run. The computed feature importance value was normalized from 0 to 1 with respect to all elements. Notice how although the age is one of the most discriminative predictors for solving task A, B3, B5, B7, other clinical factors (i.e. the presence of a specific pathology) represent the most discriminative predictors for solving task B2, B4 (icd9_464 Acute laryngitis and tracheitis) and for solving task B6 (icd9_522 Diseases of pulp and periapical tissues). A preliminary validation made by the Core Data Team confirms how the model interpretability results of our study provided novel insight into the best combination of conventionally and non-conventionally used features for discriminating vulnerability and disease severity. Moreover, the higher feature importance of GP id demonstrated the high variability of the annotation procedure that can be subjectively conditioned by the GP itself and the GP’s knowledge of the patient’s medical history.
Fig. 5.

Features importance for each different PC task.
6. Clinical decision support system for vaccine administration
The clinical impact of the proposed approach is confirmed by the integration as a CDSS of the NetMedica Italia (NMI) platform for all NMI GPs (see Fig. 6 ). The CDSS, named Pri.Sma, is currently supporting the GPs for assigning COVID-19 vaccine administration priorities to their assistants5 . The impact of the proposed CDSS in terms of computation time is confirmed in Table 7. It allows GPs to save significant time by providing in a few thousandths of a second the vaccine administration priorities to the GP’s assistants. NMI is an online platform that allows physicians to replicate their outpatient database in the cloud, according to a standardized scheme that allows the sharing of care data between eligible GPs, belonging to pre-established aggregative forms. The data, protected by an asymmetric key cryptography algorithm, can only be accessed using personal credentials. From the NMI portal, it is possible for the GP to access the Pri.Sma service. The Pri.Sma API allows the GP to run the proposed HPC-XGB for stratifying their patients according to the priority classes described in Table 3. The Pri.Sma API is directly installed in the NMI data center, where the analyzed data can therefore remain in place. The FIMMG_COVID dataset consists of an anonymized temporal copy of patients assigned to Core Data Team. The feature extraction and model building of HPC-XGB are anonymously exposed via APIs. The Pri.Sma APIs ensure that the feature extraction and model building procedure is a complete readily accessible, legally and ethically appropriate solution for preserving privacy and patient confidentiality. The clinical supervision is ensured throughout the testing phase of the CDSS: the GP can change priority class prediction for correcting errors at any time. This outcome is in compliance with the EU AI guidelines related to management plan toward a trustworthy AI, promoting human agency and oversight, robustness and safety, privacy and data governance [25]. The Pri.Sma API can be exploited to interoperate with third parties platforms and software solutions on external databases that can use the rules of the HPC-XGB model by integrating the Pri.Sma APIs.
Fig. 6.

The integration of the proposed HPC-XGB as a clinical decision support system of the NetMedica Italia (NMI) platform for all NMI GPs. The CDSS, named Pri.Sma, is currently supporting the GPs for assigning COVID-19 vaccine administration priorities to their assistants.
6.1. Clinical validation
Further clinical validation of the overall CDSS was performed on an additional dataset of 55,621 patients collected by other 37 GPs. In the first analysis, the 37 GPs focused on reanalyzing only the misclassified patients by the ML algorithm, with the purpose of verifying whether the predicted PC is more effective compared to their previous annotation. The main objective of this analysis was to inspect how the proposed CDSS, in some situations, is also able to offer a more effective PC proposal than GPs by discovering particular patterns that can be sometimes unsighted by physicians. We found how the GPs revised their annotations in 21% of the total of misclassified patients, by confirming the correct prediction of the ML algorithm. Moreover, we evaluated the generalization power of the proposed CDSS by propagating the error between layers and by evaluating the accuracy between all the predicted PC and the ground-truth labels for each different tolerance threshold. The predicted PC is considered correct if its deviation with respect to the ground-truth labels falls within a specific threshold. Thus, a greater threshold reflects a more tolerance to the misclassification error of the model. Our model correctly predicts the PC class up to an overall accuracy of 89.60% with a tolerance threshold of (see Fig. 7 ). This outcome is also in line with the clinical and ethic guidelines in order to provide a CDSS based on ML that is as aligned as possible with the GP (Human agency and oversight, [25]).
Fig. 7.
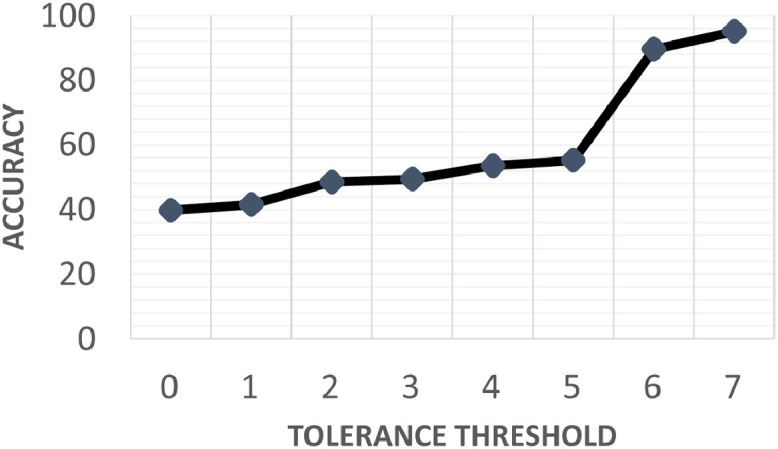
Clinical validation of the overall CDSS from a different dataset of 55,621 patients collected by 37 GPs: accuracy between all the predicted PC and the ground-truth labels by setting different tolerance threshold. The predicted PC is considered correct if its deviation with respect to the ground-truth labels falls within a specific threshold.
7. Conclusions
The COVID-19 outbreak poses an unprecedented challenge for policymakers and healthcare workers across the world, by highlighting the need for preventive and precise solutions capable to provide clinical support for the treatment and management of the COVID-19 patients. In conclusion, our work has the potential to play a fundamental role in this scenario, for the development of learning healthcare systems, that may support the vaccination campaign by providing indications that although not definitive, would help the GP to establish the priorities to vaccine administration. We also demonstrated the high level of generalization of the proposed HPC-XGB approach across new unseen patients from different GPs. One limitation of the proposed approach lies in considering only static predictors (i.e. Anagraphic, Monitoring and Pathologies field) in the proposed ML model. Interesting future work in this context may be addressed to consider the temporal observations of laboratory exams. Although we can have a limited and sparse set of exams for each patient, a multiple-instance-based approach may encourage a temporal structure of the value of the exams for each patient while dealing with the sparse nature of this task [33]. To better integrate ordinal structure among classes, and to further minimize the error between distant classes, another interesting future direction would be to extend the HPC-XGB methodology for imposing an ordinal constraint among priority classes within the age-related subtasks. This may involve the introduction of an ordinal loss (e.g. quadratic weight kappa loss [34]) in the HPC-XGB for penalizing the misclassification errors that are further from the correct classes.
Declaration of Competing Interest
The authors declare that they have no competing interests.
Acknowlgedgments
The present study has been supported by a research agreement among the Italian Federation of General Practitioner, Netmedica Italia and the Department of Information Engineering, Universitá Politecnica delle Marche, Ancona, Italy and by the ”Microsoft Grant Award: AI for Health COVID-19”. Authors would like to give a special thanks to Dr. Paolo Misericordia, Dr. Nicola Calabrese, Dr. Rino Moraglia, Ing. Alessandro Dalle Vedove and all 11 GPs (Core Data Team).
Biographies

Luca Romeo received a Ph.D. degree in computer science from the Department of Information Engineering (DII), Universitá Politecnica delle Marche, in 2018. His Ph.D. thesis was on “applied machine learning for human motion analysis and affective computing”. He is currently a PostDoc Researcher with DII and he is affiliated with the Unit of Computational Statistics and Machine Learning, Fondazione Istituto Italiano di Tecnologia Genova. His research topics include Machine learning applied to biomedical applications, EHR data, affective computing and motion analysis.

Emanuele Frontoni is Professor of “Fondamenti di Informatica” and “Computer Vision” at the Universitá Politecnica delle Marche, Engineering Faculty. He received the doctoral degree in electronic engineering from the University of Ancona, Italy, in 2003. In the same year he joined the Dept. of Ingegneria Informatica, Gestionale e dell’Automazione (DIIGA) as a Ph.D. student in “Intelligent Artificial Systems”. He obtained his PhD in 2006 discussing a thesis on Vision Based Robotics. His research focuses on applying computer science, artificial intelligence and computer vision techniques to mobile robots and innovative IT applications.
Footnotes
Python code used in the experiments will be made available at the following Github repository: https://github.com/whylearning22/HPC-XGB
References
- 1.Bernardini M., Romeo L., Misericordia P., Frontoni E. Discovering the type 2 diabetes in electronic health records using the sparse balanced support vector machine. IEEE J Biomed Health Inform. 2019;24(1):235–246. doi: 10.1109/JBHI.2019.2899218. [DOI] [PubMed] [Google Scholar]
- 2.Romeo L., Armentano G., Nicolucci A., Vespasiani M., Vespasiani G., Frontoni E. In: Proceedings of the Twenty-Ninth International Joint Conference on Artificial Intelligence, IJCAI-20. Bessiere C., editor. International Joint Conferences on Artificial Intelligence Organization; 2020. A novel spatio-temporal multi-task approach for the prediction of diabetes-related complication: a cardiopathy case of study; pp. 4299–4305. [Google Scholar]; Special track on AI for CompSust and Human well-being
- 3.Giersing B.K., Kahn A.-L., Jarrahian C., Mvundura M., Rodriguez C., Okayasu H., Zehrung D. Challenges of vaccine presentation and delivery: how can we design vaccines to have optimal programmatic impact? Vaccine. 2017;35(49):6793–6797. doi: 10.1016/j.vaccine.2017.04.063. [DOI] [PubMed] [Google Scholar]
- 4.Dorratoltaj N., Marathe A., Lewis B.L., Swarup S., Eubank S.G., Abbas K.M. Epidemiological and economic impact of pandemic influenza in chicago: priorities for vaccine interventions. PLoS Comput. Biol. 2017;13(6):e1005521. doi: 10.1371/journal.pcbi.1005521. [DOI] [PMC free article] [PubMed] [Google Scholar]
- 5.Du J., Xu J., Song H., Liu X., Tao C. Optimization on machine learning based approaches for sentiment analysis on hpv vaccines related tweets. J Biomed Semantics. 2017;8(1):1–7. doi: 10.1186/s13326-017-0120-6. [DOI] [PMC free article] [PubMed] [Google Scholar]
- 6.Lalmuanawma S., Hussain J., Chhakchhuak L. Applications of machine learning and artificial intelligence for covid-19 (sars-cov-2) pandemic: a review. Chaos, Solitons & Fractals. 2020:110059. doi: 10.1016/j.chaos.2020.110059. [DOI] [PMC free article] [PubMed] [Google Scholar]
- 7.Santoli J.M. Effects of the covid-19 pandemic on routine pediatric vaccine ordering and administration’united states, 2020. MMWR Morb. Mortal. Wkly. Rep. 2020;69 doi: 10.15585/mmwr.mm6919e2. [DOI] [PubMed] [Google Scholar]
- 8.Watkinson P., Clifton D., Collins G., McCulloch P., Morgan L., Group D.-A.S., et al. Decide-ai: new reporting guidelines to bridge the development-to-implementation gap in clinical artificial intelligence. Nat. Med. 2021;27(2021):186–187. doi: 10.1038/s41591-021-01229-5. [DOI] [PubMed] [Google Scholar]
- 9.Wiens J., Shenoy E.S. Machine learning for healthcare: on the verge of a major shift in healthcare epidemiology. Clinical Infectious Diseases. 2018;66(1):149–153. doi: 10.1093/cid/cix731. [DOI] [PMC free article] [PubMed] [Google Scholar]
- 10.Talaei-Khoei A., Wilson J.M. Identifying people at risk of developing type 2 diabetes: a comparison of predictive analytics techniques and predictor variables. Int J Med Inform. 2018;119:22–38. doi: 10.1016/j.ijmedinf.2018.08.008. [DOI] [PubMed] [Google Scholar]
- 11.Pimentel A., Carreiro A.V., Ribeiro R.T., Gamboa H. Screening diabetes mellitus 2 based on electronic health records using temporal features. Health Informatics J. 2018;24(2):194–205. doi: 10.1177/1460458216663023. [DOI] [PubMed] [Google Scholar]
- 12.Zhao J., Gu S., McDermaid A. Predicting outcomes of chronic kidney disease from emr data based on random forest regression. Math Biosci. 2019;310:24–30. doi: 10.1016/j.mbs.2019.02.001. [DOI] [PMC free article] [PubMed] [Google Scholar]
- 13.Liu P., Fu B., Yang S.X., Deng L., Zhong X., Zheng H. Optimizing survival analysis of xgboost for ties to predict disease progression of breast cancer. IEEE Trans. Biomed. Eng. 2020;68(1):148–160. doi: 10.1109/TBME.2020.2993278. [DOI] [PubMed] [Google Scholar]
- 14.Li S., Zhang X. Research on orthopedic auxiliary classification and prediction model based on xgboost algorithm. Neural Computing and Applications. 2019:1–9. [Google Scholar]
- 15.Lei B., Yang M., Yang P., Zhou F., Hou W., Zou W., Li X., Wang T., Xiao X., Wang S. Deep and joint learning of longitudinal data for alzheimer’s disease prediction. Pattern Recognit. 2020;102:107247. [Google Scholar]
- 16.Liu X., Zhou L., Wang L., Zhang J., Yin J., Shen D. An efficient radius-incorporated mkl algorithm for alzheimer’s disease prediction. Pattern Recognit. 2015;48(7):2141–2150. [Google Scholar]
- 17.Cao P., Shan X., Zhao D., Huang M., Zaiane O. Sparse shared structure based multi-task learning for mri based cognitive performance prediction of alzheimer’s disease. Pattern Recognit. 2017;72:219–235. [Google Scholar]
- 18.Cao P., Liu X., Yang J., Zhao D., Huang M., Zaiane O. L2,1-l1 regularized nonlinear multi-task representation learning based cognitive performance prediction of alzheimer’s disease. Pattern Recognit. 2018;79:195–215. [Google Scholar]
- 19.Bernardini M., Romeo L., Frontoni E., Amini M.-R. A semi-supervised multi-task learning approach for predicting short-term kidney disease evolution. IEEE J Biomed Health Inform. 2021:1. doi: 10.1109/JBHI.2021.3074206. [DOI] [PubMed] [Google Scholar]
- 20.Xiao F. Ced: a distance for complex mass functions. IEEE Trans Neural Netw Learn Syst. 2021;32(4):1525–1535. doi: 10.1109/TNNLS.2020.2984918. [DOI] [PubMed] [Google Scholar]
- 21.Xiao F. Ceqd: a complex mass function to predict interference effects. IEEE Trans Cybern. 2021:1–13. doi: 10.1109/TCYB.2020.3040770. [DOI] [PubMed] [Google Scholar]
- 22.Xiao F. Generalization of dempster–shafer theory: a complex mass function. Applied Intelligence. 2020;50:3266–3275. [Google Scholar]
- 23.Suárez J.L., García S., Herrera F. A tutorial on distance metric learning: mathematical foundations, algorithms, experimental analysis, prospects and challenges. Neurocomputing. 2021;425:300–322. [Google Scholar]
- 24.Frontoni E., Romeo L., Bernardini M., Moccia S., Migliorelli L., Paolanti M., Ferri A., Misericordia P., Mancini A., Zingaretti P. A decision support system for diabetes chronic care models based on general practitioner engagement and ehr data sharing. IEEE J Transl Eng Health Med. 2020;8:1–12. doi: 10.1109/JTEHM.2020.3031107. [DOI] [PMC free article] [PubMed] [Google Scholar]
- 25.Ethics Guidelines for Trustworthy Ai, (https://ec.europa.eu/digital-single-market/en/news/ethics-guidelines-trustworthy-ai), Accessed: 2021-03-31.
- 26.Dietz W., Santos-Burgoa C. Obesity and its implications for covid-19 mortality. Obesity. 2020;28(6):1005. doi: 10.1002/oby.22818. [DOI] [PubMed] [Google Scholar]
- 27.Romero Starke K., Petereit-Haack G., Schubert M., Kämpf D., Schliebner A., Hegewald J., Seidler A. The age-related risk of severe outcomes due to covid-19 infection: a rapid review, meta-analysis, and meta-regression. Int J Environ Res Public Health. 2020;17(16) doi: 10.3390/ijerph17165974. [DOI] [PMC free article] [PubMed] [Google Scholar]
- 28.Singh A., Nadkarni G., Gottesman O., Ellis S.B., Bottinger E.P., Guttag J.V. Incorporating temporal ehr data in predictive models for risk stratification of renal function deterioration. J Biomed Inform. 2015;53:220–228. doi: 10.1016/j.jbi.2014.11.005. [DOI] [PMC free article] [PubMed] [Google Scholar]
- 29.Chen T., Guestrin C. Proceedings of the 22nd acm sigkdd international conference on knowledge discovery and data mining. 2016. Xgboost: A scalable tree boosting system; pp. 785–794. [Google Scholar]
- 30.Cartwright D.J. 2013. Icd-9-Cm to Icd-10-Cm Codes: What? Why? How? [DOI] [PMC free article] [PubMed] [Google Scholar]
- 31.Cawley G.C., Talbot N.L. On over-fitting in model selection and subsequent selection bias in performance evaluation. Journal of Machine Learning Research. 2010;11(Jul):2079–2107. [Google Scholar]
- 32.van Rosendael A.R., Maliakal G., Kolli K.K., Beecy A., Al’Aref S.J., Dwivedi A., Singh G., Panday M., Kumar A., Ma X., et al. Maximization of the usage of coronary cta derived plaque information using a machine learning based algorithm to improve risk stratification; insights from the confirm registry. J Cardiovasc Comput Tomogr. 2018;12(3):204–209. doi: 10.1016/j.jcct.2018.04.011. [DOI] [PubMed] [Google Scholar]
- 33.Dennis D., Pabbaraju C., Simhadri H.V., Jain P. Advances in Neural Information Processing Systems. 2018. Multiple instance learning for efficient sequential data classification on resource-constrained devices; pp. 10953–10964. [Google Scholar]
- 34.Vargas V.M., Gutiérrez P.A., Hervás-Martínez C. Cumulative link models for deep ordinal classification. Neurocomputing. 2020;401:48–58. [Google Scholar]